Demographics of the Gambia
| Demographics of The Gambia |
|---|
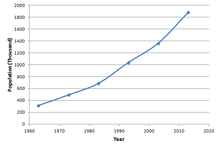
Scatter plot of the population of The Gambia (in thousands) from 1963–2013 |
| Population |
1,882,450 (2013) |
|---|
| Density |
176.1/sq km (2013) |
|---|
| Growth rate |
38.3% |
|---|
| Birth rate |
32.6 births/1,000 population (2013 est.) |
|---|
| Death rate |
7.3 deaths/1,000 population (2013 est.) |
|---|
| Life expectancy |
64.1 (2013 est.) |
|---|
| • male |
61.8 (2013 est.) |
|---|
| • female |
66.5 (2013 est.) |
|---|
| Fertility rate |
4.0 children born/woman (2013 est.) |
|---|
| Infant mortality rate |
67.6 deaths/1,000 live births (2013 est.) |
|---|
| Age structure |
|---|
| 0–14 years |
39.2% (2013 est.) |
|---|
| 15–64 years |
57.6% (2013 est.) |
|---|
| 65 and over |
3.2% (2013 est.) |
|---|
| Sex ratio |
|---|
| Total |
0.98 (2013) |
|---|
| At birth |
1.03 (2013 est.) |
|---|
| Under 15 |
1.01 (2013 est.) |
|---|
| 15–64 years |
0.96 (2013 est.) |
|---|
| 65 and over |
0.90 (2013 est.) |
|---|
| Nationality |
|---|
| Nationality |
Noun: Gambian |
|---|
| Major ethnic |
African (99%) (2003) |
|---|
| Minor ethnic |
Non-African (1%) (2003) |
|---|
| Language |
|---|
| Official |
English |
|---|
| Spoken |
Mandinka, Wolof, Fula |
|---|
The demographics characteristics of the population of The Gambia are known through national censuses, conducted in ten-year intervals and analyzed by The Gambian Bureau of Statistics (GBOS) since 1963. The latest census was conducted in 2013. The population of The Gambia at the 2013 census was 1.8 million. The population density is 176.1 per square kilometer, and the overall life expectancy in The Gambia is 64.1 years. Since the first census of 1963, the population of The Gambia has increased every ten years by an average of 43.2 percent. Since 1950s, the birth rate has constantly exceeded the death rate; the natural growth rate is positive. The Gambia is in the second stage of demographic transition. In terms of age structure, The Gambia is dominated by 15- to 64-year-old segment (57.6%). The median age of the population is 19.9 years, and the gender ratio of the total population is 0.98 males per female.
Population
| Historical population of The Gambia |
|---|
| Year | Pop. | ±% |
|---|
| 1963 | 315,486 | — |
|---|
| 1973 | 493,499 | +56.4% |
|---|
| 1983 | 687,817 | +39.4% |
|---|
| 1993 | 1,038,145 | +50.9% |
|---|
| 2003 | 1,360,681 | +31.1% |
|---|
| 2013 | 1,882,450 | +38.3% |
|---|
| Source: The Gambia Bureau of Statistics[1] |
With a population of 1.88 million in 2013, The Gambia ranks 149th in the world by population.[1] Its population density is 176.1 inhabitants per square kilometer (456.1 inhabitants per square mile).[2] The overall life expectancy in The Gambia is 64.1 years.[3] The total fertility rate of 3.98 is one of the highest in the world.[4] Since 1950, the United Nations (UN) estimated the birth rate exceeds the death rate.[5] The Gambia Bureau of Statistics (GBOS) estimates the population of The Gambia is expected to reach 3.6 million in 20 years.[1] The population of The Gambia has increased each census, starting with 315 thousand in 1963 to 1.8 million in 2013.[1] The GBOS predicted the reason for the increase from 2003 to 2013 was more coverage in the latter census compared to the former's.[6]
Vital statistics
Registration of vital events is in the Gambia not complete. The Population Department of the United Nations prepared the following estimates.[7]
| Period |
Live births per year |
Deaths per year |
Natural change per year |
CBR* |
CDR* |
NC* |
TFR* |
IMR* |
| 1950-1955 | 13 000 | 9 000 | 4 000 | 43.7 | 31.3 | 12.4 | 5.29 | 221 |
| 1955-1960 | 16 000 | 10 000 | 6 000 | 48.3 | 30.6 | 17.8 | 5.46 | 210 |
| 1960-1965 | 20 000 | 12 000 | 8 000 | 50.2 | 29.7 | 20.5 | 5.70 | 199 |
| 1965-1970 | 22 000 | 12 000 | 10 000 | 50.8 | 28.2 | 22.6 | 5.96 | 185 |
| 1970-1975 | 26 000 | 12 000 | 14 000 | 52.0 | 23.9 | 28.1 | 6.20 | 164 |
| 1975-1980 | 31 000 | 12 000 | 19 000 | 52.6 | 20.1 | 32.6 | 6.34 | 140 |
| 1980-1985 | 35 000 | 11 000 | 24 000 | 50.5 | 16.4 | 34.1 | 6.29 | 117 |
| 1985-1990 | 42 000 | 12 000 | 30 000 | 48.1 | 13.7 | 34.4 | 6.14 | 101 |
| 1990-1995 | 49 000 | 14 000 | 35 000 | 46.5 | 13.1 | 33.4 | 6.03 | 93 |
| 1995-2000 | 54 000 | 15 000 | 39 000 | 44.7 | 12.2 | 32.6 | 5.80 | 86 |
| 2000-2005 | 59 000 | 15 000 | 44 000 | 42.4 | 10.9 | 31.5 | 5.46 | 80 |
| 2005-2010 | 64 000 | 16 000 | 48 000 | 39.3 | 9.8 | 29.5 | 5.10 | 74 |
| * CBR = crude birth rate (per 1000); CDR = crude death rate (per 1000); NC = natural change (per 1000); IMR = infant mortality rate per 1000 births; TFR = total fertility rate (number of children per woman) |
Fertility Rate (The Demographic Health Survey) [8]
Fertility Rate (TFR) (Wanted Fertility Rate) and CBR (Crude Birth Rate):
| Year |
CBR (Total) |
TFR (Total) |
CBR (Urban) |
TFR (Urban) |
CBR (Rural) |
TFR (Rural) |
| 2013 |
40,5 |
5,6 (4,7) |
37,7 |
4,7 (4,1) |
43,4 |
6,8 (5,6) |
|
Structure of the population (DHS 2013) (Males 23 904, Females 25 649 = 49 553) :
| Age Group |
Male (%) |
Female (%) |
Total (%) |
| 0-4 |
18,5 |
16,4 |
17,4 |
| 5-9 |
16,6 |
15,3 |
15,9 |
| 10-14 |
12,8 |
12,5 |
12,6 |
| 15-19 |
10,3 |
10,4 |
10,3 |
| 20-24 |
8,5 |
9,1 |
8,8 |
| 25-29 |
6,8 |
8,0 |
7,4 |
| 30-34 |
5,5 |
6,5 |
6,0 |
| 35-39 |
4,5 |
4,7 |
4,6 |
| 40-44 |
3,8 |
3,3 |
3,5 |
| 45-49 |
2,9 |
2,4 |
2,6 |
| 50-54 |
2,1 |
4,1 |
3,1 |
| 55-59 |
1,5 |
1,9 |
1,7 |
| 60-64 |
2,3 |
1,9 |
2,1 |
| 65-69 |
1,5 |
1,2 |
1,3 |
| 70-74 |
1,0 |
0,9 |
1,0 |
| 75-79 |
0,7 |
0,5 |
0,6 |
| 80+ |
0,8 |
1,0 |
0,9 |
|
| Age group |
Male (%) |
Female (%) |
Total (%) |
| 0-14 |
47,9 |
44,2 |
45,9 |
| 15-64 |
48,1 |
52,2 |
50,3 |
| 65+ |
4,0 |
3,6 |
3,8 |
|
See also
Notes
References