Devon County Council elections
Local elections in Devon are held every four years in order to vote for councillors on Devon County Council. Politically Devon is a shire county, thus the unitary authority areas of Plymouth and Torbay are not affected by the governance of Devon County Council. There are a total of 62 councillors on the council, the majority of whom are currently Conservative.
Political control
Conservative 1973 - 1985
No overall control 1985 - 1989
Conservative 1989 - 1993
No overall control 1993 - 1997
Liberal Democrat 1997 - 2001
No overall control 2001 - 2005
Liberal Democrat 2005 - 2009
Conservative 2009 -
Council elections
- Devon County Council election, 1973
- Devon County Council election, 1977
- Devon County Council election, 1981
- Devon County Council election, 1985
- Devon County Council election, 1989
- Devon County Council election, 1993
- Devon County Council election, 1997
- Devon County Council election, 2001
- Devon County Council election, 2005
- Devon County Council election, 2009
- Devon County Council election, 2013
County result maps
-
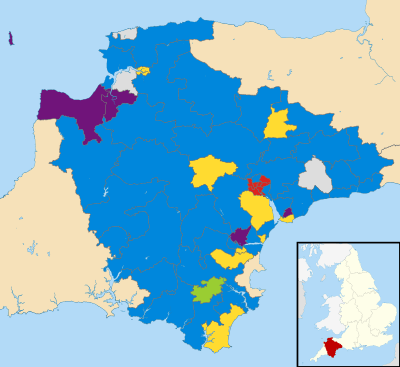
2013 results map
By-election results
| Party | Candidate | Votes | % | ± | |
|---|---|---|---|---|---|
| Conservative | 796 | 37.9 | |||
| Labour | 659 | 32.5 | |||
| Liberal Democrat | 599 | 29.5 | |||
| Majority | 110 | 5.4 | |||
| Turnout | 2,054 | 24.3 | |||
| Conservative hold | Swing | ||||
| Party | Candidate | Votes | % | ± | |
|---|---|---|---|---|---|
| Labour | 1,339 | 61.7 | -16.5 | ||
| Conservative | 414 | 19.1 | -2.8 | ||
| Liberal Democrat | 345 | 15.9 | +15.9 | ||
| 72 | 3.3 | +3.3 | |||
| Majority | 925 | 42.6 | |||
| Turnout | 2,170 | 23.0 | |||
| Labour hold | Swing | ||||
| Party | Candidate | Votes | % | ± | |
|---|---|---|---|---|---|
| Labour | 1,036 | 59.4 | +10.3 | ||
| Conservative | 336 | 19.3 | -7.0 | ||
| Liberal Democrat | 282 | 16.2 | -2.7 | ||
| Liberal | 90 | 5.2 | -0.5 | ||
| Majority | 700 | 40.1 | |||
| Turnout | 1,744 | ||||
| Labour hold | Swing | ||||
| Party | Candidate | Votes | % | ± | |
|---|---|---|---|---|---|
| Conservative | 1,163 | 45.5 | +27.5 | ||
| Liberal Democrat | 700 | 27.4 | -3.9 | ||
| Labour | 695 | 27.3 | +15.9 | ||
| Majority | 463 | 18.1 | |||
| Turnout | 2,558 | 32.0 | |||
| Conservative gain from Independent | Swing | ||||
| Party | Candidate | Votes | % | ± | |
|---|---|---|---|---|---|
| Conservative | 1,811 | 51.0 | +7.7 | ||
| Liberal Democrat | 1,505 | 42.4 | +4.6 | ||
| Labour | 150 | 4.2 | -5.4 | ||
| Liberal | 82 | 2.3 | -6.9 | ||
| Majority | 306 | 8.6 | |||
| Turnout | 3,548 | 40.0 | |||
| Conservative hold | Swing | ||||
| Party | Candidate | Votes | % | ± | |
|---|---|---|---|---|---|
| Conservative | 1,344 | 46.2 | +7.8 | ||
| Liberal Democrat | 1,291 | 44.3 | +1.4 | ||
| Labour | 277 | 9.5 | -9.3 | ||
| Majority | 53 | 1.9 | |||
| Turnout | 2,912 | 29.0 | |||
| Conservative gain from Liberal Democrat | Swing | ||||
| Party | Candidate | Votes | % | ± | |
|---|---|---|---|---|---|
| Liberal Democrat | 756 | 39.0 | +7.9 | ||
| Conservative | 686 | 35.4 | -2.6 | ||
| Independent | 318 | 16.4 | +8.9 | ||
| Independent | 178 | 9.2 | +4.2 | ||
| Majority | 70 | 3.6 | |||
| Turnout | 1,938 | 23.6 | |||
| Liberal Democrat gain from Conservative | Swing | ||||
| Party | Candidate | Votes | % | ± | |
|---|---|---|---|---|---|
| Liberal Democrat | Sheila Hobden | 1,330 | 41.3 | +7.3 | |
| Conservative | Jeffrey Coates | 1,090 | 33.8 | +3.0 | |
| Labour | Lesley Robson | 452 | 14.0 | -13.0 | |
| Independent | Sylvia Hardy | 351 | 10.9 | +10.9 | |
| Majority | 240 | 7.5 | |||
| Turnout | 3,223 | 26.3 | |||
| Liberal Democrat hold | Swing | ||||
| Party | Candidate | Votes | % | ± | |
|---|---|---|---|---|---|
| Conservative | William Mumford | 1,530 | 49.5 | +3.8 | |
| Liberal Democrat | Keith Baldry | 1,421 | 46.0 | +3.1 | |
| Labour | David Trigger | 140 | 4.5 | +4.5 | |
| Majority | 109 | 3.5 | |||
| Turnout | 3,091 | 35.9 | |||
| Conservative hold | Swing | ||||
| Party | Candidate | Votes | % | ± | |
|---|---|---|---|---|---|
| Liberal Democrat | Vanessa Newcombe | 1,265 | 39.3 | -4.5 | |
| Conservative | Margaret Baldwin | 1,211 | 37.6 | +17.8 | |
| Labour | Allan Hart | 568 | 17.7 | -8.7 | |
| Green | Andrew Bell | 174 | 5.4 | +0.8 | |
| Majority | 54 | 1.7 | |||
| Turnout | 3,218 | 30.0 | |||
| Liberal Democrat hold | Swing | ||||
| Party | Candidate | Votes | % | ± | |
|---|---|---|---|---|---|
| Conservative | Richard Hosking | 2,493 | 57.9 | +6.8 | |
| Liberal Democrat | Brian Blake | 1,028 | 23.9 | +6.2 | |
| Labour | David Trigger | 706 | 16.4 | +16.4 | |
| Majority | 1,465 | 34.0 | +1.8 | ||
| Turnout | 4,307 | 47.6 | +11.8 | ||
| Conservative hold | Swing | ||||
References
- ↑ "Yealmpton by-election 22 May 2014". Devon County Council. Retrieved 28 October 2015.
External links
| Devon County Council | |
|---|---|
| East Devon District Council |
|
| Exeter City Council | |
| Mid Devon District Council |
|
| North Devon District Council | |
| Plymouth City Council | |
| South Hams District Council | |
| Teignbridge District Council |
|
| Torbay Council | |
| Torridge District Council | |
| West Devon Borough Council | |
| |
This article is issued from Wikipedia - version of the 4/11/2016. The text is available under the Creative Commons Attribution/Share Alike but additional terms may apply for the media files.