Extremaduran parliamentary election, 1987
Extremaduran parliamentary election, 1987
.svg.png)
|
|
|
|
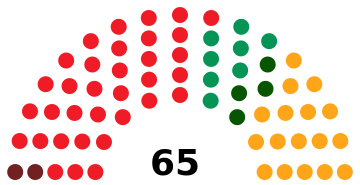
All 65 seats in the Assembly of Extremadura
33 seats needed for a majority |
| Registered |
808,654  2.9% 2.9% |
| Turnout |
601,615 (74.4%)
2.5 pp |
| |
First party |
Second party |
Third party |
| |
.jpg) |
 |
|
| Leader |
Juan Carlos Rodríguez Ibarra |
Adolfo Díaz-Ambrona |
Tomás Martín Tamayo |
| Party |
PSOE |
AP |
CDS |
| Leader since |
20 December 1982 |
1976 |
1983 |
| Last election |
35 seats, 53.0% |
20 seats, 30.1%[lower-alpha 1] |
0 seats, 0.8% |
| Seats won |
34 |
17 |
8 |
| Seat change |
 1 1 |
3 |
8 |
| Popular vote |
292,935 |
144,117 |
73,572 |
| Percentage |
49.2% |
24.2% |
12.4% |
| Swing |
3.8 pp |
5.9 pp |
11.6 pp |
|
| |
Fourth party |
Fifth party |
| |
|
|
| Leader |
Pedro Cañada |
Manuel Pareja |
| Party |
EU |
IU |
| Leader since |
10 December 1980 |
1983 |
| Last election |
6 seats, 8.5% |
4 seats, 6.5%[lower-alpha 2] |
| Seats won |
4 |
2 |
| Seat change |
2 |
2 |
| Popular vote |
34,606 |
32,240 |
| Percentage |
5.8% |
5.4% |
| Swing |
2.7 pp |
1.1 pp |
|
|
|
The 1987 Extremaduran parliamentary election was held on Wednesday, 10 June 1987, to elect the 2nd Assembly of Extremadura, the unicameral regional legislature of the Spanish autonomous community of Extremadura. At stake were all 65 seats in the Assembly, determining the President of Extremadura.
The Spanish Socialist Workers' Party (PSOE) won the election with a new absolute majority of seats, albeit losing 1 seat from its 1983 result. The People's Alliance (AP), which had undergone an internal crisis after the breakup of the People's Coalition in 1986, lost support and fell from the coalition's 30% of the share to 24%, losing 3 seats as a result.
The main election winner was the centrist Democratic and Social Centre (CDS), a party led by the former Spanish Prime Minister Adolfo Suarez, which entered the Assembly for the first with 8 seats and 12% of the vote, becoming the only party within the Assembly that made gains, as all others (including regionalist United Extremadura (EU)) lost votes. United Left, an electoral coalition comprising the Communist Party of Spain and other left-wing parties, also lost 2 seats.
Electoral system
The number of seats in the Extremaduran Assembly was set to a fixed-number of 65. All Assembly members were elected in 2 multi-member districts, corresponding to Extremadura's two provinces, using the D'Hondt method and a closed-list proportional representation system. Each district was entitled to an initial minimum of 20 seats, with the remaining 25 seats allocated among the two provinces in proportion to their populations. For the 1987 election, seats were distributed as follows: Badajoz (35) and Cáceres (30).
Voting was on the basis of universal suffrage in a secret ballot. Only lists polling above 5% of valid votes in each district (which include blank ballots—for none of the above) were entitled to enter the seat distribution. Alternatively, however, if a party did not reach the 5% threshold in a district, it could enter the seat distribution on the following conditions:
- 1. That the party did stood in both districts.
- 2. That, regionally, the party did reach the 5% threshold (even if it did not reach it in one of the two districts).[1]
Results
Overall
← Summary of the 10 June 1987 Extremaduran Assembly election results →
| |
| Party |
Vote |
Seats |
| Votes |
% |
±pp |
Won |
+/− |
|
Spanish Socialist Workers' Party (PSOE) |
292,935 | 49.18 | 3.84 |
34 | 1 |
|
People's Alliance (AP)[lower-alpha 1] |
144,117 | 24.19 | 5.91 |
17 | 3 |
|
Democratic and Social Centre (CDS) |
73,572 | 12.35 | 11.56 |
8 | 8 |
|
United Extremadura (EU) |
34,606 | 5.81 | 2.67 |
4 | 2 |
|
United Left (IU)[lower-alpha 2] |
32,240 | 5.41 | 1.07 |
2 | 2 |
| |
|
Workers' Party of Spain–Communist Unity (PTE-UC) |
5,317 | 0.89 | New |
0 | ±0 |
|
People's Democratic Party (PDP) |
5,203 | 0.87 | New |
0 | ±0 |
|
Liberal Party (PL) |
2,286 | 0.38 | New |
0 | ±0 |
|
Humanist Platform (PH) |
619 | 0.10 | New |
0 | ±0 |
|
Blank ballots |
4,785 | 0.80 | 0.33 |
|
| |
| Total |
595,680 | 100.00 | |
65 | ±0 |
| |
| Valid votes |
595,680 | 99.01 | 0.08 |
|
| Invalid votes |
5,935 | 0.99 | 0.08 |
| Votes cast / turnout |
601,615 | 74.40 | 2.50 |
| Abstentions |
207,039 | 25.60 | 2.50 |
| Registered voters |
808,654 | |
| |
| Source: Argos Information Portal |
| Vote share |
|---|
|
|
|
|
|
| PSOE |
|
49.18% |
| AP |
|
24.19% |
| CDS |
|
12.35% |
| EU |
|
5.81% |
| IU |
|
5.41% |
| Others |
|
2.26% |
| Blank ballots |
|
0.80% |
| Parliamentary seats |
|---|
|
|
|
|
|
| PSOE |
|
52.31% |
| AP |
|
26.15% |
| CDS |
|
12.31% |
| EU |
|
6.15% |
| IU |
|
3.08% |
Results by province

Election results by province.
| Badajoz |
| Party |
Vote |
Seats |
| Votes |
% |
±pp |
Won |
+/− |
|
Spanish Socialist Workers' Party (PSOE) |
186,753 | 51.87 | 4.75 |
19 | 1 |
|
People's Alliance (AP)[lower-alpha 1] |
85,550 | 23.76 | 7.09 |
9 | 2 |
|
Democratic and Social Centre (CDS) |
47,520 | 13.20 | New |
5 | 5 |
|
United Left (IU)[lower-alpha 2] |
25,183 | 6.99 | 1.31 |
2 | 1 |
| |
|
United Extremadura (EU) |
5,881 | 1.63 | 1.72 |
0 | 1 |
|
People's Democratic Party (PDP) |
3,625 | 1.01 | New |
0 | ±0 |
|
Workers' Party of Spain–Communist Unity (PTE-UC) |
2,582 | 0.72 | New |
0 | ±0 |
|
Blank ballots |
2,967 | 0.82 | 0.37 |
|
| |
| Total |
360,061 | 100.00 | |
35 | ±0 |
| |
| Valid votes |
360,061 | 98.97 | 0.09 |
|
| Invalid votes |
3,757 | 1.03 | 0.09 |
| Votes cast / turnout |
363,818 | 74.21 | 2.13 |
| Abstentions |
126,459 | 25.79 | 2.13 |
| Registered voters |
490,277 | |
| |
| Source: Argos Information Portal |
|
| Caceres |
| Party |
Vote |
Seats |
| Votes |
% |
±pp |
Won |
+/− |
|
Spanish Socialist Workers' Party (PSOE) |
106,182 | 45.07 | 2.45 |
15 | ±0 |
|
People's Alliance (AP)[lower-alpha 1] |
58,567 | 24.86 | 4.10 |
8 | 1 |
|
United Extremadura (EU) |
28,725 | 12.19 | 4.13 |
4 | 1 |
|
Democratic and Social Centre (CDS) |
26,052 | 11.06 | 9.07 |
3 | 3 |
| |
|
United Left (IU)[lower-alpha 2] |
7,057 | 3.00 | 0.70 |
0 | 1 |
|
Workers' Party of Spain–Communist Unity (PTE-UC) |
2,735 | 1.16 | New |
0 | ±0 |
|
Liberal Party (PL) |
2,286 | 0.97 | New |
0 | ±0 |
|
People's Democratic Party (PDP) |
1,578 | 0.67 | New |
0 | ±0 |
|
Humanist Platform (PH) |
619 | 0.26 | New |
0 | ±0 |
|
Blank ballots |
1,818 | 0.77 | 0.27 |
|
| |
| Total |
235,619 | 100.00 | |
30 | ±0 |
| |
| Valid votes |
235,619 | 99.08 | 0.05 |
|
| Invalid votes |
2,178 | 0.92 | 0.05 |
| Votes cast / turnout |
237,797 | 74.69 | 3.07 |
| Abstentions |
80,580 | 25.31 | 3.07 |
| Registered voters |
318,377 | |
| |
| Source: Argos Information Portal |
|
Notes
References