German-speaking electoral college
| German-speaking electoral college | |
|---|---|
| European Parliament constituency | |
 Location among the 2014 constituencies | |
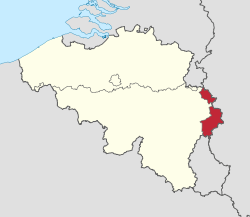 Shown within Belgium | |
| Member state | Belgium |
| Created | 1994 |
| MEPs | 1 |
| Sources | |
The German-speaking electoral college is one of three constituencies of the European Parliament in Belgium. It elects 1 MEP by first past the post.
This is the European Parliament's smallest constituency, with an electorate at the 2004 election of just 46,914. Since the German-speaking electoral college elects only one member, the winner is effectively chosen by the first past the post method. This makes it the only European Parliament constituency without proportional representation.
Boundaries
The constituency corresponds to the German-speaking Community of Belgium.
Member of the European Parliament
| Term | Member | Party | |
|---|---|---|---|
| 1994–2014 | Mathieu Grosch | Christian Social Party (EPP) | |
| 2014–present | Pascal Arimont | Christian Social Party (EPP) | |
Election results
2014
| Party | EP Group | Votes | % | Change | |
|---|---|---|---|---|---|
| Christian Social Party (CSP) | EPP | 11,739 | 30.36 | | |
| Ecolo | G-EFA | 6,440 | 16.66 | | |
| Party for Freedom and Progress (PFF) | ALDE | 6,204 | 16.05 | | |
| Socialist Party (SP) | S&D | 5,841 | 15.11 | | |
| ProDG | None | 5,113 | 13.22 | | |
| Vivant | None | 3,328 | 8.61 | | |
| Total | 38,665 | – | |||
2009
| Party | EP Group | Votes | % | Change | |
|---|---|---|---|---|---|
| Christian Social Party (CSP) | EPP | 12,475 | 32.25 | | |
| Party for Freedom and Progress (PFF) | ALDE | 7,878 | 20.37 | | |
| Ecolo | G-EFA | 6,025 | 15.58 | | |
| Socialist Party (SP) | PES | 5,658 | 14.63 | | |
| ProDG | None | 3,895 | 10.07 | | |
| Vivant | None | 2,417 | 6.25 | New | |
| Europa de Weirte | None | 328 | 0.85 | New | |
| Total | 38,680 | – | |||
2004
| Party | EP Group | Votes | % | Change | |
|---|---|---|---|---|---|
| Christian Social Party (CSP) | EPP | 15,722 | 42.49 | | |
| Party for Freedom and Progress (PFF) | ELDR | 8,434 | 22.79 | | |
| Socialist Party (SP) | PES | 5,527 | 14.94 | | |
| Ecolo | G-EFA | 3,880 | 10.49 | | |
| Party of German-speaking Belgians (PDB) | None | 3,442 | 9.3 | | |
| Total | – | ||||
1999
| Party | EP Group | Votes | % | Change | |
|---|---|---|---|---|---|
| Christian Social Party (CSP) | EPP | 13,456 | 36.47 | | |
| Party for Freedom and Progress (PFF) | ELDR | 7,234 | 19.60 | | |
| Ecolo | G-EFA | 6,276 | 17.01 | | |
| Socialist Party (SP) | PES | 4,215 | 11.42 | | |
| Party of German-speaking Belgians (PDB) | None | 3,661 | 9.92 | | |
| Vivant | None | 1,198 | 3.25 | New | |
| All Others | — | 860 | 2.16 | — | |
| Total | – | ||||
1994
| Party | EP Group | Votes | % | |
|---|---|---|---|---|
| Christian Social Party (CSP) | EPP | 11,999 | 31.29 | |
| Party for Freedom and Progress (PFF) | ELDR | 7,690 | 20.06 | |
| Party of German-speaking Belgians (PDB) | None | 5,945 | 15.51 | |
| Ecolo | G | 5,714 | 14.90 | |
| Socialist Party (SP) | PES | 4,820 | 12.57 | |
| Juropa | None | 1,969 | 5.14 | |
| Workers' Party of Belgium (PAB) | None | 205 | 0.53 | |
| Total | ||||
External links
This article is issued from Wikipedia - version of the 1/10/2016. The text is available under the Creative Commons Attribution/Share Alike but additional terms may apply for the media files.