Icinga
|
| |
| Initial release | May 2009 |
|---|---|
| Stable release |
2.4.9 (Icinga 2)
/ May 19, 2016[1] |
| Development status | Active |
| Written in | mixed |
| Operating system | Cross-platform |
| Type | Network monitoring |
| License | GPL version 2 |
| Website | www.icinga.org |
Icinga is an open source computer system and network monitoring application. It was originally created as a fork of the Nagios system monitoring application in 2009.[2]
Icinga is attempting to get past perceived short-comings in Nagios' development process,[3] as well as adding new features[4][5] such as a modern Web 2.0 style user interface, additional database connectors (for MySQL, Oracle, and PostgreSQL), and a REST API that lets administrators integrate numerous extensions without complicated modification of the Icinga core.
The Icinga developers also seek to reflect community needs more closely and to integrate patches more quickly. The first stable version, 1.0, was released in December 2009, and the version counter had risen every couple of months as of January 2010.[6]
Icinga was included by Jeffrey Hammond of Forrester Research in a list of "waxing" (as opposed to "waning") open source projects based on its rate of commits.[7]
The name Icinga is a Zulu word meaning "it looks for", "it browses" or "it examines"[8] and is pronounced with a click consonant.[9]
History
In May 2009, a group of developers from the Nagios community announced the fork Icinga, citing their dissatisfaction with the stagnant development of the Nagios software at the time and their desire to open its development to a broader base.[3]
In their first year, Icinga developers released separate versions of Core, API and Web, and celebrated their 10,000th download.[10]
In their second year, the Icinga project released unified and stable Core and Web; added dual-stack IPv6 / IPv4 support, optimized database connectivity and revamped the Icinga Web user interface, integrating various community add-ons (PNP4Nagios, LConf, Heatmap and Business Process Addon). The project achieved more than 70,000 downloads and grew to 23 team members.[10]
In their third year, Icinga celebrated their 100,000th download, integrated the Icinga API component into Icinga Web; improved SLA reporting; opened an official Freenode IRC group and extended the Icinga virtual appliances to the Debian, OpenSUSE and CentOS operating systems.[11]
In October 2012, the Icinga project released a technology preview of a core framework replacement and parallel development branch, Icinga 2. The developers expressed their intentions to rewrite the core to correct shortcomings such as complicated configuration and scalability limitations in large deployments.[12] The project signposted plans to write the Icinga 2 core mainly in C++, design a new component loader architecture and remodel the process of executing monitoring checks.[13]
In June 2014, the Icinga project released the first stable release of Icinga 2.[14] New features, for example an agent or api feature, are scheduled for later releases.
Timeline of releases
| Date | Release[15] | Notes |
|---|---|---|
| 9 March 2015 | Icinga 2 v2.3.0 | Feature release with configuration enhancements (functions, loops, conditionals, object accessors, time dependent thresholds, etc.), OpenTSDB support and troubleshoot cli command |
| 19 November 2014 | 1.12 | Classic UI enhancements & fixes |
| 17 November 2014 | Icinga 2 v2.2.0 | Feature release with remote clients, CSR auto-signing, cli, arrays/dictionaries in custom attributes |
| 29 August 2014 | Icinga 2 v2.1.0 | Feature release with enhanced configuration analysis, logging, cluster High Availability features |
| 16 June 2014 | Icinga 2 v2.0.0 | First stable release |
| 16 May 2014 | Icinga 2 v0.0.11 | Redesigned cluster feature with High Availability and load-balanced zones, command arguments & conditionals |
| 29 April 2014 | Icinga 2 v0.0.10 | Advanced apply rules for notifications, dependencies, custom attributes, etc. |
| 31 March 2014 | Icinga 2 v0.0.9 | Rule-based 'apply' logic, configuration usability, database schema update (MySQL, PostgreSQL) |
| 13 March 2014 | 1.11 | Interoperability (with Solaris, Oracle, IE) and user interface improvements |
| 11 March 2014 | Icinga 2 v0.0.8 | Dependencies as in-line dictionaries, cluster health checks, recursive 'config includes' |
| 7 February 2014 | Icinga 2 v0.0.7 | Automated tests in Vagrant, database IDO stability |
| 19 December 2013 | Icinga 2 v0.0.6 | Recurring downtimes, log command arguments, latency statistics |
| 3 December 2013 | Icinga 2 v0.0.5 | Performance improvements & bugfixes |
| 12 November 2013 | Icinga 2 v0.0.4 | IDO PostgreSQL, Livestatus history |
| 24 October 2013 | Icinga 2 v0.0.3 | IDO MySQL, Livestatus, Graphite, cluster setup, documentation |
| 24 October 2013 | 1.10 | Classic UI live search and on-demand filter selection, performance improvements |
| 2 July 2013 | Icinga 2 v0.0.2 | Technology preview with core 1.x compatibility layer |
| 7 May 2013 | 1.9 | Performance improvements and usability fixes |
| 25 October 2012 | Icinga 2 v0.0.1 | Technology preview of core framework replacement |
| 18 October 2012 | 1.8 | Community requested improvements to both optional user interfaces and Icinga Reporting |
| 15 May 2012 | 1.7 | Packaging simplified |
| 30 November 2011 | 1.6 | SLA reporting extension (optional) |
| 24 August 2011 | 1.5 | Icinga Reporting integrated into Icinga Web interface |
| 11 May 2011 | 1.4 | Improvements to both optional user interfaces |
| 16 February 2011 | 1.3 | Dual-stack IPv4 and IPv6 support |
| 13 October 2010 | Icinga Mobile | User interface for smartphones and tablets |
| 6 October 2010 | 1.2 | Unified, stable release |
| 18 August 2010 | 1.0.3 | Unified release, unstable Icinga Web |
| 30 July 2010 | 1.0.2 Core, 1.0.1 Web | Performance improvements |
| 3 March 2010 | 1.0.1 Core, 0.9.1 Web Beta | Performance improvements, Icinga Web enhancements |
| 16 December 2009 | 1.0 Core, 0.9.1 Web Alpha | Stable core, Oracle and PostgreSQL database support |
| 28 October 2009 | 1.0 RC Core | Initial Oracle database support |
| 15 September 2009 | 0.8.4 | IDOUtils bugfixes |
| 2 September 2009 | 0.8.3 | Initial PostgreSQL database support |
| 12 August 2009 | 0.8.2 | Icinga API integration |
| 16 June 2009 | 0.8.1 | Core bugfixes |
| 15 May 2009 | 0.8 | Initial release |
Features
Due to its nature as a fork, Icinga offers Nagios’ features with some additions such as optional reporting module with improved SLA accuracy, additional database connectors for PostgreSQL and Oracle, and distributed systems for redundant monitoring.
Icinga also maintains configuration and plug-in compatibility[10] with Nagios, facilitating migration between the two monitoring software.
Monitoring
- Monitoring of network services (SMTP, POP3, HTTP, NNTP, ping, etc.)
- Monitoring of host resources (CPU load, disk usage, etc.)
- Monitoring of server components (switches, routers, temperature and humidity sensors, etc.)
- Simple plug-in design that allows users to easily develop their own service checks
- Parallelized service checks
- Ability to define network host hierarchy using “parent” hosts, allowing detection of and distinction between hosts that are down and those that are unreachable
- Ability to define event handlers to be run during service or host events for proactive problem resolution
Notification
- Notification of contact persons when service or host problems occur and get resolved (via email, pager, or user-defined method)
- Escalation of alerts to other users or communication channels
Visualisation & Reporting
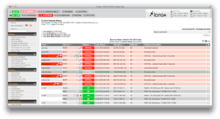
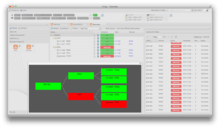
- Two optional user interfaces (Icinga Classic UI and Icinga Web) for visualization of host and service status, network maps, reports, logs, etc.
- Icinga Reporting module based on open source Jasper Reports for both Icinga Classic and Icinga Web user interfaces
- Template based reports (e.g. Top 10 problematic hosts or services, synopsis of complete monitoring environment, availability reports, etc.)
- Report repository with varying access levels and automated report generation and distribution
- Optional extension for SLA reporting that distinguishes between critical events from planned and unplanned downtimes and acknowledgement periods[16]
- Capacity utilization reporting
- Performance graphing via add-ons such as PNP4Nagios, NagiosGrapher and InGraph
Architecture
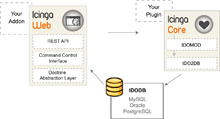
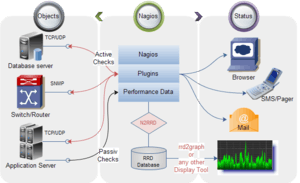
Icinga Core is written in C[17] and has a modular architecture with standalone core, user interface and database on which users can integrate various add-ons and plug-ins.
The latter communicate via Icinga’s Doctrine abstraction layer, REST and plug-in APIs – that mediate between the external data and internal structures. This bundling of components allows users to distribute Icinga’s system for redundant monitoring. It also offers users freedom to customise Icinga to suit their needs.[18]
Icinga Core
The Icinga Core manages monitoring tasks, receiving check results from various plug-ins. It then communicates these results to the IDODB (Icinga Data Out Database) through the IDOMOD (Icinga Data Out Module) interface and IDO2DB (Icinga Data Out to Database) service daemon over SSL encrypted TCP sockets. Though both come packaged (also known as IDOUtils) with the Core; they are single standing components, which can be separated to distribute the data and processes across multiple servers for distributed systems monitoring.
The Icinga Classic user interface also comes packaged with Icinga Core and can be used as a substitute to the PHP-based, Icinga Web interface
Icinga 2
Icinga 2 manages monitoring tasks, running checks, sending alert notifications. The Icinga 2 features can be enabled on-demand, be it default features such as the 'checker' or 'notification' component, or external interfaces compatible with Icinga 1.x and its user interfaces, for example the IDO DB (Icinga Data Out Database). Icinga 2 ships a built-in cluster stack secured by SSL x509 certificates attempting to make distributed monitoring setups more easy.
The configuration syntax is different to Icinga Core 1.x and Nagios and requires a migration on upgrade.
Icinga's User Interfaces
Icinga offers two web interfaces for users to view monitoring results and send commands to the Icinga Core.
Icinga Classic UI (also referred to as Classic Web) is based on the Nagios CGIs and retains its format. The Icinga project continues to add new features to this interface such as pagination, JSON output, and CSV export. This user interface comes packaged with the Icinga Core. Icinga’s Classic UI is similar to the Nagios web interface (Nagios CGIs), in that it sits in the same instance with the core, retrieving data through the cache and sending commands through pipe to the command files.
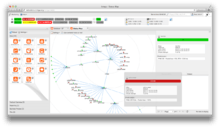
Icinga Web (also referred to as New Web) is the project’s Agavi and PHP based, Web 2.0 inspired front end that uses Cronks (widgets) to offer drag-n-drop customized dashboards. In contrast to the Icinga Classic UI, Icinga Web is a standalone piece of software. It communicates to the core, database and 3rd party add-ons through component layers: Doctrine abstraction layer (Input/Database), REST API (external scripts) and Command Control Interface (writing to pipe, executing commands).
Both user interfaces present information on host and service status, history, notifications and status maps to show the health of a network in real-time. Both also support IPv4 as well as IPv6 addresses.
Icinga Web 2 is currently developed in parallel to Classic UI and Web and was announced during the Open Source Monitoring Conference in November 2013.[19]
Icinga Data Out Database
The Icinga Data Out Database (IDODB) is a storage point for historical monitoring data for add-ons or the Icinga Web interface to access. In contrast to its predecessor Nagios, Icinga supports PostgreSQL and Oracle databases in addition to MySQL.
Icinga Reporting
The Icinga project offers an optional Icinga Reporting module based on the open source Jasper Reports. It can be integrated into both Icinga Classic and Icinga Web user interfaces. The module provides template-based reports (e.g. Top 10 problematic hosts or services, synopsis of complete monitoring environment, availability reports etc.) that can be saved to a repository with varying access levels and automated report generation and distribution. Reports can also be viewed in both of Icinga’s optional user interfaces.
Icinga Mobile
Icinga Mobile is a user interface for smartphones and tablet browsers that run on WebKit. These usually are available on iOS, Android, BlackBerry Tablet OS and webOS. Based on Javascript and Sencha Touch, Icinga Mobile is downloaded onto a server for access by authorized users via their mobile devices. Administration and updates can thus be made centrally, to automatically apply to all users of a computer network.[20]
Extended functionality
Icinga is compatible with all plug-ins and the majority of add-ons written for Nagios, especially for users opting for the Icinga Classic UI. Popular add-ons to extend Icinga’s functionality include:
- Performance graphing (e.g. PNP4Nagios, NagiosGrapher, InGraph)
- Configuration interfaces and tools (e.g. Nconf (tool for configuring Nagios), NagiosQL, LConf)
- Business process monitoring (e.g. Business Process Addons)
- Network visualization (e.g. NagVis, Nagmap)
- Windows monitoring (e.g. NSClient++, Cygwin)
- SNMP trap monitoring (e.g. SNMPTT, NagTrap)
Large, enterprise environments
Icinga has been successfully deployed in large and complex environments with thousands of hosts and services, in distributed and failover setups.[21] The software’s modular architecture with standalone Core, Web and IDODB (Icinga Data Out Database) facilitate distributed monitoring and distributed systems monitoring.
Nagios Remote Plugin Executor (NRPE) is an Icinga compatible agent that allows remote systems monitoring using scripts that are hosted on the remote systems. It allows for monitoring resources such as disk usage, system load or number of users currently logged in. Icinga periodically polls the agent on the remote system using the check_nrpe plug-in.
In setups using the optional Icinga Web user interface, monitoring data from multiple Icinga Core instances can be displayed as long as each instance writes to the same IDODB. In this way, distributed monitoring is also simpler to administer.
At a structural level, Icinga can have its various components split and scattered in a distributed set up. This distributed systems monitoring provides greater security and redundancy; if one component were to fail, another could take its place without disrupting the entire monitoring system.
The software also offers a fine-grained authentication system whereby user access, notifications and views can be customized to the detail of server groups, servers and services per individual.
See also
- Comparison of network monitoring systems
- Nagios – the original software that Icinga forked from
- Shinken (software) – an Icinga compatible replacement
- Pandora FMS - An Icinga alternative
References
- ↑ https://www.icinga.org/category/releases/
- ↑ Asay, Matt (6 May 2009). "Open-source working as advertised: ICINGA forks Nagios". CNET.
- 1 2 "Why a fork? - Icinga: Open Source Monitoring". Icinga. Retrieved 2013-03-12.
- ↑ Khamlichi, M.el. "ICINGA – An Advanced Opensource Monitoring Tool". Tutorial. Unixmen.
- ↑ "Open Source Monitoring: Icinga vs Nagios Sos open source". Sosopensource.com. 2010-11-25. Retrieved 2013-03-12.
- ↑ Benthin, Falko (2010). "Monitoring network computers with the Icinga Nagios fork". Admin Network & Security (1).
- ↑ http://www.wuerth-phoenix.com/fileadmin/Nagios_Conference_2012/Presentations/02_9.30_JeffreyHammond_OSSMC.pdf
- ↑ "– Zulu-English online dictionary". Isizulu.net. Retrieved 2013-03-12.
- ↑ "A lesson in Zulu: "Icinga" - "Eee-Chingaa", "Aye-Singa", 'c', 'see', 'g', 'ng - Icinga: Open Source Monitoring". Icinga. 2010-11-03. Retrieved 2013-03-12.
- 1 2 3 Mobily, Tony (27 April 2012). "Nagios Vs. Icinga: the real story of one of the most heated forks in free software". Free Software Magazine.
- ↑ "3 years old & 100,000 downloads! - Icinga, Classic, Doctrine - Icinga: Open Source Monitoring". Icinga. 2012-05-06. Retrieved 2013-03-12.
- ↑ Scherschel, Fabian (25 October 2012). "Technology preview of Icinga 2 brings extensive rewrite". The H Open.
- ↑ "Icinga 2 v.0.0.1 released! - What the hell is Icinga 2, download Icinga 2 the first technology preview v001 off Sourceforge now, What about Icinga 1x, testing, Development Roa". Icinga.org. 2012-10-25. Retrieved 2013-03-12.
- ↑ "Icinga 2.0 has arrived". Icinga.org. 2014-06-16. Retrieved 2014-09-03.
- ↑ "Major Releases - Icinga: Open Source Monitoring". Icinga. Retrieved 2013-03-12.
- ↑ Henning, Edward (6 December 2011). "Nagios fork Icinga 1.6 records SLA information". The H Open.
- ↑ "Intro - Icinga 2 - Icinga Wiki". Wiki.icinga.org. 2012-10-18. Retrieved 2013-03-12.
- ↑ "Features - Icinga: Open Source Monitoring". Icinga. Retrieved 2013-09-29.
- ↑ "Icinga Web… 2?". Icinga.org. 2013-11-20. Retrieved 2014-09-03.
- ↑ "Mobile - Icinga: Open Source Monitoring". Icinga. Retrieved 2013-03-12.
- ↑ "Users - Icinga: Open Source Monitoring". Icinga. Retrieved 2013-03-12.
External links
- icinga.org, official website
- dev.icinga.org, official development tracker and roadmap
- docs.icinga.org, official documentation
- wiki.icinga.org, official wiki
- exchange.icinga.org, plug-in and add-on repository to extend Icinga functionality
- monitoring-portal.org, community forum for user support and discussion