Jersey Shore Area School District
| Jersey Shore Area School District JSASD | |
|---|---|
 | |
| Address | |
|
175 A&P Drive Jersey Shore, Pennsylvania, Lycoming County 17740 United States | |
| Information | |
| Type | Public |
| Closed | Nippenose Valley ES June 2013 |
| School board | 9 elected members |
| Superintendent |
Dr Dorothy L Chappel Salary $126,000 (contract July 1, 2013 to June 30, 2016)[1][2] |
| Administrator | Ms Adrienne Craig, Business Manager |
| Principal | Dr Kenneth Dady, AES & JSAES |
| Principal | Mrs Nola Allison, SES |
| Principal | Mrs Laura Milarch, JSMS |
| Principal | Reed Mellinger, JSAHS |
| Staff | 139 non teaching staff (2013) |
| Faculty |
174 teachers (2013)[4] |
| Grades | K-12 |
| Age | 5 years to 21 years special education |
| Pupils |
2,558 (2015–16)[5] |
| • Kindergarten | 177 (2013), 221 (2010) |
| • Grade 1 | 222 (2013), 187 |
| • Grade 2 | 203 (2013), 217 |
| • Grade 3 | 201 (2013), 207 |
| • Grade 4 | 201 (2013), 207 |
| • Grade 5 | 182 (2013), 186 |
| • Grade 6 | 223 (2013), 195 |
| • Grade 7 | 224 (2013), 214 |
| • Grade 8 | 195 (2013), 205 |
| • Grade 9 | 196 (2013), 249 |
| • Grade 10 | 205 (2013), 221 |
| • Grade 11 | 201 (2013), 204 |
| • Grade 12 | 180 (2013), 205 (2010) |
| • Other | Enrollment projected by the PDE to steadily decline to 2574 by 2020 [9] |
| Language | English |
| Color(s) | Orange and Black |
| Mascot | Bulldog |
| Budget | $40,987,729 (2012–13) |
| Tuition | for nonresident and charter school students ES - $7,830.85, HS - $10,288.32 [12] |
| Per Pupil Spending |
$11,187 (2008) |
| Website | http://www.jsasd.k12.pa.us/5408751110231751/site/default.asp |
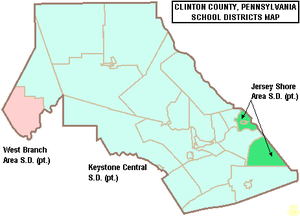
The Jersey Shore Area School District is a large rural, public school district in Lycoming County, Pennsylvania and Clinton County, Pennsylvania. The district encompasses approximately 385 square miles (1,000 km2). It is centered on the borough of Jersey Shore and serves the surrounding Lycoming County municipalities of Limestone Township, Bastress Township, Nippenose Township, Porter Township, Piatt Township, Anthony Township, Mifflin Township, Watson Township, Cummings Township, McHenry Township, Brown Township, and Salladasburg. It also encompasses Avis, Pine Creek Township, and Crawford Township in Clinton County. The District was organized in 1966 by a consolidation of eleven smaller school districts. Per 2000 US Census Bureau data, Jersey Shore Area School District served a resident population of 19,807. According to 2010 state census data, Jersey Shore Area School District served a resident population of 17,858. The educational attainment levels for the Jersey Shore Area School District population (25 years old and over) were 86.8% high school graduates and 13.7% college graduates.[13] The District is one of the 500 public school districts of Pennsylvania.
According to the Pennsylvania Budget and Policy Center, 41.3% of the District’s pupils lived at 185% or below the Federal Poverty Level as shown by their eligibility for the federal free or reduced price school meal programs in 2012.[14] In 2009, the district residents’ per capita income was $16,201, while the median family income was $41,792.[15] In the Commonwealth, the median family income was $49,501 [16] and the United States median family income was $49,445, in 2010.[17] In Lycoming County, the median household income was $45,430.[18] By 2013, the median household income in the United States rose to $52,100.[19] In 2014, the median household income in the USA was $53,700.[20]
The Jersey Shore Area School District provided basic educational services to 2,588 pupils through the employment of 199 teachers, 54 full-time and part-time support personnel, and thirteen (13) administrators during the 2011-12 school year. The District received $19.2 million in state funding in the 2011-12 school year. In school year 2009-10, the District enrollment was 2,686 pupils.The District employed: 212 teachers, 180 full-time and part-time support personnel, and 19 administrators. Jersey Shore Area School District received more than $18.6 million in state funding in school year 2009-10. In the 2007–2008 school year, Jersey Shore Area School District enrollment was 2,805 pupils. The District employed: 213 teachers, 53 full-time and part-time support personnel, and 15 administrators in 2008.
Jersey Shore Area School District operates five schools: Avis Elementary School, Jersey Shore Elementary School, Salladasburg Elementary School, Jersey Shore Area Middle School (6-8), and Jersey Shore Area High School (9-12). The District has a separate administration building. Due to steadily declining enrollment, the Board is grappling with consolidating elementary schools. Nippenose Elementary School was closed in 2013 due to declining enrollment.
The BLaST Intermediate Unit IU17 provides the District with a wide variety of services like specialized education for disabled students and hearing, background checks for employees, state mandated recognizing and reporting child abuse training, speech and visual disability services and criminal background check processing for prospective employees and professional development for staff and faculty.
Governance
Jersey Shore Area School District is governed by 9 individually elected board members (serve four-year terms), the Pennsylvania State Board of Education, the Pennsylvania Department of Education and the Pennsylvania General Assembly.[21] The federal government controls programs it funds like Title I funding for low-income children in the Elementary and Secondary Education Act and the No Child Left Behind Act, which mandates the district focus resources on student success in acquiring reading and math skills. The Superintendent and Business Manager are appointed by the school board. The Superintendent is the chief administrative officer with overall responsibility for all aspects of operations, including education and finance. The Business Manager is responsible for budget and financial operations. Neither of these officials are voting members of the School Board. The School Board enters into individual employment contracts for these positions. In Pennsylvania, public school districts are required to give 150 days notice to the Superintendent and Business Manager regarding renewal of their employment contracts.[22]
The Commonwealth Foundation for Public Policy Alternatives Sunshine Review gave the School Board and District Administration a "D-" for transparency based on a review of "What information can people find on their school district's website". It examined the school district's website for information regarding; taxes, the current budget, meetings, school board members names and terms, contracts, audits, public records information and more.[23]
Academic achievement
Jersey Shore Area School District was ranked 232nd out of 498 Pennsylvania school districts in 2015, by the Pittsburgh Business Times.[24] The ranking was based on student academic performance based on the last three years of student achievement scores on the PSSAs for: reading, writing, math, science and the three Keystone Exams (literature, Algebra 1, Biology I) in high school.[25] The PSSAs are given to all children in grades 3rd through 8th and the 11th grade in high school. Adapted examinations are given to children in the special education programs.
- Overachiever statewide ranking
In 2012, the Pittsburgh Business Times also reported an Overachievers Ranking for 498 Pennsylvania school districts. Jersey Shore Area School District ranked 165th. In 2011, the district was 179th. [32] The editor describes the ranking as: "a ranking answers the question – which school districts do better than expectations based upon economics? This rank takes the Honor Roll rank and adds the percentage of students in the district eligible for free and reduced-price lunch into the formula. A district finishing high on this rank is smashing expectations, and any district above the median point is exceeding expectations."[33]
In 2009, the academic achievement, of the students in the Jersey Shore Area School District, was in the 55th percentile among all 500 Pennsylvania school districts Scale (0-99; 100 is state best) [34]
District Adequate Yearly Progress
In 2012, Jersey Shore Area School District declined to Warning Adequate Yearly Progress (AYP) status due to a lagging graduation rate. In 2011, Jersey Shore Area School District achieved Adequate Yearly Progress (AYP).[35] In 2011, 94 percent of the 500 Pennsylvania public school districts achieved the No Child Left Behind Act progress level of 72% of students reading on grade level and 67% of students demonstrating on grade level math. In 2011, 46.9 percent of Pennsylvania school districts achieved Adequate Yearly Progress (AYP) based on student performance. An additional 37.8 percent of school districts made AYP based on a calculated method called safe harbor, 8.2 percent on the growth model and 0.8 percent on a two-year average performance.[36]
- 2006 to 2010 – achieved AYP each school year
- 2005 - "Making Progress – School Improvement I" [37]
- 2004 – declined to "School Improvement status" The District administration was required by the PDE to develop of district improvement plan to raise student academic achievement in reading and mathematics.
- 2003 – Warning AYP status due to lagging student achievement.[38]
Graduation rate
In 2015, Jersey Shore Area School District’s graduation rate was 83%.[39]
- 2014 – 74.7%[40]
- 2013 – 81%[41]
- 2012 – 77%[42]
- 2011 – 86%[43]
- 2010 – 83% the Pennsylvania Department of Education issued a new, 4-year cohort graduation rate.[44]
- Former formula graduation rate
High school
Jersey Shore Area High School is located at 701 Cemetery Street, Jersey Shore. According to the National Center for Education Statistics, in 2010, the school reported an enrollment of 697 pupils in grades 9th through 12th, with 186 pupils eligible for a federal free or reduced-price lunch. The school employed 71 teachers, yielding a student–teacher ratio of 10:1.[48] According to a report by the Pennsylvania Department of Education, 15 teachers were rated "Non‐Highly Qualified" under No Child Left Behind.[49]
- AYP history;
In 2012, Jersey Shore Area High School was in Warning status. In 2010 and 2011, the High School was in "warning" status due to low student achievement in reading and math coupled with a low graduation rate.[50]
- PSSA results
11th Grade Reading:
- 2012 – 69% on grade level, (14% below basic). State – 67% of 11th graders are on grade level.
- 2011 – 67% (9% below basic). State – 69.1% [51]
- 2010 – 64% (18% below basic). State – 66% [52]
- 2009 – 60% (18% below basic). State – 65% [53]
- 2008 – 64% (21% below basic). State – 65% [54]
- 2007 – 59% (20% below basic). State – 65% [55]
11th Grade Math:
- 2012 – 67%% on grade level (11% below basic). In Pennsylvania, 59% of 11th graders are on grade level.[56]
- 2011 – 66% (11% below basic). State – 60.3% [57]
- 2010 – 57% (24% below basic). State – 59% [58]
- 2009 – 54% (20% below basic). State – 56%.[59]
- 2008 – 59% (22% below basic). State – 56% [60]
- 2007 – 50% (25% below basic). State – 53% [61]
11th Grade Science:
- 2012 – 36% on grade level (11% below basic). State – 42% of 11th graders were on grade level.[62]
- 2011 – 41% (13% below basic). State – 40% [63]
- 2010 – 33% (16% below basic). State – 39%
- 2009 – 31% (19% below basic). State – 40% [64]
- 2008 – 27% (15% below basic). State – 39% [65]
College remediation rate
According to a Pennsylvania Department of Education study released in January 2009, 7% of the Jersey Shore Area High School graduates required remediation in mathematics and or reading before they were prepared to take college level courses in the Pennsylvania State System of Higher Education or community colleges.[66] Less than 66% of Pennsylvania high school graduates, who enroll in a four-year college in Pennsylvania, will earn a bachelor's degree within six years. Among Pennsylvania high school graduates pursuing an associate degree, only one in three graduate in three years.[67] Per the Pennsylvania Department of Education, one in three recent high school graduates who attend Pennsylvania's public universities and community colleges takes at least one remedial course in math, reading or English.
- Dual Enrollment
The high school does not offer the Pennsylvania dual enrollment program which permits students to earn deeply discounted college credits while still enrolled in high school. The program is offered through over 400 school districts with the assistance of a state grant.
SAT scores
In 2012, 115 Jersey Shore Area School District students took the SAT exams. The District's Verbal Average Score was 473. The Math average score was 487. The Writing average score was 464. The statewide Verbal SAT exams results were: Verbal 491, Math 501, Writing 480. In the USA, 1.65 million students took the exams achieving scores: Verbal 496, Math 514, Writing 488. According to the College Board the maximum score on each section was 800, and 360 students nationwide scored a perfect 2,400.
In 2011, 116 Jersey Shore Area students took the SAT exams. The District's Verbal Average Score was 458. The Math average score was 466. The Writing average score was 443.[68] Pennsylvania ranked 40th among states with SAT scores: Verbal – 493, Math – 501, Writing – 479.[69] In the United States, 1.65 million students took the exam in 2011. They averaged 497 (out of 800) verbal, 514 math and 489 in writing.[70]
Graduation requirements
The Jersey Shore Area School Board has determined that a pupil must earn 28.5 credits to graduate, including: Mathematics – 4 credits, English – 4 credits, social studies – 4 credits, science – 4 credits, Computer education – 1 credit, Physical Education – 2 credit, Health 0.5 credits, Family and Consumer Science – 0,5 credits, Technology Education – 0,5 credits, Graduation Project (Senior Project) – 0.5 credits and electives 7.5 credits.[71]
By law, all Pennsylvania secondary school students must complete a project as a part of their eligibility to graduate from high school. The type of project, its rigor and its expectations are set by the individual school district.[72]
By Pennsylvania School Board regulations, for the graduating class of 2017, students must demonstrate successful completion of secondary level course work in Algebra I, Biology, English Composition, and Literature for which the Keystone Exams serve as the final course exams. Students’ Keystone Exam scores shall count for at least one-third of the final course grade.[73][74][75] In 2011, Pennsylvania high school students field tested the Algebra 1, Biology and English Lit exams. The statewide results were: Algebra 1 38% on grade level, Biology 35% on grade level and English Lit – 49% on grade level.[76] Individual student, school or district reports were not made public, although they were reported to district officials by the Pennsylvania Department of Education.
Middle school
Jersey Shore Area Middle School is located at 601 Thompson Street, Jersey Shore. According to the National Center for Education Statistics, in 2010, the school reported an enrollment of 847 pupils in grades 6th through 9th, with 285 pupils receiving a federal free or reduced-price lunch due to family poverty. The school is a federal Title I school. The school employed teachers, yielding a student–teacher ratio of :1.[77] According to a report by the Pennsylvania Department of Education, 14 teachers were rated "Non‐Highly Qualified" under No Child Left Behind.[78] In 2010 and 2011, the Jersey Shore Middle School achieved AYP status.[79]
- PSSA Results
|
8th Grade Reading: |
8th Grade Math:
|
8th Grade Science:
- 2012 – 71% on grade level (12% below basic). State – 59%
- 2011 – 69% (13% below basic). State – 58.3%
- 2010 – 67%, (16% below basic). State – 57%
- 2009 – 56% (21% below basic). State – 55%
- 2008 – 47%, (29% below basic). State – 52%
- 2007 – tested, but results not made public.
|
7th Grade Reading:
|
7th Grade Math:
|
|
6th Grade Reading:
|
6th Grade Math:
|
Elementary schools
Avis Elementary School is located at 1088 Third Street, Jersey Shore. According to the National Center for Education Statistics, in 2010, the school reported an enrollment of 212 pupils in grades kindergarten through 5th, with 106 pupils receiving a federal free or reduced-price lunch due to family poverty. The school employed 14 teachers, yielding a student–teacher ratio of 14:1.[84] According to a report by the Pennsylvania Department of Education, 100% of its teachers were rated "Highly Qualified" under No Child Left Behind.[85] In 2010 and 2011, Avis Elementary School achieved AYP status.[86] In 2011, only 79% of the students were reading on grade level in grades 3rd through 5th. In math, 90% of the students in 3rd through 5th grades were on grade level and 57% scored advanced. In 4th grade science, 86% of the pupils were on grade level.[87] In 2012, 82% of the students were reading on grade level in grades 3rd through 5th. In math, 89% of the students in 3rd through 5th grades were on grade level and 64% scored advanced. In 4th grade science, 98% of the pupils were on grade level.
Jersey Shore Area Elementary School is located at 601 Locust Street, Jersey Shore. According to the National Center for Education Statistics, in 2010, the school reported an enrollment of 496 pupils in grades kindergarten through 6th, with 270 pupils receiving a federal free or reduced-price lunch due to family poverty. This is a Title I school. The school employed 32.75 teachers, yielding a student–teacher ratio of 15:1.[88] According to a report by the Pennsylvania Department of Education, teachers were rated "Highly Qualified" under No Child Left Behind.[89] In 2011, Jersey Shore Area Elementary School achieved AYP status. In 2010 the school was in Warning status due to lagging student achievement[90] In 2011, only 72% of the students were reading on grade level in grades 3rd through 5th. In math, 85% of the students in 3rd through 5th grades were on grade level and 44% scored advanced. In 4th grade science, 89% of the pupils were on grade level.[91] In 2012, only 71% of the students were reading on grade level in grades 3rd through 5th. In math, 86% of the students in 3rd through 5th grades were on grade level and 50% scored advanced. In 4th grade science, 94% of the pupils were on grade level.
Nippenose Valley Elementary School is located at 7190 South Route 44 Highway, Williamsport. According to the National Center for Education Statistics, in 2010, the school reported an enrollment of 251 pupils in grades kindergarten through 5th, with 75 pupils receiving a federal free or reduced-price lunch due to family poverty. The school employed 16 teachers, yielding a student–teacher ratio of 15:1.[92] According to a report by the Pennsylvania Department of Education, 100% of its teachers were rated "Highly Qualified" under No Child Left Behind.[93] In 2010 and 2011, Nippenose Valley Elementary School achieved AYP status.[94] In 2011, 80% of the students were reading on grade level in grades 3rd through 5th. In math, 91% of the students in 3rd through 5th grades were on grade level and 63% scored advanced. In 4th grade science, 95% of the pupils were on grade level.[95] In 2012, 84% of the students were reading on grade level in grades 3rd through 5th. In math, 91% of the students in 3rd through 5th grades were on grade level and 60% scored advanced. In 4th grade science, 93% of the pupils were on grade level.
Salladasburg Elementary School is located at 3490 Route 287 Highway, Jersey Shore. According to the National Center for Education Statistics, in 2010, the school reported an enrollment of 236 pupils in grades kindergarten through 5th, with 97 pupils receiving a federal free or reduced-price lunch due to family poverty. This is a Title I school. The school employed 17 teachers, yielding a student–teacher ratio of 13:1.[96] According to a report by the Pennsylvania Department of Education, 100% of its teachers were rated "Highly Qualified" under No Child Left Behind.[97] In 2010 and 2011, Salladasburg Elementary School achieved AYP status.[98] In 2011, 82% of the students were reading on grade level in grades 3rd through 5th. In math, 89% of the students in 3rd through 5th grades were on grade level and 54% scored advanced. In 4th grade science, 90% of the pupils were on grade level.[99] In 2012, 82% of the students were reading on grade level in grades 3rd through 5th. In math, 89% of the students in 3rd through 5th grades were on grade level and 51% scored advanced. In 4th grade science, 92% of the pupils were on grade level.
Special education
In December 2010, the Jersey Shore Area School District administration reported that 462 pupils or 16.7% of the district's pupils received Special Education services, with 55% of identified students having a specific learning disability. In December 2009, the Jersey Shore Area School District administration reported that 458 pupils or 16.7% of the district's pupils received Special Education services.[100]
In order to comply with state and federal Individuals with Disabilities Education Act rules and regulations, the school district engages in identification procedures to ensure that eligible students receive an appropriate educational program consisting of special education and related services, individualized to meet student needs. At no cost to the parents, these services are provided in compliance with state and federal law; and are reasonably calculated to yield meaningful educational benefit and student progress .[101] To identify students who may be eligible for special education services, various screening activities are conducted on an ongoing basis. These screening activities include: review of group-based data (cumulative records, enrollment records, health records, report cards, ability and achievement test scores); hearing, vision, motor, and speech/language screening; and review by the Special Education administration. When screening results suggest that the student may be eligible, the District seeks parental consent to conduct a multidisciplinary evaluation. Parents who suspect their child is eligible may verbally request a multidisciplinary evaluation from a professional employee of the District or contact the district's Special Education Department.[102][103]
In 2010, the state of Pennsylvania provided $1,026,815,000 for special education services. This funding is in addition to the state's basic education per pupil funding, as well as, all other state and federal funding.[104] The Pennsylvania Special Education funding system assumes that 16% of the district’s students receive special education services. It also assumes that each student’s needs accrue the same level of costs.[105] The state requires each district to have a three-year special education plan to meet the unique needs of its special education students.[106] Overidentification of students, in order to increase state funding, has been an issue in the Commonwealth. Some districts have more than 20% of its students receiving special education services while others have 10% supported through special education.[107]
The Jersey Shore Area School District received a $1,673,157 supplement for special education services in 2010.[108] For the 2011-12 and 2012–13 school year, all Pennsylvania public school districts received the same level of funding for special education that they received in 2010-11. This level funding is provided regardless of changes in the number of pupils who need special education services and regardless of the level of services the respective students required.[109][110]
Gifted education
The District Administration reported that just 12 or 0.42% of its students were gifted in 2009. The highest percentage of gifted students reported among all 500 school districts and 100 public charter schools in Pennsylvania was North Allegheny School District with 15.5% of its students identified as gifted.[111] By law, the district must provide mentally gifted programs at all grade levels. The referral process for a gifted evaluation can be initiated by teachers or parents by contacting the student’s building principal and requesting an evaluation. All requests must be made in writing. To be eligible for mentally gifted programs in Pennsylvania, a student must have a cognitive ability of at least 130 as measured on a standardized ability test by a certified school psychologist. Other factors that indicate giftedness are also considered for eligibility.[112][113]
Wellness policy
School Board established a district wellness policy in 2006.[114] The policy deals with nutritious meals served at school, the control of access to some foods and beverages during school hours, age appropriate nutrition education for all students, and physical education for students K-12. The policy is in response to state mandates and federal legislation (P.L. 108 – 265). The law dictates that each school district participating in a program authorized by the Richard B. Russell National School Lunch Act (42 U.S.C. 1751 et seq) or the Child Nutrition Act of 1966 (42 U.S.C. 1771 et seq) "shall establish a local school wellness policy by School Year 2006." Most districts identified the superintendent and school foodservice director as responsible for ensuring local wellness policy implementation.[115] e
The legislation placed the responsibility of developing a wellness policy at the local level so the individual needs of each district can be addressed. According to the requirements for the Local Wellness Policy, school districts must set goals for nutrition education, physical activity, campus food provision, and other school-based activities designed to promote student wellness. Additionally, districts were required to involve a broad group of individuals in policy development and to have a plan for measuring policy implementation. Districts were offered a choice of levels of implementation for limiting or prohibiting low nutrition foods on the school campus. In final implementation these regulations prohibit some foods and beverages on the school campus.[116] The Pennsylvania Department of Education required the district to submit a copy of the policy for approval.
Budget
In 2011, the average teacher salary in Jersey Shore Area School District was $62,289 a year, while the cost of the benefits teachers receive was $17,238.20 per employee, for a total annual average teacher compensation of $79,527.73.[117] According to a study conducted at the American Enterprise Institute, in 2011, public school teachers’ total compensation is roughly 50 percent higher than they would likely receive in the private sector. The study found that the most generous benefits that teachers receive are not accounted for in many studies of compensation, including: pension, retiree health benefits and job security.[118]
In 2009, the District reported employing 267 teachers and administrators with a median salary of $61,770 and a top salary of $120,376.[119] The teachers work a 7-hour day (30 minute duty-free lunch), with 197 days in the contract year. Additionally, the teachers receive a defined benefit pension, health insurance, professional development reimbursement, 2 paid personal days, 3 paid bereavement days, 10 paid sick days, 1 emergency day and other benefits. The Union receives 10 paid days per year to conduct union business. Teachers receive additional pay for work required to be done beyond the school day or school year.[120]
In 2007, Jersey Shore Area School District employed 226 teachers.[121] In 2007, Pennsylvania public schools had 151,000 plus public school administrators, teachers and staff. As of 2007, Pennsylvania ranked in the top 10 states in average teacher salaries. When adjusted for cost of living Pennsylvania ranked fourth in the nation for teacher compensation.[122]
Jersey Shore Area School District administrative costs per pupil in 2008 was $690.61 per pupil. The lowest administrative cost per pupil in Pennsylvania was $398 per pupil.[123] The Pennsylvania School Boards Association collects and maintains statistics on salaries of public school district employees in Pennsylvania. According to the association's report, the average salary for a superintendent, for the 2007-08 school year, was $122,165. Superintendents and administrators receive a benefit package commensurate with that offered to the district's teachers' union.[124]
In 2008, the District administration reported that per pupil spending was $11,187 which ranked 380th among Pennsylvania's 501 school districts. In 2010, the per pupil spending had increased to $12,897.91 [125] Among the states, Pennsylvania’s total per pupil revenue (including all sources) ranked 11th at $15,023 per student, in 2008-09.[126] In 2007, the Pennsylvania per pupil total expenditures was $12,759.[127] The U.S. Census Bureau reports that Pennsylvania spent $8,191 per pupil in school year 2000-01.[128]
Reserves In 2008, the district reported a balance of $4,262,432 in an unreserved-undesignated fund. The unreserved-designated fund balance was reported as zero. [129] In 2010, Area Administration reported an increase to $3,411,348 in the unreserved-undesignated fund balance and $1,004,198 in its unreserved-designated fund. Pennsylvania school district reserve funds are divided into two categories – designated and undesignated. The undesignated funds are not committed to any planned project. Designated funds and any other funds, such as capital reserves, are allocated to specific projects. School districts are required by state law to keep 5 percent of their annual spending in the undesignated reserve funds to preserve bond ratings. According to the Pennsylvania Department of Education, from 2003 to 2010, as a whole, Pennsylvania school districts amassed nearly $3 billion in reserved funds.[130]
In August 2012, the Pennsylvania Auditor General conducted a performance audit of the District. The findings were reported to the Jersey Shore Area School Board and the District’s administration. This included that two professionals had serious certification deficiencies for several years. The Bureau of School Leadership and Teacher Quality, PDE determined that the JSASD was subject to a subsidy forfeiture of $2,623 for the 2009-10 school year and $3,964 for the 2010-11 school year.[131]
The District is funded by a combination of: a local earned tax – 1.6%,[132] a property tax, a real estate transfer tax 0.5%, coupled with substantial funding from the Commonwealth of Pennsylvania and the federal government.[133] Interest earnings on accounts also provide nontax income to the district. In the Commonwealth of Pennsylvania, pension income and Social Security income are exempted from state personal income tax and local earned income tax, regardless of the level of the individual’s personal wealth.[134]
State basic education funding
For the 2012–13 school year, the district will receive $12,585,301.[135] The Governor's Executive Budget for 2012–2013 includes $9.34 billion for kindergarten through 12th grade public education, including $5.4 billion in basic education funding, which is an increase of $49 million over the 2011-12 budget. The state also provides $100 million for the Accountability Block grant. The state will also provide $544.4 million for School Employees’ Social Security and $856 million for School Employees’ Retirement fund called PSERS.[136] This amount is a $21,823,000 increase (0.34%) over the 2011–2012 appropriations for Basic Education Funding, School Employees' Social Security, Pupil Transportation, Nonpublic and Charter School Pupil Transportation. Since taking office, Corbett’s first two budgets have restored more than $918 million in support of public schools, compensating for the $1 billion in federal stimulus dollars lost at the end of the 2010-11 school year.
In 2011-12, the district received a $12,378,942 allocation, of state Basic Education Funding.[137][138] Additionally, the School District received $206,359 in Accountability Block Grant funding. The enacted Pennsylvania state Education budget included $5,354,629,000 for the 2011–2012 Basic Education Funding appropriation. This amount was a $233,290,000 increase (4.6%) over the enacted State appropriation for 2010–2011.[139] The highest increase in state basic education funding was awarded to Duquesne City School District, which got a 49% increase in state funding for 2011-12.[140] In 2010, the district reported that 1,063 students received free or reduced-price lunches, due to the family meeting the federal poverty level.[141]
In the 2010–2011 budget year, the Commonwealth of Pennsylvania provided Jersey Shore Area School District a 2.63% increase in Basic Education Funding for a total of $13,227,985. Among the districts in Lycoming County, the highest increase went to Loyalsock Township School District which got an 8.13% increase. One hundred fifty Pennsylvania school districts received the base 2% increase. The highest increase in 2010-11 went to Kennett Consolidated School District in Chester County which received a 23.65% increase in state funding.[142] The state's hold harmless policy regarding state basic education funding continued where each district received at least the same amount as it received the prior school year, even where enrollment had significantly declined. The amount of increase each school district received was set by Governor Edward Rendell and then Secretary of Education Gerald Zahorchak, as a part of the state budget proposal given each February. This was the second year of Governor Rendell’s policy to fund some districts at a far greater rate than others.
In the 2009–2010 budget year, the Commonwealth of Pennsylvania provided a 4.12% increase in Basic Education Funding for a total of $12,889,563. Among the districts in Lycoming County, the highest increase went to Loyalsock Township School District which got a 5.94%. The state Basic Education Funding to the district in 2008-09 was $12,378,939.74. Ninety Pennsylvania public school districts received a 2% increase. Muhlenberg School District in Berks County received the highest, a 22.31% increase in state basic education funding in 2009.[143] The amount of increase each school district received was set by Governor Edward G. Rendell and the Secretary of Education Gerald Zahorchak, as a part of the state budget proposal.[144] According to the U.S. Census Bureau, Pennsylvania spent $7,824 Per Pupil in the year 2000. This amount increased up to $12,085 by the year 2008.[145][146]
Accountability Block Grants
Beginning in 2004–2005, the state launched the Accountability Block Grant school funding. This program has provided $1.5 billion to Pennsylvania’s school districts. The Accountability Block Grant program requires that its taxpayer dollars are focused on specific interventions that are most likely to increase student academic achievement. These interventions include: teacher training, all-day kindergarten, lower class size K-3rd grade, literacy and math coaching programs that provide teachers with individualized job-embedded professional development to improve their instruction, before or after school tutoring assistance to struggling students. For 2010-11, Jersey Shore Area School District applied for and received $560,111 in addition to all other state and federal funding. The district uses the funding to provide full-day kindergarten.[147][148]
Classrooms for the Future grant
The Classroom for the Future state program provided districts with hundreds of thousands of extra state funding to buy laptop computers for each core curriculum high school class (English, Science, History, Math) and paid for teacher training to optimize the computers use. The program was funded from 2006 to 2009. The Jersey Shore Area School District received $83,023 in 2006-07. In 2007-08 it received $300,000. The district received $45,413 in 2008-09. The total funding was $428,436 which was the largest amount given to a Lycoming County public school district.[149] The highest funding statewide was awarded to Philadelphia City School District in Philadelphia County - $9,409,073. In 2010, Classrooms for the Future funding was curtailed statewide due to a massive state financial crisis.
Literacy grant
Jersey Shore Area School District did not participate in the 2012 literacy grant. The funding was to be used to improve reading skills birth through 12th grade. The district was required to develop a lengthy literacy plan, which included outreach into the community. The funds come from a Striving Readers Comprehensive Literacy grant, also referred to as the Keystones to Opportunity grant It is a five-year, competitive federal grant program designed to assist local education agencies in developing and implementing local comprehensive literacy plans. Of the 329 pre-applications by school districts reviewed by the Pennsylvania Department of Education, Williamsport Area School District was one of only 148 entities that were invited to submit a full application. In Lycoming County just 1 school district was awarded the first year of funding.[150] The funds must be used for teacher training, student screening and assessment, targeted interventions for students reading below grade level and research-based methods of improving classroom instruction and practice. Districts must hire literacy coaches. The coaches work with classroom teachers to enhance their literacy teaching skills. Pennsylvania was among six other states, out of the 35 that applied, to be awarded funding. Pennsylvania received $38 million through the federal program. The Department of Education reserved 5% of the grant for administration costs at the state level.
Federal Stimulus grant
The District received an extra $4,202,089 in ARRA – Federal Stimulus money to be used in specific programs like special education and meeting the academic needs of low-income students.[151][152] The funding was limited to the 2009-10 and 2010–2011 school years.[153] Due to the temporary nature of the funding, schools were repeatedly advised to use the funds for one-time expenditures like acquiring equipment, making repairs to buildings, training teachers to provide more effective instruction or purchasing books and software.
Race to the Top grant
Jersey Shore Area School District officials did not apply for the federal Race to the Top grant which would have provided over one million dollars in additional federal funding to improve student academic achievement.[154] Participation required the administration, the school board and the local teachers' union to sign an agreement to prioritize improving student academic success. In Pennsylvania, 120 public school districts and 56 charter schools agreed to participate.[155] Pennsylvania was not approved for the grant. The failure of districts to agree to participate was cited as one reason that Pennsylvania was not approved.[156][157][158]
Real estate taxes
Property tax rates in 2012–13 were set by the school board at 11.0289 mills in Clinton County and 15.59.57mills in Lycoming County. A mill is $1 of tax for every $1,000 of a property's assessed value. Irregular property reassessments have become a serious issue in the commonwealth as it creates a significant disparity in taxation within a community and across a region.[159] Property taxes, in the Commonwealth of Pennsylvania, apply only to real estate – land and buildings. The property tax is not levied on cars, business inventory, or other personal property. Certain types of property are exempt from property taxes, including: places of worship, places of burial, private social clubs, charitable and educational institutions and government property. Additionally, service related, disabled US military veterans may seek an exemption from paying property taxes. Pennsylvania school district revenues are dominated by two main sources: 1) Property tax collections, which account for the vast majority (between 75-85%) of local revenues; and 2) Act 511 tax collections, which are around 15% of revenues for school districts.[160] When a school district includes municipalities in two counties, each of which has different rates of property tax assessment, a state board equalizes the tax rates between the counties.[161] In 2010, miscalculations by the State Tax Equalization Board (STEB) were widespread in the Commonwealth and adversely impacted funding for many school districts, including those that did not cross county borders.[162]
- 2011-12 – 11.0796 mills in Clinton County and 15.2658 mills in Lycoming County [163]
- 2010-11 – 10.8949 mills in Clinton County and 15.1330 mills in Lycoming County [164]
- 2009-10 – 11.0330 mills in Clinton County and 14.3530 mills in Lycoming County [165]
- 2008-09 – 51.9140 mills in Clinton County and 14.0220 mills in Lycoming County [166]
- 2007-08 – 56.5810 mills in Clinton County and 13.7240 mills in Lycoming County.[167]
- 2006-07 – 53.8050 mills in Clinton County and 13.2240 mills in Lycoming County.[168]
- 2005-06 – 52.8070 mills in Clinton County and 13.2240 mills in Lycoming County.[169]
According to a report prepared by the Pennsylvania Department of Education, the total real estate taxes collected by all school districts in Pennsylvania rose from $6,474,133,936 in 1999-00 to $10,438,463,356 in 2008-09 and to $11,153,412,490 in 2011.[170] The average yearly property tax paid by Lycoming County residents amounts to about 3.53% of their yearly income. Lycoming County is ranked 364th of the 3143 United States counties for property taxes as a percentage of median income.[171]
Act 1 Adjusted Index
The Act 1 of 2006 Index regulates the rates at which each school district can raise property taxes in Pennsylvania. Districts are not permitted to raise property taxes above that Index unless they either: allow voters to vote by referendum or they seek an exception from the state Department of Education. The base index for the 2011–2012 school year is 1.4 percent, but the Act 1 Index can be adjusted higher, depending on a number of factors, such as property values and the personal income of district residents. Act 1 included 10 exceptions, including: increasing pension costs, increases in special education costs, a catastrophe like a fire or flood, increase in health insurance costs for contracts in effect in 2006 or dwindling tax bases. The base index is the average of the percentage increase in the statewide average weekly wage, as determined by the PA Department of Labor and Industry, for the preceding calendar year and the percentage increase in the Employment Cost Index for Elementary and Secondary Schools, as determined by the Bureau of Labor Statistics in the U.S. Department of Labor, for the previous 12-month period ending June 30. For a school district with a market value/personal income aid ratio (MV/PI AR) greater than 0.4000, its index equals the base index multiplied by the sum of .75 and its MV/PI AR for the current year.[172] In June 2011, the Pennsylvania General Assembly eliminated six of the ten exceptions to the Act 1 Index.[173] Several exceptions were maintained: 1) costs to pay interest and principal on indebtedness incurred prior to September 4, 2004 for Act 72 schools and prior to June 27, 2006 for non-Act 72 schools; 2) costs to pay interest and principal on electoral debt; 3) costs incurred in providing special education programs and services (beyond what is already paid by the State); and 4) costs due to increases of more than the Index in the school’s share of payments to PSERS (PA school employees pension fund) taking into account the state mandated PSERS contribution rate.[174][175]
The School District Adjusted Index for the Jersey Shore Area School District 2006–2007 through 2011–2012.[176]
- 2006-07 – 5.6%, Base 3.9%
- 2007-08 – 4.9%, Base 3.4%
- 2008-09 – 6.3%, Base 4.4%
- 2009-10 – 5.9%, Base 4.1%
- 2010-11 – 4.2%, Base 2.9%
- 2011-12 – 2.0%, Base 1.4%
- 2012-13 – 2.4%, Base 1.7% [177]
For the 2012–13 budget year, Jersey Shore Area School Board did not apply for exceptions to exceed the Act 1 Index. For 2012–2013, 274 school districts adopted a resolution certifying that tax rates would not be increased above their index; 223 school districts adopted a preliminary budget leaving open the option of exceeded the Index limit. For the exception for pension costs, 194 school districts received approval to exceed the Index. For special education costs, 129 districts received approval to exceed the tax limit. For the exception for pension costs, 194 school districts received approval to exceed the Index. For special education costs, 129 districts received approval to exceed the tax limit.[178]
For the 2011-12 school year, the Jersey Shore Area School Board applied for an exception to exceed the Act 1 Index due to special education costs. Each year, the Jersey Shore Area School Board has the option of adopting either 1) a resolution in January certifying they will not increase taxes above their index or 2) a preliminary budget in February. A school district adopting the resolution may not apply for referendum exceptions or ask voters for a tax increase above the inflation index. A specific timeline for these decisions is published annually, by the Pennsylvania Department of Education.[179]
According to a state report, for the 2011–2012 school year budgets, 247 school districts adopted a resolution certifying that tax rates would not be increased above their index; 250 school districts adopted a preliminary budget. Of the 250 school districts that adopted a preliminary budget, 231 adopted real estate tax rates that exceeded their index. Tax rate increases in the other 19 school districts that adopted a preliminary budget did not exceed the school district’s index. Of the districts who sought exceptions: 221 used the pension costs exemption and 171 sought a Special Education costs exemption. Only 1 school district sought an exemption for Nonacademic School Construction Project, while 1 sought an exception for Electoral debt for school construction.[180]
The Jersey Shore Area School Board did not apply for any exceptions to exceed the Act 1 index for the budget in 2011.[181] For 2009-10 school budget, the board did not apply for exceptions to exceed the Index.[182] In the Spring of 2010, 135 Pennsylvania school boards asked to exceed their adjusted index. Approval was granted to 133 of them and 128 sought an exception for pension costs increases.[183]
Property tax relief
In 2012, Jersey Shore Area School District approved homestead residents received $238 for 4,796 approved homesteads.[184] In 2010, property tax relief for 4,819 approved residents of Jersey Shore Area School District was set at $237.[185] In Lycoming County, the highest tax relief went to Williamsport Area School District which was set at $303.[186] The highest property tax relief, among Pennsylvania school districts, went to the homesteads of Chester Upland School District of Delaware County which received $632 per approved homestead in 2010. Chester-Upland School District has consistently been the top recipient since the programs inception.[187] The relief was subtracted from the total annual school property tax bill. Property owners apply for the relief through the county Treasurer's office. Farmers can qualify for a farmstead exemption on building used for agricultural purposes. The farm must be at least 10 contiguous acres (40,000 m2) and must be the primary residence of the owner. Farmers can qualify for both the homestead exemption and the farmstead exemption. In Lycoming County, 69% of eligible property owners applied for property tax relief in 2009.[188]
Additionally, the Pennsylvania Property Tax/Rent Rebate program is provided for low income Pennsylvanians aged 65 and older; widows and widowers aged 50 and older; and people with disabilities age 18 and older. The income limit is $35,000 for homeowners. The maximum rebate for both homeowners and renters is $650. Applicants can exclude one-half (1/2) of their Social Security income, consequently people who have an income of substantially more than $35,000 may still qualify for a rebate. Individuals must apply annually for the rebate. This tax rebate can be taken in addition to Homestead/Farmstead Property Tax Relief. In 2012, Pennsylvania Secretary of the Treasury reported issuing more than half a million property tax rebates totaling $238 million.[189] The program is funded by the Pennsylvania Lottery. Property tax rebates are increased by an additional 50 percent for senior households in the state, so long as those households have incomes under $30,000 and pay more than 15% of their income in property taxes.[190]
Property taxes in Pennsylvania are relatively high on a national scale. According to the Tax Foundation, Pennsylvania ranked 11th in the U.S. in 2008 in terms of property taxes paid as a percentage of home value (1.34%) and 12th in the country in terms of property taxes as a percentage of income (3.55%).[191]
Extracurriculars
The district offers a wide variety of clubs, activities and sports. Eligibility for participation is determined by school board policy.
By Pennsylvania law, all K-12 students residing in the district, including those who attend a private nonpublic school, cyber charter school, charter school and those homeschooled, are eligible to participate in the extracurricular programs, including all athletics. They must meet the same eligibility rules as the students enrolled in the district's schools.[192]
Sports
The District funds:
|
|
- Junior high school sports
|
|
- According to PIAA directory July 2012 [193]
References
- ↑ Pennsylvania Department of Education (2015). "ED Names and Addresses".
- ↑ Sarah Desantis (September 29, 2015). "Superintendent retiring in Jersey Shore Area". Williamsport Sun-Gazette.
- ↑ Tribune Live.com (2015). "PA Teacher Salaries Database".
- ↑ National Center for Education Statistics, Common Core of Data – Jersey SHore Area SD, 2015
- ↑ {{cite web url=http://www.paschoolperformance.org/Profile/218 |title=Jersey Shore Area School District Fast Facts 2015 |author=Pennsylvania Department of Education |year=2015}}
- ↑ Pennsylvania Department of Education, Jersey Shore Area SD – District Fast Facts 2013, 2013
- ↑ Pennsylvania Department of Education (January 2009). "Jersey Shore Area School District Enrollment and Projections".
- ↑ Pennsylvania Department of Education, Enrollment And Projections Jersey Shore Area SD, 2010
- ↑ Pennsylvania Department of Education (July 2011). "Enrollment and Projections by school district".
- ↑ Adrienne Craig (June 29, 2015). "Jersey Shore Area School District Budget report 2015–16" (PDF).
- ↑ Adrienne Craig (June 24, 2014). "Jersey Shore Area School District Budget report 2014–15" (PDF).
- ↑ Pennsylvania Department of Education, Pennsylvania Public School District Tuition Rates, May 2012
- ↑ proximityone (2014). "School District Comparative Analysis Profiles".
- ↑ Pennsylvania Budget and Policy Center, Education Facts Student Poverty Concentration by LEA, 2012
- ↑ US Census Bureau, American Fact Finder, 2009
- ↑ US Census Bureau (2010). "American Fact Finder, State and County quick facts".
- ↑ US Census Bureau (September 2011). "Income, Poverty, and Health Insurance Coverage in the United States: 2010" (PDF).
- ↑ US Census Bureau (2014). "Pennsylvania Median household income, 2006–2010 by County".
- ↑ Michael Sauter; Alexander E.M. Hess (August 31, 2013). "America's most popular six-figure jobs". USA Today.
- ↑ Jeff Guo (September 15, 2015). "Lower wages for whites, higher wages for immigrants, and inequality for all". Washington Post.
- ↑ Pennsylvania Public School Code Governance 2010
- ↑ Pennsylvania General Assembly, Pennsylvania School Code, 2013
- ↑ The Commonwealth Foundation for Public Policy Alternatives. "The Pennsylvania Project". Retrieved May 20, 2010.
- ↑ Pittsburgh Business Times (April 10, 2015). "Guide to Pennsylvania Schools Statewide School District Ranking 2015".
- ↑ "Statewide Honor Roll Rankings 2012". Pittsburgh Business Times. April 5, 2012.
- ↑ Pittsburgh Business Times (April 11, 2014). "Western Pennsylvania School Guide 2014".
- ↑ "Statewide Honor Roll Rankings 2013". Pittsburgh Business Times. April 5, 2013.
- ↑ "Statewide Honor Roll Rankings 2012". Pittsburgh Business Times. April 5, 2012.
- ↑ "Statewide Honor Roll Rankings 2011". Pittsburgh Business Times. April 2011.
- ↑ Pittsburgh Business Times (May 1, 2010). "Statewide Honor Roll.".
- ↑ "Three of top school districts in state hail from Allegheny County,". Pittsburgh Business Times,. May 23, 2007.
- ↑ Pittsburgh Business Times, Statewide Overachivers Ranking Information, April 6, 2012
- ↑ "Overachiever statewide ranking". Pittsburgh Business Times. May 6, 2010.
- ↑ "2009 PSSA RESULTS Jersey Shore Area School District,". The Morning Call. Retrieved March 2011. Check date values in:
|access-date=(help) - ↑ Pennsylvania Department of Education (September 29, 2011). "Jersey Shore Area School District AYP Overview 2011".
- ↑ Pennsylvania Department of Education, Pennsylvania Public School District AYP History, 2011
- ↑ Pennsylvania Department of Education, Jersey Shore Area School District AYP 2005, 2005
- ↑ Pennsylvania Department of Education, Pennsylvania District AYP History 2003–2010, 2011
- ↑ PDE, Graduation rate by LEA, 2015
- ↑ PDE, Graduation rate by LEA, 2014
- ↑ PDE, Graduation rate by LEA, 2013
- ↑ Pennsylvania Department of Education, Jersey Shore Area School District AYP data table, September 21, 2012
- ↑ Pennsylvania Department of Education (September 29, 2011). "Jersey Shore Area School District AYP Data Table 2011".
- ↑ Pennsylvania Department of Education (March 15, 2011). "New 4-year Cohort Graduation Rate Calculation Now Being Implemented".
- ↑ "Jersey Shore Area School District Academic Achievement Report Card 2010 data table". Retrieved March 19, 2011.
- ↑ The Times-Tribune (June 25, 2009). "Lycoming County Graduation Rates 2008".
- ↑ Pennsylvania Partnerships for Children (2008). "High School Graduation rate 2007" (PDF).
- ↑ National Center for Education Statistics, Common Care Data – Jersey Shore Area High School, 2010
- ↑ Pennsylvania Department of Education, Professional Qualifications of Teachers High School, September 29, 2011
- ↑ Pennsylvania Department of Education (September 29, 2011). "Jersey Shore Area High School AYP Report 2011".
- ↑ Pennsylvania Department of Education (September 29, 2011). "2010-2011 PSSA and AYP Results".
- ↑ Pennsylvania Department of Education (2010). "2009-2010 PSSA and AYP Results".
- ↑ The Times-Tribune (September 14, 2009). "Grading Our Schools database, 2009 PSSA results".
- ↑ Pennsylvania Department of Education (August 15, 2008). "2007-2008 PSSA and AYP Results".
- ↑ Pennsylvania Department of Education (2007). "PSSA Math and Reading results".
- ↑ Pittsburgh Post Gazette (October 15, 2012). "How is your school doing?".
- ↑ Pennsylvania Department of Education (September 29, 2011). "Jersey Shore Area High School Academic Achievement Report Card 2011" (PDF).
- ↑ Pennsylvania Department of Education, Jersey Shore Area High School Academic Achievement Report Card 2010, October 20, 2010
- ↑ Pennsylvania Department of Education, Jersey Shore Area High School Academic Achievement Report Card 2009, September 14, 2009
- ↑ Pennsylvania Department of Education, Jersey Shore Area High School Academic Achievement Report Card 2008, August 15, 2008
- ↑ Pennsylvania Department of Education, Jersey Shore Area High School Academic Achievement Report Card, 2007
- ↑ Pennsylvania Department of Education (September 21, 2012). "Jersey Shore Area High School Academic Achievement Report Card 2012" (PDF).
- ↑ Pennsylvania Department of Education (September 29, 2011). "2010-2011 PSSA results in Science".
- ↑ The Times-Tribune (2009). "Grading Our Schools database, 2009 Science PSSA results".
- ↑ Pennsylvania Department of Education (2008). "Report on PSSA Science results by school and grade 2008".
- ↑ Pennsylvania Department of Education (January 20, 2009). "Pennsylvania College Remediation Report,".
- ↑ National Center for Education Statistics, IPEDS Integrated Postsecondary Education Data System, 2008
- ↑ Pennsylvania Department of Education (2011). "Public School SAT Scores 2011".
- ↑ College Board (September 2011). "SAT Scores State By State – Pennsylvania".
- ↑ "While U.S. SAT scores dip across the board, N.J. test-takers hold steady". September 2011.
- ↑ Jersey Shore Area School Board, Jersey Shore Area High School Handbook, 2011-12
- ↑ Pennsylvania State Board of Education. "Pennsylvania Code § 4.24 (a) High school graduation requirements".
- ↑ Pennsylvania Department of Education (2010). "Keystone Exam Overview" (PDF).
- ↑ Pennsylvania Department of Education (September 2011). "Pennsylvania Keystone Exams Overview".
- ↑ Pennsylvania State Board of Education (2010). "Rules and Regulation Title 22 PA School Code CH. 4".
- ↑ Pennsylvania Department of Education (2011). "Keystone Exams".
- ↑ National Center for Education Statistics, Common Care Data – Middle School, 2010
- ↑ Pennsylvania Department of Education, Professional Qualifications of Teachers Middle School, September 29, 2011
- ↑ Pennsylvania Department of Education (September 29, 2011). "Jersey Shore Area Middle School AYP Overview 2011".
- ↑ Pennsylvania Department of Education, Jersey Shore Middle School Academic Report Card 2011, September 29, 2011
- ↑ Pennsylvania Department of Education, Jersey Shore Middle School Academic Report Card 2009, September 14, 2009
- ↑ Pennsylvania Department of Education, Jersey Shore Middle School Academic Report Card 2008, August 15, 2008
- ↑ Pennsylvania Department of Education, Jersey Shore Middle School Academic Report Card 2007, 2007
- ↑ National Center for Education Statistics, Common Care Data – Avis Elementary School, 2010
- ↑ Pennsylvania Department of Education, Professional Qualifications of Teachers Avis Elementary School, September 29, 2011
- ↑ Pennsylvania Department of Education, Avis Elementary School AYP Overview, September 29, 2011
- ↑ Pennsylvania Department of Education (September 29, 2011). "Avis Elementary School Report Card 2011" (PDF).
- ↑ National Center for Education Statistics, Common Care Data – Jersey Shore Area Elementary School, 2010
- ↑ Pennsylvania Department of Education, Professional Qualifications of Teachers Jersey Shore Area Elementary School, September 29, 2011
- ↑ Pennsylvania Department of Education, Jersey Shore Area Elementary School AYP Overview 2011, September 29, 2011
- ↑ Pennsylvania Department of Education (September 29, 2011). "Jersey Shore Area Elementary School Report Card 2011" (PDF).
- ↑ National Center for Education Statistics, Common Care Data – Nippenose Valley Elementary School, 2010
- ↑ Pennsylvania Department of Education, Professional Qualifications of Teachers Nippenose Valley Elementary School, September 29, 2011
- ↑ Pennsylvania Department of Education, Nippenose Valley Elementary School AYP Overview, September 29, 2011
- ↑ Pennsylvania Department of Education (September 29, 2011). "Nippenose Valley Elementary School Report Card 2011" (PDF).
- ↑ National Center for Education Statistics, Common Care Data – Salladasburg Elementary School, 2010
- ↑ Pennsylvania Department of Education, Professional Qualifications of Teachers Salladasburg Elementary School, September 29, 2011
- ↑ Pennsylvania Department of Education, Salladasburg Elementary School AYP Overview, September 29, 2011
- ↑ Pennsylvania Department of Education (September 29, 2011). "Salladasburg Elementary School Report Card 2011" (PDF).
- ↑ Pennsylvania Bureau of Special Education Services (2009–2010). "Area School District Special Education Data Report LEA Performance on State Performance Plan (SPP) Targets".
- ↑ Pennsylvania Bureau of Special Education (2008). "Pennsylvania Parent Guide to Special Education Services".
- ↑ Pennsylvania Department of Education – Jersey Shore Area School District Administration (January 6, 2011). "Procedural Safeguards Notice".
- ↑ Pennsylvania Department of Education, Bureau of Special Education (September 2005). "Gaskin Settlement Agreement Overview Facts Sheet" (PDF).
- ↑ Pennsylvania Department of Education. "Pennsylvania Special Education Funding".
- ↑ Senator Patrick Browne (November 1, 2011). "Senate Education Committee Holds Hearing on Special Education Funding & Accountability".
- ↑ Pennsylvania Department of Education Amy Morton, Executive Deputy Secretary (November 11, 2011). "Public Hearing: Special Education Funding & Accountability Testimony".
- ↑ Baruch Kintisch Education Law Center (November 11, 2011). "Public Hearing: Special Education Funding & Accountability Testimony" (PDF).
- ↑ Pennsylvania Department of Education (July 2010). "Special Education Funding from Pennsylvania State_2010-2011".
- ↑ Pennsylvania Department of Education (2011). "Special Education Funding 2011–2012 Fiscal Year".
- ↑ Pennsylvania Department of Education, Investing in PA kids, April 2012
- ↑ Pennsylvania Department of Education (Revised December 1, 2009 Child Count (Collected July 2010)). "Gifted Students as Percentage of Total Enrollment by School District/Charter School" (PDF). Check date values in:
|date=(help) - ↑ Pennsylvania Department of Education and Pennsylvania School Board. "CHAPTER 16. Special Education For Gifted Students". Retrieved February 4, 2011.
- ↑ Pennsylvania Department of Education (March 26, 2010). "Special Education for Gifted Students Notice of Parental rights" (PDF).
- ↑ Jersey Shore Area School Board Policy Manual, Student Wellness Policy 246, December 6, 2010
- ↑ Probart C, McDonnell E, Weirich JE, Schilling L, Fekete V (September 2008). "Statewide assessment of local wellness policies in Pennsylvania public school districts.". J Am Diet Assoc. 108 (9): 1497–502. doi:10.1016/j.jada.2008.06.429. PMID 18755322.
- ↑ Pennsylvania Department of Education – Division of Food and Nutrition. (July 2008). "Nutrition Standards for Competitive Foods in Pennsylvania Schools for the School Nutrition Incentive".
- ↑ Pennsylvania Department of Education (2012). "Investing in Pennsylvania Students".
- ↑ American Enterprise Institute, (2011). "Assessing the Compensation of Public School Teachers".
- ↑ Asbury Park Press (2009). "PA. Public School Salaries".
- ↑ Jersey Shore Area School Board (2006). "Jersey Shore Area School District Teacher Union Employment Contract 2011".
- ↑ The Times Tribune (2008). "Jersey Shore Area School District payroll report".
- ↑ PA Delaware County Times, Teachers need to know enough is enough, April 20, 2010.
- ↑ Fenton, Jacob.., Pennsylvania School District Data: Will School Consolidation Save Money?, The Morning Call, February 2009
- ↑ Pennsylvania School Board Association (October 2009). "Public School Salaries 11th Annual".
- ↑ Pennsylvania Department of Education (2010). "2009-10 Selected Data – 2009-10 Total Expenditures per ADM".
- ↑ United States Census Bureau (2009). "States Ranked According to Per Pupil Elementary-Secondary Public School System Finance Amounts: 2008-09" (PDF).
- ↑ US Census Bureau (2009). "Total and current expenditures per pupil in fall enrollment in public elementary and secondary education, by function and state or jurisdiction: 2006-07".
- ↑ US Census Bureau (March 2003). "Public Education Finances 2000-01 Annual Survey of Local Government Finances" (PDF).
- ↑ Pennsylvania Department of Education. "Fund Balances by Local Education Agency 1997 to 2008".
- ↑ Murphy, Jan., Pennsylvania's public schools boost reserves, CentreDaily Times, September 22, 2010
- ↑ Pennsylvania Auditor General (August 2012). "Jersey Shore Area School District Lycoming County, Pennsylvania Performance Audit Report".
- ↑ Municipal and School District Tax Office, Income tax reporting form instructions, 2012
- ↑ Penn State Cooperative Extension (2010). "What are the Local Taxes in Pennsylvania?, Local Tax Reform Education Project,".
- ↑ Pennsylvania Department of Revenue (April 2010). "Personal Income Taxation Guidelines".
- ↑ Senator Jake Corman (June 28, 2012). "Pennsylvania Education funding by Local School District" (PDF).
- ↑ Pennsylvania General Assembly Sen Jake Corman (June 29, 2012). "SB1466 of 2012 General Fund Appropriation".
- ↑ PA Senate Appropriations Committee (June 28, 2011). "School District 2011-12 Funding Report".
- ↑ Pennsylvania Department of Education (July 2011). "Basic Education Funding".
- ↑ Pennsylvania Department of Education (June 30, 2011). "Basic Education Funding".
- ↑ Pennsylvania Department of Education (June 30, 2011). "Basic Education Funding 2011–2012 Fiscal Year".
- ↑ Pennsylvania Department of Education, District Allocations Report 2009, 2009-10
- ↑ Pennsylvania House Appropriations Committee Education Budget information (June 30, 2010). "PA Basic Education Funding-Printout2 2010–2011" (PDF).
- ↑ Pennsylvania Department of Education (October 2009). "Funding Allocations by district".
- ↑ Pennsylvania Office of Budget (February 2009). "Governor's Budget Proposal 2009 Pennsylvania Department of Education Budget Proposal 2009".
- ↑ U.S. Census Bureau., Annual Survey of Local Government Finances., 2000
- ↑ U.S. Census Bureau., 2008 Survey of Local Government Finances – School Systems, 2010
- ↑ Pennsylvania Department of Education (2010). "Accountability Block Grant report Grantee list 2010".
- ↑ Pennsylvania Department of Education (2008). "Accountability Block Grant Mid Year report".
- ↑ Pennsylvania Auditor General (December 22, 2008). "Classrooms for the Future grants audit" (PDF).
- ↑ Pennsylvania Department of Education (May 23, 2012). "Pennsylvania Awards $36.1 Million to Strengthen Literacy Programs".
- ↑ Commonwealth of Pennsylvania (2009). "County ARRA FUNDING Report".
- ↑ ProPublica (2009). "Recovery Tracker Eye on the stimulus".
- ↑ "School stimulus money". Pittsburgh Post-Gazette. March 12, 2009.
- ↑ Pennsylvania Department of Education (December 9, 2009). "Race To The Top Webinar powerpoint for districts December 2009" (PDF).
- ↑ Governor's Press Office release (January 20, 2010). "Pennsylvania's 'Race to the Top' Fueled by Effective Reforms, Strong Local Support,".
- ↑ Race to the Top Fund, U.S. Department of Education, March 29, 2010.
- ↑ Gerald Zahorchak (December 2008). "Pennsylvania Race to the Top Letter to Superintendents" (PDF).
- ↑ Pennsylvania Department of Education (January 19, 2009). "Pennsylvania Race to the Top – School Districts Title I Allocations 2009-10".
- ↑ Pennsylvania Department of Education (2011). "Real Estate Tax Rates by School District 2011-12 Real Estate Mills".
- ↑ Pennsylvania Department of Education (2004). "Act 511 Tax Report".
- ↑ State Tax Equalization Board (2011). "State Tax Equalization Board About US".
- ↑ Pennsylvania Auditor General office – Bureau of Audits (February 2011). "A Special Performance Audit of the Pennsylvania State Tax Equalization Boards" (PDF).
- ↑ Pennsylvania Department of Education (2011). "Real Estate Tax Millage by School District,".
- ↑ Pennsylvania Department of Education (2010). "Real Estate Tax Millage by School District,".
- ↑ Pennsylvania Department of Education (2010). "Financial Elements Reports".
- ↑ Pennsylvania Department of Education (2009). "Financial Elements Reports 2008-09 Real Estate Mills".
- ↑ Pennsylvania Department of Education (2008). "Real Estate Tax Millage by School District,".
- ↑ Pennsylvania Department of Education (2006). "Real Estate Tax Millage by School District,".
- ↑ Pennsylvania Department of Education (2005). "Real Estate Tax Millage by School District,".
- ↑ Pennsylvania Department of Education, Pennsylvania School Finances – Summaries of Annual Financial Report Data 2010-11, 2011
- ↑ Tax-rates.org., Lycoming County Property Taxes 2012, 2012
- ↑ Pennsylvania Department of Education (2010). "2010-11 Act 1 of 2006 Referendum Exception Guidelines".
- ↑ Kaitlynn Riely (August 4, 2011). "Law could restrict school construction projects". Pittsburgh Post-Gazette.
- ↑ Pennsylvania General Assembly (June 29, 2011). "SB330 of 2011".
- ↑ Eric Boehm (July 1, 2011). "Property tax reform final piece of state budget". PA Independent.
- ↑ Pennsylvania Department of Education (May 2010). "Special Session Act 1 of 2006 School District Adjusted Index for 2006–2007 through 2010–2011".
- ↑ Pennsylvania Department of Education, 2012–2013 School District Adjusted Index, May 2012
- ↑ Pennsylvania Department of Education, Report on Referendum Exceptions For School Year 2012–2013, March 30, 2012
- ↑ Pennsylvania Department of Education (2011). "Special Session Act 1 of 2006 the Taxpayer Relief Act information".
- ↑ Pennsylvania Department of Education (April 2011). "Report on Exceptions".
- ↑ Pennsylvania Department of Education (May 2010). "Report on Referendum Exceptions for 2010–2011".
- ↑ Pennsylvania Department of Education (May 2009). "Report on Referendum Exceptions for 2009–2010".
- ↑ Scarcella, Frank; Pursell, Tricia (May 25, 2010). "Local school tax assessments exceed state averages". The Daily Item.
- ↑ Pennsylvania Department of Education (May 1, 2012). "2012-2013 Estimated State Property Tax Relief per Homestead".
- ↑ Pennsylvania Department of Education, Tax Relief per Homestead, May 1, 2010
- ↑ Pennsylvania Department of Education, Tax Relief per Homestead, May 1, 2009.
- ↑ Tax Relief per Homestead 2009, Pennsylvania Department of Education Report, May 1, 2009
- ↑ Pennsylvania Auditor General Office, Special Report Pennsylvania Property Tax Relief, 2-23-2010.
- ↑ Elias, Joe., Pennsylvania Treasury Department to issue $238 million in property tax rebates, The Harrisburg Patriot-News, |June 30, 2012
- ↑ Pennsylvania Department of Revenue., Property Tax/Rent Rebate Program, June 2012
- ↑ New Census Data on Property Taxes on Homeowners, Tax Foundation, September 22, 2009.
- ↑ Pennsylvania Office of the Governor Press Release, (November 10, 2005). "Home-Schooled, Charter School Children Can Participate in School District Extracurricular Activities".
- ↑ Pennsylvania Interscholastic Athletics Association (2012). "PIAA School Directory".
External links
Clinton County, Pennsylvania Schools | |||||||||||||||||
|---|---|---|---|---|---|---|---|---|---|---|---|---|---|---|---|---|---|
| |||||||||||||||||
Lycoming County, Pennsylvania Schools | |||||||||||||||||||||||||||||||||
|---|---|---|---|---|---|---|---|---|---|---|---|---|---|---|---|---|---|---|---|---|---|---|---|---|---|---|---|---|---|---|---|---|---|
| |||||||||||||||||||||||||||||||||
| |||||||||||||||||||||||||||||||||