Poverty in the United States
Poverty is a state of deprivation, lacking the usual or socially acceptable amount of money or material possessions.[1] The most common measure of poverty in the U.S. is the "poverty threshold" set by the U.S. government. This measure recognizes poverty as a lack of those goods and services commonly taken for granted by members of mainstream society.[2] The official threshold is adjusted for inflation using the consumer price index.
Most Americans will spend at least one year below the poverty line at some point between ages 25 and 75.[3] Poverty rates are persistently higher in rural and inner city parts of the country as compared to suburban areas.[4][5]
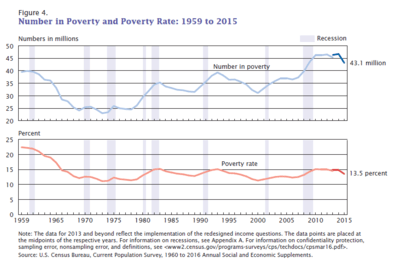
In 2015, 13.5% (43.1 million) Americans lived in poverty.[6] Starting in the 1930s, relative poverty rates have consistently exceeded those of other wealthy nations.[7] California has a poverty rate of 20.6%, the highest of any state in the country. The lowest poverty rates are found in New Hampshire, Vermont, Minnesota and Nebraska, which have between 8.7% and 9.1% of their population living in poverty.[8]
In 2009 the number of people who were in poverty was approaching 1960s levels that led to the national War on Poverty.[9] In 2011 extreme poverty in the United States, meaning households living on less than $2 per day before government benefits, was double 1996 levels at 1.5 million households, including 2.8 million children.[10]
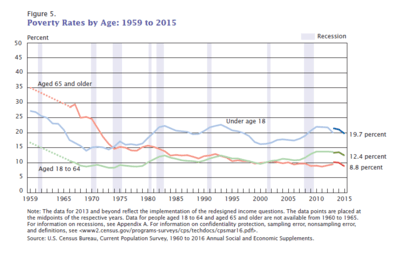
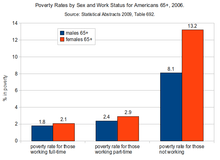
In 2012 the percentage of seniors living in poverty was 14% while 18% of children were.[11] The addition of Social Security benefits contributed more to reduce poverty than any other factor.[12]
Recent census data shows that half the population qualifies as poor or low income,[13] with one in five Millennials living in poverty.[14] Academic contributors to The Routledge Handbook of Poverty in the United States postulate that new and extreme forms of poverty have emerged in the U.S. as a result of neoliberal structural adjustment policies and globalization, which have rendered economically marginalized communities as destitute "surplus populations" in need of control and punishment.[15]
In 2011, child poverty reached record high levels, with 16.7 million children living in food insecure households, about 35% more than 2007 levels.[16] A 2013 UNICEF report ranked the U.S. as having the second highest relative child poverty rates in the developed world.[17] According to a 2016 study by the Urban Institute, teenagers in low income communities are often forced to join gangs, save school lunches, sell drugs or exchange sexual favors because they cannot afford food.[18]
There were about 643,000 sheltered and unsheltered homeless people nationwide in January 2009. Almost two-thirds stayed in an emergency shelter or transitional housing program and the other third were living on the street, in an abandoned building, or another place not meant for human habitation. About 1.56 million people, or about 0.5% of the U.S. population, used an emergency shelter or a transitional housing program between October 1, 2008 and September 30, 2009.[19] Around 44% of homeless people are employed.[20]
In June 2016, the IMF warned the United States that its high poverty rate needs to be tackled urgently by raising the minimum wage and offering paid maternity leave to women to encourage them to enter the labor force.[21]
Measures of poverty
Two official measures of poverty
There are 2 basic versions of the federal poverty measure: the poverty thresholds (which are the primary version) and the poverty guidelines. The Census Bureau issues the poverty thresholds, which are generally used for statistical purposes[22]—for example, to estimate the number of people in poverty nationwide each year and classify them by type of residence, race, and other social, economic, and demographic characteristics. The Department of Health and Human Services issues the poverty guidelines for administrative purposes—for instance, to determine whether a person or family is eligible for assistance through various federal programs.[23]
The "Orshansky Poverty Thresholds" form the basis for the current measure of poverty in the U.S. Mollie Orshansky was an economist working for the Social Security Administration (SSA). Her work appeared at an opportune moment. Orshansky's article was published later in the same year that Johnson declared war on poverty. Since her measure was absolute (i.e., did not depend on other events), it made it possible to objectively answer whether the U.S. government was "winning" this war. The newly formed United States Office of Economic Opportunity adopted the lower of the Orshansky poverty thresholds for statistical, planning, and budgetary purposes in May 1965.
The Bureau of the Budget (now the Office of Management and Budget) adopted Orshansky's definition for statistical use in all Executive departments. The measure gave a range of income cutoffs, or thresholds, adjusted for factors such as family size, sex of the family head, number of children under 18 years old, and farm or non-farm residence. The economy food plan (the least costly of four nutritionally adequate food plans designed by the Department of Agriculture) was at the core of this definition of poverty.[24]
At the time of creating the poverty definition, the Department of Agriculture found that families of three or more persons spent about one third of their after-tax income on food. For these families, poverty thresholds were set at three times the cost of the economy food plan. Different procedures were used for calculating poverty thresholds for two-person households and persons living alone. Annual updates of the SSA poverty thresholds were based on price changes in the economy food plan, but updates do not reflect other changes (food is no longer one-third of the after-tax income). Two changes were made to the poverty definition in 1969. Thresholds for non-farm families were tied to annual changes in the Consumer Price Index rather than changes in the cost of the economy food plan. Farm thresholds were raised from 70 to 85% of the non-farm levels.
In 1981, further changes were made to the poverty definition. Separate thresholds for "farm" and "female-householder" families were eliminated. The largest family size category became "nine persons or more."[24]
Apart from these changes, the U.S. government's approach to measuring poverty has remained static for the past forty years.
Recent poverty rate and guidelines
| Persons in Family Unit | 48 Contiguous States and D.C. | Alaska | Hawaii |
|---|---|---|---|
| 1 | $11,770 | $14,720 | $13,550 |
| 2 | $15,930 | $19,920 | $18,330 |
| 3 | $20,090 | $25,120 | $23,110 |
| 4 | $24,250 | $30,320 | $27,890 |
| 5 | $28,410 | $35,520 | $32,670 |
| 6 | $32,570 | $40,720 | $37,450 |
| 7 | $36,730 | $45,920 | $42,230 |
| 8 | $40,890 | $51,120 | $47,010 |
| Each additional person adds | $4,160 | $5,200 | $4,780 |
The poverty guideline figures are not the figures the Census Bureau uses to calculate the number of poor persons. The figures that the Census Bureau uses are the poverty thresholds. The Census Bureau provides an explanation of the difference between poverty thresholds and guidelines.[26] The Census Bureau uses a set of money income thresholds that vary by family size and composition to determine who is in poverty.[24] The 2010 figure for a family of 4 with no children under 18 years of age is $22,541, while the figure for a family of 4 with 2 children under 18 is $22,162.[27] For comparison, the 2011 HHS poverty guideline for a family of 4 is $22,350.
Numbers in other countries
Comparing poverty levels among countries is difficult, because a variety of factors are at play. The official number of poor in the United States in 2008 is about 39.1 million people, greater in number but not percentage than the officially poor in Indonesia, which has a far lower Human Development Index and the next largest population after the United States.[28][29] While the percentages appear the same, the actual income is not the same among both groups of people living below their nation's poverty levels.[30][31]
Understanding the many aspects not of using but of comparing poverty definitions can aid perception. The Human Poverty Index (HPI), or Human Development Index (HDI), may help global comparison in quality of living, but comparisons must be adjusted for differences within countries.[32]
Relative measures of poverty
Another way of looking at poverty is in relative terms. "Relative poverty" can be defined as having significantly less income and wealth than other members of society. Therefore, the relative poverty rate is a measure of income inequality. When the standard of living among those in more financially advantageous positions rises while that of those considered poor stagnates, the relative poverty rate will reflect such growing income inequality and increase. Conversely, the relative poverty rate can decrease, with low income people coming to have less wealth and income if wealthier people's wealth is reduced by a larger percentage than theirs.
Some critics argue that relying on income disparity to determine who is impoverished can be misleading. The Bureau of Labor Statistics data suggests that consumer spending varies much less than income. In 2008, the poorest one fifth of Americans households spent on average $12,955 per person for goods and services (other than taxes), the second quintile spent $14,168, the third $16,255, the fourth $19,695, while the richest fifth spent $26,644. The disparity of expenditures is much less than the disparity of income.[33]
Income distribution and relative poverty
Although the relative approach theoretically differs largely from the Orshansky definition, crucial variables of both poverty definitions are more similar than often thought. First, the so-called standardization of income in both approaches is very similar. To make incomes comparable among households of different sizes, equivalence scales are used to standardize household income to the level of a single person household. When compared to the US Census poverty line, which is based on a defined basket of goods, for the most prevalent household types both standardization methods show very similar results.
Poverty and demographics
In addition to family status, race/ethnicity and age also correlate with high poverty rates in the United States. Although data regarding race and poverty are more extensively published and cross tabulated, the family status correlation is by far the strongest.
Poverty and family status
According to the US Census, in 2007 5.8% of all people in married families lived in poverty,[38] as did 26.6% of all persons in single parent households[38] and 19.1% of all persons living alone.[38] More than 75% of all poor households are headed by women (2012).[39]
By race/ethnicity and family status, based on data from 2007
Among married couple families: 5.8% lived in poverty.[38] This number varied by race and ethnicity as follows:
5.4% of all white persons (which includes white Hispanics),[40]
10.7% of all black persons (which includes black Hispanics),[41] and
14.9% of all Hispanic persons (of any race)[42] living in poverty.
Among single parent (male or female) families: 26.6% lived in poverty.[38] This number varied by race and ethnicity as follows:
22.5% of all white persons (which includes white Hispanics),[40]
44.0% of all black persons (which includes black Hispanics),[41] and
33.4% of all Hispanic persons (of any race)[42] living in poverty.
Among individuals living alone: 19.1% lived in poverty.[38] This number varied by race and ethnicity as follows:
18% of white persons (which includes white Hispanics)[43]
28.9% of black persons (which includes black Hispanics)[42] and
27% of Hispanic persons (of any race)[44] living in poverty.
Poverty and race/ethnicity
The US Census declared that in 2014 14.8% of the general population lived in poverty:[45]
10.1% of all white non-Hispanic persons
12.0% of all Asian persons
23.6% of all Hispanic persons (of any race)
26.2% of all African American persons
28.3% of Native Americans / Alaska Natives
About half of those living in poverty are non-Hispanic white (19.6 million in 2010),[45] but poverty rates are much higher for Native Americans, for African Americans and for Hispanics. Non-Hispanic white children comprised 57% of all poor rural children.[46]
In FY 1978, African American families comprised 33.3% of TANF families, non-Hispanic white families comprised 31.2%, and 28.8% were Hispanic.[47]
Poverty among Native Americans
Poverty is also notoriously high on Native American reservations (see Reservation poverty). 7 of the 11 poorest counties in per capita income, including the 2 poorest in the U.S., encompass Lakota Sioux reservations in South Dakota.[48] This fact has been cited by some critics as a mechanism that enables the "kidnapping" of Lakota children by the state of South Dakota's Department of Social Services. The Lakota People's Law Project,[49] among other critics, allege that South Dakota "inappropriately equates economic poverty with neglect ... South Dakota's rate of identifying 'neglect' is 18% higher than the national average ... In 2010, the national average of state discernment of neglect, as a percent of total maltreatment of foster children prior to their being taken into custody by the state, was 78.3%. In South Dakota the rate was 95.8%."[50]
Poverty in the Pine Ridge Reservation in particular has had unprecedented effects on its residents' longevity. "Recent reports state the average life expectancy is 45 years old while others state that it is 48 years old for men and 52 years old for women. With either set of figures, that's the shortest life expectancy for any community in the Western Hemisphere outside Haiti, according to The Wall Street Journal."[51]
Poverty and age
The US Census declared that in 2010 15.1% of the general population lived in poverty:
22% of all people under age 18
13.7% of all people 19–21 and
9% of all people ages 65 and older[45]
The Organization for Economic Co-operation and Development (OECD) uses a different measure for poverty and declared in 2008 that child poverty in the US is 20% and poverty among the elderly is 23%.[52] The non-profit advocacy group Feeding America has released a study (May 2009) based on 2005–2007 data from the U.S. Census Bureau and the Agriculture Department, which claims that 3.5 million children under the age of 5 are at risk of hunger in the United States. The study claims that in 11 states, Louisiana, which has the highest rate, followed by North Carolina, Ohio, Kentucky, Texas, New Mexico, Kansas, South Carolina, Tennessee, Idaho and Arkansas, more than 20 percent of children under 5 are allegedly at risk of going hungry. (Receiving fewer than 1,800 calories per day) The study was paid by ConAgra Foods, a large food company.[53]
Child poverty
In 2012, 16.1 million American children were living in poverty. Outside of the 49 million Americans living in food insecure homes, 15.9 million of them were children.[54] In 2013, child poverty reached record high levels in the U.S., with 16.7 million children living in food insecure households. Many of the neighborhoods these children live in lack basic produce and nutritious food. 47 million Americans depend on food banks, more than 30% above 2007 levels. Households headed by single mothers are most likely to be affected. 30 percent of low-income single mothers cannot afford diapers.[55] Inability to afford this necessity can cause a chain reaction, including mental, health, and behavioral problems. Some women are forced to make use of one or two diapers, using them more than once. This causes rashes and sanitation problems as well as health problems. Without diapers, children are unable to enter into daycare. The lack of childcare can be detrimental to single mothers, hindering their ability to obtain employment.[55] Worst affected are Oregon, Arizona, New Mexico, Florida, and the District of Columbia, while North Dakota, New Hampshire, Virginia, Minnesota and Massachusetts are the least affected.[16] 31 million low-income children received free or reduced-price meals daily through the National School lunch program during the 2012 federal fiscal year. Nearly 14 million children are estimated to be served by Feeding America with over 3 million being of the ages of 5 and under.[56]
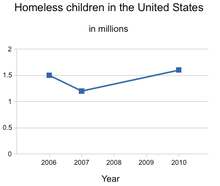
A 2014 report by the National Center on Family Homelessness states the number of homeless children in the U.S. has reached record levels, calculating that 2.5 million children, or one child in every 30, experienced homelessness in 2013. High levels of poverty, lack of affordable housing and domestic violence were cited as the primary causes.[57]
Poverty and education
Poverty affects individual access to quality education. The U.S. education system is funded by local communities; therefore the quality of materials and teachers reflects the affluence of community. Low income communities are not able to afford the quality education that high income communities do. Another important aspect of education in low income communities is the apathy of both students and teachers. To some, the children of the poor or ignorant are mere copies of their parents fated to live at the same level of income and education as their parents. The effect of such a perception can manifest itself in teachers who will not put forth the effort to teach and students who are opposed to learning; in both cases poor students are thought to be incapable.[58] Females in poverty are also likely to become pregnant at a young age, and with fewer resources to care for a child, young women often drop out of school.[59] Due to these and other reasons the quality of education between the classes is not equal.[60]
Food security
89 percent of the American households were food secure throughout the entire year of 2002, meaning that they had access at all times to enough food for an active, healthy life for all of the household members. The remaining households were food insecure at least some time during that year. The prevalence of food insecurity rose from 10.7% in 2001 to 11.1% in 2002, and the prevalence of food insecurity with hunger rose from 3.3% to 3.5%.[61]
In 2007, 88.9% of American households were food secure throughout the entire year.[62] The number of American households that were food secure throughout the entire year dropped to 85.4% in 2008.[63] As of 2012, the prevalence of food insecurity has been essentially unchanged since 2008.[64]
Factors in poverty
There are numerous factors related to poverty in the United States.
- According to the American Enterprise Institute, research has shown that income and intelligence are related. In a 1998 study, Charles Murray compared the earnings of 733 full sibling pairs with differing intelligence quotients (IQs). He referred to the sample as utopian in that the sampled pairs were raised in families with virtually no illegitimacy, divorce or poverty. The average earnings of sampled individuals with an IQ of under 75 was $11,000, compared to $16,000 for those with an IQ between 75 and 90, $23,000 for those with an IQ between 90 and 110, $27,000 for those with an IQ between 110 and 125, and $38,000 for those with an IQ above 125.[65][66] Murray's work on IQ has been criticized by Stephen Jay Gould, Loïc Wacquant and others.[67][68]
- Income has a high correlation with educational levels. In 2007, the median earnings of household headed by individuals with less than a 9th grade education was $20,805 while households headed by high school graduates earned $40,456, households headed by holders of bachelor's degrees earned $77,605, and families headed by individuals with professional degrees earned $100,000.[69]
- In many cases poverty is caused by job loss. In 2007, the poverty rate was 21.5% for individuals who were unemployed, but only 2.5% for individuals who were employed full-time.[69]
- In 1991, 8.3% of children in two-parent families were likely to live in poverty; 19.6% of children lived with a father in a single parent family; and 47.1% in a single parent family headed by a mother.[70]
- Income levels vary with age. For example, the median 2009 income for households headed by individuals age 15–24 was only $30,750, but increased to $50,188 for household headed by individuals age 25–34 and $61,083 for household headed by individuals 35–44.[71] Work experience and additional education may be factors.
- Income levels vary along racial/ethnic lines: 21% of all children in the United States live in poverty, about 46% of black children and 40% of Latino children.[72] The poverty rate is 9.9% for black married couples, and only 30% of black children are born to married couples (see Marriage below). The poverty rate for native born and naturalized whites is identical (9.6%). On the other hand, the poverty rate for naturalized blacks is 11.8% compared to 25.1% for native born blacks, suggesting race alone does not explain income disparity. Not all minorities have low incomes. Asian families have higher incomes than all other ethnic groups. For example, the 2005 median income of Asian families was $68,957 compared to the median income of white families of $59,124.[73] Asians, however, report discrimination occurrences more frequently than blacks. Specifically, 31% of Asians reported employment discrimination compared to 26% of blacks in 2005.[74]
- The relationship between tax rates and poverty is disputed. A study comparing high tax Scandinavian countries with the U. S. suggests high tax rates are inversely correlated with poverty rates.[75] The poverty rate, however, is low in some low tax countries like Switzerland. A comparison of poverty rates between states reveals that some low tax states have low poverty rates. For example, New Hampshire has the lowest poverty rate of any state in the U. S., and has very low taxes (46th among all states). It is true however that both Switzerland and New Hampshire have a very high household income and other measures offsetting the lack of taxation. For example, Switzerland has Universal Healthcare and a free system of education for children as young as four years old.[76] New Hampshire has no state income tax or sales tax, but does have the nation's highest property taxes.[77]
- The Heritage Foundation speculates that illegal immigration increases job competition among low wage earners, both native and foreign born. Additionally many first generation immigrants, namely those without a high school diploma, are also living in poverty themselves.[78]
- Economist Jared Bernstein and Elise Gould of the Economic Policy Institute suggest that poverty could have decreased significantly if inequality had not increased over the last few decades.[79][80]
- The poor in the United States are incarcerated at a much higher rate than their counterparts in other developed nations, with penal confinement being, according to sociologist Bruce Western, "commonplace for poor men of working age."[81] A 2015 study by the Vera Institute of Justice contends that jails in the U.S. have become "massive warehouses" of the impoverished since the 1980s.[82] Writing in The Routledge Handbook of Poverty in the United States, the scholars Reuben Jonathan Miller and Emily Shayman state that the shift to neoliberal policies "has more deeply embedded the carceral state within the lives of the poor, transforming what it means to be poor in America."[83]
Concerns regarding accuracy
In recent years, there have been a number of concerns raised about the official U.S. poverty measure. In 1995, the National Research Council's Committee on National Statistics convened a panel on measuring poverty. The findings of the panel were that "the official poverty measure in the United States is flawed and does not adequately inform policy-makers or the public about who is poor and who is not poor."
The panel was chaired by Robert Michael, former Dean of the Harris School of the University of Chicago. According to Michael, the official U.S. poverty measure "has not kept pace with far-reaching changes in society and the economy." The panel proposed a model based on disposable income:
| “ | According to the panel's recommended measure, income would include, in addition to money received, the value of non-cash benefits such as food stamps, school lunches and public housing that can be used to satisfy basic needs. The new measure also would subtract from gross income certain expenses that cannot be used for these basic needs, such as income taxes, child-support payments, medical costs, health-insurance premiums and work-related expenses, including child care.[84] | ” |
Understating poverty
Many sociologists and government officials have argued that poverty in the United States is understated, meaning that there are more households living in actual poverty than there are households below the poverty threshold.[85] A recent NPR report states that as many as 30% of Americans have trouble making ends meet and other advocates have made supporting claims that the rate of actual poverty in the US is far higher than that calculated by using the poverty threshold.[85] A study taken in 2012 estimated that roughly 38% of Americans live "paycheck to paycheck."[86]
According to William H. Chafe, if one used a relative standard for measuring poverty (a standard that took into account the rising standards of living rather than an absolute dollar figure) then 18% of families were living in poverty in 1968, not 13% as officially estimated at that time.[87]
As far back as 1969, the Bureau of Labor Statistics put forward suggested budgets for adequate family living. 60% of working-class Americans lived below one of these budgets, which suggested that a far higher proportion of Americans lived in poverty than the official poverty line suggested. These findings were also used by observers on the left when questioning the long-established view that most Americans had attained an affluent standard of living in the two decades following the end of the Second World War.[88][89]

Using a definition of relative poverty (reflecting disposable income below half the median of adjusted national income), it was estimated that, between 1979 and 1982, 17.1% of Americans lived in poverty.[90]
As noted above, the poverty thresholds used by the US government were originally developed during the Johnson administration's War on Poverty initiative in 1963–1964.[91][92] Mollie Orshansky, the government economist working at the Social Security Administration who developed the thresholds, based the threshold levels on the cost of purchasing what in the mid-1950s had been determined by the US Department of Agriculture to be the minimal nutritionally-adequate amount of food necessary to feed a family. Orshansky multiplied the cost of the food basket by a factor of three, under the assumption that the average family spent one third of its income on food.
While the poverty threshold is updated for inflation every year, the basket of food used to determine what constitutes being deprived of a socially acceptable minimum standard of living has not been updated since 1955. As a result, the current poverty line only takes into account food purchases that were common more than 50 years ago, updating their cost using the Consumer Price Index. When methods similar to Orshansky's were used to update the food basket using prices for the year 2000 instead of from nearly a half century earlier, it was found that the poverty line should actually be 200% higher than the official level being used by the government in that year.[93]
Yet even that higher level could still be considered flawed, as it would be based almost entirely on food costs and on the assumption that families still spend a third of their income on food. In fact, Americans typically spent less than one tenth of their after-tax income on food in 2000.[94] For many families, the costs of housing, health insurance and medical care, transportation, and access to basic telecommunications take a much larger bite out of the family's income today than a half century ago; yet, as noted above,[91][92] none of these costs are considered in determining the official poverty thresholds. According to John Schwarz, a political scientist at the University of Arizona:
| “ | The official poverty line today is essentially what it takes in today's dollars, adjusted for inflation, to purchase the same poverty-line level of living that was appropriate to a half century ago, in 1955, for that year furnished the basic data for the formula for the very first poverty measure. Updated thereafter only for inflation, the poverty line lost all connection over time with current consumption patterns of the average family. Quite a few families then didn't have their own private telephone, or a car, or even a mixer in their kitchen ... The official poverty line has thus been allowed to fall substantially below a socially decent minimum, even though its intention was to measure such a minimum. | ” |
The issue of understating poverty is especially pressing in states with both a high cost of living and a high poverty rate such as California where the median home price in May 2006 was determined to be $564,430.[95] In the Monterey area, where the low-pay industry of agriculture is the largest sector in the economy and the majority of the population lacks a college education, the median home price was determined to be $723,790, requiring an upper middle class income only earned by roughly 20% of all households in the county.[95][96]
Such fluctuations in local markets are, however, not considered in the Federal poverty threshold and thus leave many who live in poverty-like conditions out of the total number of households classified as poor.
In 2011, the Census Bureau introduced a new supplemental poverty measure aimed at providing a more accurate picture of the true extent of poverty in the United States. The SPM extends the official poverty measure by taking account of many of the government programs designed to assist low-income families and individuals that are not included in the current official poverty measure.[8] According to this new measure, 16% of Americans lived in poverty in 2011, compared with the official figure of 15.2%. The new measure also estimated that nearly half of all Americans lived in poverty that year, defined as living within 200% of the federal poverty line.[97]
Duke University Professor of Public Policy and Economics Sandy Darity, Jr. says, "There is no exact way of measuring poverty. The measures are contingent on how we conceive of and define poverty. Efforts to develop more refined measures have been dominated by researchers who intentionally want to provide estimates that reduce the magnitude of poverty."[98]
Overstating poverty
Some critics assert that the official U.S. poverty definition is inconsistent with how it is defined by its own citizens and the rest of the world, because the U.S. government considers many citizens statistically impoverished despite their ability to sufficiently meet their basic needs. According to a heavily criticised[99][100][101][102] 2011 paper by The Heritage Foundation research fellow Robert Rector, of the 43.6 million Americans deemed by the U.S. Census Bureau to be below the poverty level in 2009, the majority had adequate shelter, food, clothing and medical care. In addition, the paper stated that those assessed as below the poverty line in 2011 have a much higher quality of living than those who were identified by the census 40 years ago as being in poverty. For example, in 2005, 63.7% of those living in poverty had cable or satellite television. In some cases the report even said that people currently living in poverty were actually better off than middle class people of the recent past. For example, in 2005, 78.3% of households living in poverty had air conditioning, whereas in 1970, 36.0% of all households had air conditioning.[103][104]
According to The Heritage Foundation, the federal poverty line also excludes income other than cash income, especially welfare benefits. Thus, if food stamps and public housing were successfully raising the standard of living for poverty stricken individuals, then the poverty line figures would not shift, since they do not consider the income equivalents of such entitlements.[105]
A 1993 study of low income single mothers titled Making Ends Meet, by Kathryn Edin, a sociologist at the University of Pennsylvania, showed that the mothers spent more than their reported incomes because they could not "make ends meet" without such expenditures. According to Edin, they made up the difference through contributions from family members, absent boyfriends, off-the-book jobs, and church charity.
According to Edin: "No one avoided the unnecessary expenditures, such as the occasional trip to the Dairy Queen, or a pair of stylish new sneakers for the son who might otherwise sell drugs to get them some money or something, or the Cable TV subscription for the kids home alone and you are afraid they will be out on the street if they are not watching TV." However many mothers skipped meals or did odd jobs to cover those expenses. According to Edin, for "most welfare-reliant mothers food and shelter alone cost almost as much as these mothers received from the government. For more than one-third, food and housing costs exceeded their cash benefits, leaving no extra money for uncovered medical care, clothing, and other household expenses."[106]
Fighting poverty
In the age of inequality, such anti-poverty policies are more important than ever, as higher inequality creates both more poverty along with steeper barriers to getting ahead, whether through the lack of early education, nutrition, adequate housing, and a host of other poverty-related conditions that dampen ones chances in life.
There have been many governmental and nongovernmental efforts to reduce poverty and its effects. These range in scope from neighborhood efforts to campaigns with a national focus. They target specific groups affected by poverty such as children, people who are autistic, immigrants, or people who are homeless. Efforts to alleviate poverty use a disparate set of methods, such as advocacy, education, social work, legislation, direct service or charity, and community organizing.
Recent debates have centered on the need for policies that focus on both "income poverty" and "asset poverty."[108] Advocates for the approach argue that traditional governmental poverty policies focus solely on supplementing the income of the poor through programs such as Aid to Families with Dependent Children (AFDC) and Food Stamps. According to the CFED 2012 Assets & Opportunity Scorecard, 27 percent of households – nearly double the percentage that are income poor – are living in "asset poverty." These families do not have the savings or other assets to cover basic expenses (equivalent to what could be purchased with a poverty level income) for three months if a layoff or other emergency leads to loss of income. Since 2009, the number of asset poor families has increased by 21 percent from about one in five families to one in four families. In order to provide assistance to such asset poor families, Congress appropriated $24 million to administer the Assets for Independence Program under the supervision of the US Department for Health and Human Services. The program enables community-based nonprofits and government agencies to implement Individual Development Account or IDA programs, which are an asset-based development initiative. Every dollar accumulated in IDA savings is matched by federal and non-federal funds to enable households to add to their assets portfolio by buying their first home, acquiring a post-secondary education, or starting or expanding a small business.[109]
Additionally, the Earned Income Tax Credit (EITC or EIC) is a credit for people who earn low-to-moderate incomes. This credit allows them to get money from the government if their total tax outlay is less than the total credit earned, meaning it is not just a reduction in total tax paid but can also bring new income to the household. The Earned Income Tax Credit is viewed as the largest poverty reduction program in the United States. There is an ongoing debate in the U.S. about what the most effective way to fight poverty is, through the tax code with the EITC, or through the minimum wage laws.
Government safety net programs put in place since the War on Poverty have helped reduce the poverty rate from 26% in 1967 to 16% in 2012, according to a Supplemental Poverty Model (SPM) created by Columbia University, while the official U.S. Poverty Rate has not changed, as the economy by itself has done little to reduce poverty. According to the 2013 Columbia University study which created the (SPM) method of measuring poverty, without such programs the poverty rate would be 29% today.[110] An analysis of the study by Kevin Drum suggests the American welfare state effectively reduces poverty among the elderly but provides relatively little assistance to the working-age poor.[111] A 2014 study by Pew Charitable Trusts shows that without social programs like food stamps, social security and the federal EITC, the poverty rate in the U.S. would be much higher.[112] Nevertheless, the U.S. has the weakest social safety net of all developed nations.[113][114][115] Sociologist Monica Prasad of Northwestern University argues that this developed because of government intervention rather than lack of it, which pushed consumer credit for meeting citizens' needs rather than applying social welfare policies as in Europe.[116]
See also

- Income in the United States
- Income inequality in the United States
- Basic income in the United States
- Income deficit
- List of U.S. states by poverty rate
- List of lowest-income places in the United States
- Living wage in the United States
- List of jobs in United States by average wage
- Lowest-income counties in the United States
- Homelessness in the United States
- Hunger in the United States
- Poor person
- Social programs in the United States
- Pathways out of Poverty (POP)
- Soup kitchen
Other
- Human Poverty Index
- Mississippi Teacher Corps
- Basic Income
- Negative Income Tax
- Tipping Point Community
- Redistributive change
- De-industrialization crisis
- The Other America
- Two Americas
- Kids Against Hunger
- Can you hear their voices? (1931 play)
- Feminization of poverty
- Unintended pregnancy
- Social determinants of health in poverty
International
References
- ↑ Zweig, Michael (2004) What's Class Got to do With It, American Society in the Twenty-first Century. ILR Press. ISBN 978-0-8014-8899-3
- ↑ Schwartz, J. E. (2005). Freedom reclaimed: Rediscovering the American vision. Baltimore: G-University Press.
- ↑ Hacker, J. S. (2006). The great risk shift: The new insecurity and the decline of the American dream. New York: Oxford University Press (USA).
- ↑ Savage, Sarah. "Child Poverty High in Rural America" (PDF). Retrieved 2008-08-26.
- ↑ Child Poverty High in Rural America Newswise, Retrieved on August 26, 2008.
- ↑ "Basic Statistics - Talk Poverty". Talk Poverty. Retrieved 2016-10-27.
- ↑ Woolf, Steven; Aaron, Laudon. "U.S. Health in International Perspective". National Research Council and Institute of Medicine. pp. 171–172. Retrieved 11 February 2014.
- 1 2 Renwick, Trudi; Fox, Liana (13 September 2016). "The Supplemental Poverty Measure: 2015". United States Census Bureau.
Number and Percentage of People in Poverty by State Using 3-Year Average Over 2013, 2014, and 2015
- ↑ "US poverty on track to post record gain in 2009". Associated Press. 2009-04-13. Retrieved 2013-05-20.
- ↑ "Extreme Poverty in the United States, 1996 to 2011" National Poverty Center, February 2012
- ↑ "The Research Supplemental Poverty Measure " United States Census Bureau November 2013
- ↑ Povery in 13 states is worse than we thought Washington Post November 8, 2013
- ↑ Census data: Half of U.S. poor or low income. CBS News, 15 December 2011. Retrieved 10 February 2014.
- ↑ Jana Kasperkevic (26 December 2014). One in five millennials lives in poverty, report finds. The Guardian. Retrieved 26 December 2014.
- ↑ Stephen Haymes, Maria Vidal de Haymes and Reuben Miller (eds), The Routledge Handbook of Poverty in the United States, (London: Routledge, 2015), ISBN 0415673445, pp. 2 & 3.
- 1 2 Walker, Duncan (6 March 2013). "The children going hungry in America". BBC News. Retrieved 13 March 2013.
- ↑ Fisher, Max (15 April 2013). Map: How 35 countries compare on child poverty (the U.S. is ranked 34th). The Washington Post. Retrieved 16 February 2014. See also: Child well-being in rich countries: A comparative overview. UNICEF office of Research. p. 7.
- ↑ US teens often forced to trade sex work for food, study finds. The Guardian. September 12, 2016.
- ↑ HUD 5th Annual Homelessness Assessment Report to Congress, June 2010
- ↑ Employment and Homelessness. National Coalition for the Homeless, July 2009.
- ↑ IMF warns the US over high poverty. BBC, 22 June 2016.
- ↑ "How the Census Bureau Measures Poverty". census.gov. United States Census Bureau. Retrieved September 16, 2015.
- ↑ "2015 POVERTY GUIDELINES". hhs.gov. United States Department of Health and Human Services. Retrieved September 3, 2015.
- 1 2 3 Poverty Definition U.S. Census Bureau. Accessed: 2003-12-27.
- ↑ http://aspe.hhs.gov/poverty/15poverty.cfm
- ↑ Census Bureau answer to What is the difference between poverty thresholds and guidelines?
- ↑ Census Bureau Poverty thresholds
- ↑ Census Bureau:Poverty: 2007 and 2008 American Community Surveys
- ↑ BPS:Miskin
- ↑ http://www.census.gov/hhes/www/poverty/data/incpovhlth/2011/table3.pdf
- ↑ INSEE Nombre et taux de personnes vivant sous le seuil de pauvreté selon leur âge
- ↑ "http://inequalitywatch.eu/spip.php?article99" Eurostat 2010
- ↑ Bureau of Labor Statistics' 2008 Consumer Spending Survey, Table 1 ftp://ftp.bls.gov/pub/special.requests/ce/standard/2008/quintile.txt. The reported expenditures were computed by dividing the average annual expenditures (reduced by real property, income and other taxes) by the average number of persons in the household.
- ↑ Bassuk, E.L., et al. (2011) America's Youngest Outcasts: 2010 (Needham, MA: The National Center on Family Homelessness) page 20
- ↑ "Homeless children at record high in US. Can the trend be reversed?" Christian Science Monitor, December 13, 2011
- 1 2 "State of the Homeless 2012" Coalition for the Homeless, June 8, 2012
- ↑ "600 homeless children in D.C., and no one seems to care" Washington Post, February 8, 2013
- 1 2 3 4 5 6 U.S. Census Bureau. Current Population Survey. Persons in Families by Family Structure, Age, and Sex, Iterated by Income-to-Poverty Ratio and Race: 2007: Below 100% of Poverty – All Races.
- ↑ Dáil, Paula vW. (2012). Women and Poverty in 21st Century America. NC, USA: McFarland. p. 27. ISBN 978-0-7864-4903-3.
- 1 2 U.S. Census Bureau. Current Population Survey. People in Families by Family Structure, Age, and Sex, Iterated by Income-to-Poverty Ratio and Race: 2007: Below 100% of Poverty – White Alone.
- 1 2 "Poverty 3-Part 100_06". Pubdb3.census.gov. 2008-08-26. Retrieved 2010-09-16.
- 1 2 3 "Poverty 2-Part 100_09". Pubdb3.census.gov. 2008-08-26. Retrieved 2010-09-16.
- ↑ "Poverty 1-Part 100_03". Pubdb3.census.gov. 2008-08-26. Retrieved 2010-09-16.
- ↑ "Poverty 1-Part 100_09". Pubdb3.census.gov. 2008-08-26. Retrieved 2010-09-16.
- 1 2 3 "Income and Poverty in the United States: 2014". U.S. Census Bureau
- ↑ "Poverty Is a Persistent Reality for Many Rural Children in U.S.", William O'Hare (September 2009), Population Reference Bureau.
- ↑ "Characteristics and Financial Circumstances of TANF Recipients – Fiscal Year 2009". United States Department of Health and Human Services.
- ↑ Statistics derived from U.S. Census Bureau data; U.S. Department of Commerce, Bureau of Economic Analysis, Survey of Current Business; and DataQuick Information Systems, a public records database company located in La Jolla, San Diego, CA.
- ↑ Lakota People's Law Project
- ↑ Lakota Peoples Law Project,. United States. Senate. Reviewing the Facts: An Assessment of the Accuracy of NPR's Native Foster Care: Lost Children, Shattered Families. Santa Cruz :, 2013. Web. <http://www.docs.lakotalaw.org/ICWA-Coalition_Report-to-Congress.pdf>.
- ↑ . American Indian Humanitarian Foundation. N.p.. Web. 17 Jan 2014. <http://www.4aihf.org/id40.html>.
- ↑ http://www.oecd.org/dataoecd/47/2/41528678.pdf
- ↑ "3.5M Kids Under 5 On Verge Of Going Hungry
Study: 11 Percent Of U.S. Households Lack Food For Healthy Lifestyle" ("SHTML). Health. CBS NEWS. 2009-05-07. Retrieved 2009-05-08. - ↑ http://feedingamerica.org/hunger-in-america/hunger-facts/hunger-and-poverty-statistics.aspx
- 1 2 http://www.thenation.com/article/176121/poverty-2013-when-even-diapers-are-luxury#
- ↑ http://feedingamerica.org/hunger-in-america/hunger-facts/child-hunger-facts.aspx
- ↑ David Crary and Lisa Leff (November 17, 2014). New Report: Child Homelessness on the Rise in US. The Associated Press. Retrieved November 17, 2014.
- ↑ Lewis, Oscar. Culture of Poverty, 1966.
- ↑ vW. Dail, Paula. Women and Poverty in 21st Century America. McFarland and Company Inc., Publishers. p. 161. ISBN 9780786449033.
- ↑ Doob, Christopher (2013). Social Inequality and Stratification in US Society. Upper Saddle River, New Jersey: Pearson Education Inc. p. 38. ISBN 978-0-205-79241-2.
- ↑ Household Food Security in the United States, 2002 – United States Department of Agriculture
- ↑ Household Food Security in the United States, 2007 – United States Department of Agriculture
- ↑ Household Food Security in the United States, 2008 – United States Department of Agriculture
- ↑ Household Food Security in the United States, 2012 – United States Department of Agriculture
- ↑ Charles Murray (1998). Income Inequality and IQ. Washington: AEI Press.
- ↑
- ↑ The Bell Curve#Criticisms
- ↑ Loïc Wacquant. Prisons of Poverty. University of Minnesota Press (2009). ISBN 0816639019. pp. 11-14.
- 1 2 "U. S. Census: Income, Expenditures, Poverty and Wealth" (PDF). Retrieved 2010-03-20.
- ↑ futureofchildren.org
- ↑ Census Bureau, Income Poverty, and Health Insurance Coverage in the U. S.:2009 http://www.census.gov/prod/2010pubs/p60-238.pdf
- ↑ Center for the Future of Children, The Future of Children. Vol. 7, No 2, 1997.
- ↑ Source: U. S. Census, Family Income Tables, http://pubdb3.census.gov/macro/032006/faminc/toc.htm.
- ↑ Amy Joyce, "The Bias Breakdown," The Washington Post, December 9, 2005, p. D01 citing Gallop Poll data.
- ↑ "The Social Benefits and Economic Costs of Taxation" (PDF). Retrieved 2007-12-20.
- ↑ The Swiss education system swissworld.org, Retrieved on 2009-06-23
- ↑ "New Hampshire's State and Local Tax Burden, 1970–2006". The Tax Foundation. 2008-08-07. http://www.taxfoundation.org/taxdata/show/468.html. Retrieved 2010-07-31.
- ↑ "Heritage Foundation's views of immigration and poverty". Retrieved 2007-02-25.
- ↑ Jared Bernstein (January 13, 2014). Poverty and Inequality, in Charts. The New York Times Retrieved September 20, 2014.
- ↑ Elise Gould (January 15, 2014). No Matter How We Measure Poverty, the Poverty Rate Would Be Much Lower If Economic Growth Were More Broadly Shared. Economic Policy Institute. Retrieved September 20, 2014.
- ↑ Bruce Western (May 2011). "Poverty Politics and Crime Control in Europe and America". Contemporary Sociology. 40 (3): 283–286. doi:10.1177/0094306110404514d.
- ↑ Tom Hall (13 February 2015).Study says US jails have become "massive warehouses" for the poor. World Socialist Web Site. Retrieved February 15, 2015.
- ↑ Stephen Haymes, Maria Vidal de Haymes and Reuben Miller (eds), The Routledge Handbook of Poverty in the United States, (London: Routledge, 2015), ISBN 0415673445, p. 346.
- ↑ Harms, W. (1995) Poverty definition flawed, more accurate measure needed The University of Chicago Chronicle, 14:17.
- 1 2 Adams, J.Q.; Pearlie Strother-Adams (2001). Dealing with Diversity. Chicago, IL: Kendall/Hunt Publishing Company. ISBN 0-7872-8145-X.
- ↑ CBS News http://www.cbsnews.com/8301-505144_162-57477881/more-americans-live-paycheck-to-paycheck/. Missing or empty
|title=(help) - ↑ The Unfinished Journey: America Since World War II by William H. Chafe
- ↑ "America in Our Time: From World War II to Nixon--what Happened and why". 1976. ISBN 0691122881.
- ↑ http://www.thenation.com/article/155492/seventies-show?page=full
- ↑ Jennings, James (1994-01-01). "Understanding the Nature of Poverty in Urban America". ISBN 9780275949532.
- 1 2 Fisher, Gordon M. "The Development of the Orshansky Poverty Thresholds and Their Subsequent History as the Official U.S. Poverty Measure". Poverty – Experimental Measures. U.S. Census Bureau. Retrieved 11 January 2012.
- 1 2 Fisher, Gordon M. "Remembering Mollie Orshansky – The Developer of the Poverty Thresholds". U.S. Social Security Administration Office of Retirement and Disability Policy. Retrieved 11 January 2012.
- ↑ Schwarz, John E. (2005). Freedom Reclaimed: Rediscovering the American Vision. Baltimore: Johns Hopkins University. pp. 194 note 13. ISBN 0-8018-7981-7.
- ↑ Clauson, Annette (September 2000). "Despite Higher Food Prices, Percent of U.S. Income Spent on Food Remains Constant". Amber Waves (U.S. Department of Agriculture Economic Research Service).
- 1 2 "California median home price". Retrieved 2006-07-06.
- ↑ "Monterey County income distribution". Retrieved 2006-07-06.
- ↑ http://www.epi.org/publication/poverty-measure-highlights-dire-circumstances/
- ↑ http://today.duke.edu/2011/11/povertytip
- ↑ Jonathan Rothwell (8 November 2011). Why Heritage Is Wrong About Poverty in America. The New Republic Retrieved 18 November 2014.
- ↑ Melissa Boteach and Donna Cooper (5 August 2011). What You Need When You're Poor; Heritage Foundation Hasn't a Clue. Center For American Progress. Retrieved 18 November 2014
- ↑ Courtland Milloy (13 September 2011). Study dismisses poverty, but try telling that to the poor. The Washington Post. Retrieved 18 November 2014.
- ↑ Katrina vanden Heuvel (28 July 2011). Colbert Challenges the Poverty Deniers. The Nation Retrieved 18 November 2014.
- ↑ Rector, Robert; Rachel, Sheffield (July 18, 2011). "Air Conditioning, Cable TV, and an Xbox: What is Poverty in the United States Today?". The Heritage Foundation. Retrieved July 27, 2011.
- ↑ Timbro. "E.U. vs U.S.A" (PDF). Retrieved 2007-11-10.
- ↑ Poor Poverty Yardsticks by Rea Hederman, Heritage Foundation, Washington Post. September 7, 2006. Accessed: 2007-02-18
- ↑ Devising New Math to Define Poverty by Louis Uchitelle, New York Times. 1999-10-18. Accessed: 2006-06-16
- ↑ Kevin Drum (26 September 2013). We Can Reduce Poverty If We Want To. We Just Have To Want To. Mother Jones. Retrieved 28 September 2013.
- ↑ http://assetsandopportunity.org/scorecard/
- ↑ url = http://www.acf.hhs.gov/programs/ocs/fact-sheet-ocs | accessdate = April 22, 2013/
- ↑ Zachary A. Goldfarb (9 December 2013). Study: U.S. poverty rate decreased over past half-century thanks to safety-net programs. The Washington Post. Retrieved 20 January 2015.
- ↑ Drum, Kevin (9 December 2013). New Study Says Poverty Rate Hasn't Budged For 40 Years. Mother Jones. Retrieved 15 February 2014.
- ↑ Jana Kasperkevic (12 November 2014). Welfare programs shown to reduce poverty in America. The Guardian. Retrieved 27 December 2014.
- ↑ Kenworthy, L. (1999). "Do Social-Welfare Policies Reduce Poverty? A Cross-National Assessment". Social Forces. 77 (3): 1119–1139. doi:10.1093/sf/77.3.1119.
- ↑ Bradley, D., E. Huber, S. Moller, F. Nielsen, and J. D. Stephens (2003). "Determinants of Relative Poverty in Advanced Capitalist Democracies". American Sociological Review. 68 (1): 22–51. doi:10.2307/3088901.
- ↑ Gould, Elise and Wething, Hilary (24 July 2012). "U.S. poverty rates higher, safety net weaker than in peer countries." Economic Policy Institute. Retrieved 11 February 2014.
- ↑ Monica Prasad, The Land of Too Much: American Abundance and the Paradox of Poverty, (Harvard University Press, 2012), ISBN 0674066529
Bibliography and further reading
- Abramsky, Sasha (2013). The American Way of Poverty: How the Other Half Still Lives. Nation Books. ISBN 1568587260.
- Baradaran, Mehrsa (2015). How the Other Half Banks: Exclusion, Exploitation, and the Threat to Democracy. Harvard University Press. ISBN 9780674286061
- Caudill, Harry (1962). Night Comes to the Cumberlands. Little, Brown and Company. ISBN 0-316-13212-8.
- Desmond, Matthew (2016). Evicted: Poverty and Profit in the American City. Crown Publishing Group. ISBN 0553447432
- Edin, Kathryn and Lein, Laura (1997). Making Ends Meet: How Single Mothers Survive Welfare and Low-Wage Work. Russell Sage Foundation. ISBN 087154234X
- Ehrenreich, Barbara (2001). Nickel and Dimed: On (Not) Getting By in America. Metropolitan Books. ISBN 0-8050-8838-5
- Harrington, Michael (1962). The Other America. Macmillan. ISBN 0-684-82678-X.
- Haymes, Stephen, Maria Vidal de Haymes and Reuben Miller (eds). The Routledge Handbook of Poverty in the United States. Routledge, 2015. ISBN 0415673445.
- Hedges, Chris and Sacco, Joe (2012). Days of Destruction, Days of Revolt. Nation Books. ISBN 1568586434
- Howe, Louise Kapp, ed. (1970). The White Majority: between Poverty and Affluence, in series, Vintage Book[s]. New York: New York: Random House. xii, 303 p. SBN 394-71666-3
- Katz, Michael B (2013). The Undeserving Poor: America's Enduring Confrontation with Poverty: Fully Updated and Revised. Oxford University Press; 2 edition. ISBN 0199933952
- Lyon-Callo, Vincent (2004). Inequality, Poverty, and Neoliberal Governance: Activist Ethnography in the Homeless Sheltering Industry. University of Toronto Press. ISBN 1442600861
- Prasad, Monica (2012). The Land of Too Much: American Abundance and the Paradox of Poverty. Harvard University Press. ISBN 0674066529
- Sarnoff, Susan; Yoon, Hong-Sik (2003). "Central Appalachia – Still the Other America". Journal of Poverty. The Haworth Press. 7 (1 & 2): 123–139. doi:10.1300/J134v07n01_06.
- Sciandra, M., Sanbonmatsu, L., Duncan, G. J., Gennetian, L. A., Katz, L. F., Kessler, R. C., et al. (2013). Long-term effects of the Moving to Opportunity residential mobility experiment on crime and delinquency. Journal of Exp Criminol 9, 451-489.
- Shipler, David K (2004). The Working Poor :Invisible in America, Knopf.
- Wacquant, Loïc (2009). Prisons of Poverty. University of Minnesota Press. ISBN 0816639019
- ——— (2009). Punishing the Poor: The Neoliberal Government of Social Insecurity. Duke University Press. ISBN 082234422X
External links
- U.S. Census Bureau Poverty Definition
- U.S. Census Bureau Poverty in the United States
- Child Poverty and Tax: a simple graph of child disposable income disparity in OECD countries against tax burdens.
- F.H.C. Ministries Charity is not Reform!
- From Poverty to Prosperity: A National Strategy to Cut Poverty in Half, The Center for American Progress, April 2007.
- Explanation of poverty definition by economist Ellen Frank in Dollars & Sense magazine, January/February 2006
- "Deciding Who's Poor" by economist Barbara Bergmann in Dollars & Sense magazine, March/April 2000
- 37 million poor hidden in the land of plenty
- David Walls, Models of Poverty and Planned Change
- U.S. Government Does Relatively Little to Lessen Child Poverty Rates
- U.S. Department of Health & Human Services Poverty Guidelines, Research, and Measurement
- Cities Tolerate Homeless Camps by Jennifer Levitz, The Wall Street Journal, August 11, 2009
- The Forgotten Americans PBS series by Hector Galan about colonias.
- Americans living in Third World conditions This article discusses the living conditions of people inhabiting colonias (with pictures).
- Steve Suitts, "The Worst of Times: Children in Extreme Poverty in the South and Nation," Southern Spaces, 29 June 2010.
- 80 Percent Of U.S. Adults Face Near-Poverty, Unemployment: Survey—Huffington Post, July 28, 2013
- The American Way of Poverty: As Inequality Hits Record High, Sasha Abramsky on the Forgotten Poor. DemocracyNow! September 12, 2013.
- America's Shameful Poverty Stats, Sasha Abramsky. The Nation, September 18, 2013.
- How Much Money to End Poverty in America? Truthdig. Sep 26, 2013.
- Poverty in the United States: 2012 Congressional Research Service
- Here's The Painful Truth About What It Means To Be 'Working Poor' In America. The Huffington Post, May 19, 2014.
- 10 Poverty Myths, Busted. Mother Jones, March/April 2014 issue.
- FPL Calculator, A mobile app for calculating federal poverty level.
- The Poor Get Prison. Institute for Policy Studies, 2015.
- Poverty research on IssueLab.