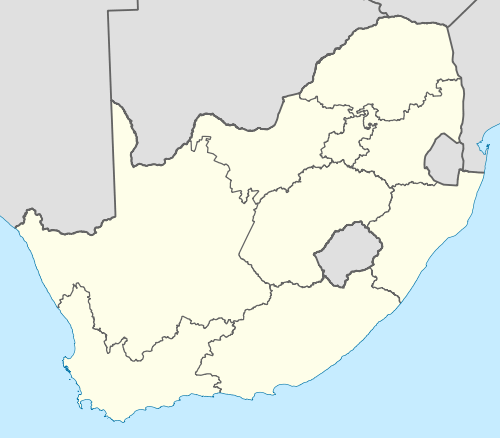
List of South African provinces by gross domestic product
This article lists the provinces of South Africa by their gross regional domestic product (GDP).
| Rank | Province | GDP (2010; R millions)[1] | Percentage |
|---|---|---|---|
| 1 | Gauteng | 897,553 | 33.7 |
| 2 | KwaZulu-Natal | 420,647 | 15.8 |
| 3 | Western Cape | 376,284 | 14.1 |
| 4 | Eastern Cape | 203,993 | 7.7 |
| 5 | Limpopo | 191,934 | 7.2 |
| 6 | Mpumalanga | 187,367 | 7.0 |
| 7 | North West | 177,075 | 6.7 |
| 8 | Free State | 145,405 | 5.5 |
| 9 | Northern Cape | 61,175 | 2.3 |
| South Africa | 2,661,433 | 100.0 | |
See also
References
- ↑ Gross domestic product: Annual estimates 2002–2010, Regional estimates 2002–2010, Third quarter 2011 (PDF) (Report). Statistics South Africa. 29 November 2011. p. 31. Retrieved 1 March 2012.
This article is issued from Wikipedia - version of the 10/28/2012. The text is available under the Creative Commons Attribution/Share Alike but additional terms may apply for the media files.
