Madrid City Council election, 1991
|
|
|
|
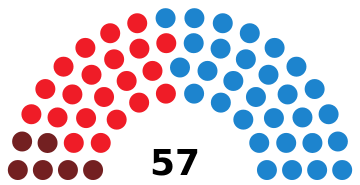
All 57 seats in the Madrid City Council
29 seats needed for a majority |
| Registered |
2,524,947  6.3% 6.3% |
| Turnout |
1,493,222 (59.1%)
 11.0 pp 11.0 pp |
| |
First party |
Second party |
| |
.jpg) |
.jpg) |
| Leader |
José María Álvarez del Manzano |
Juan Barranco |
| Party |
PP |
PSM–PSOE |
| Leader since |
10 October 1986 |
19 January 1986 |
| Last election |
20 seats, 34.0%[lower-alpha 1] |
24 seats, 40.5% |
| Seats won |
30 |
21 |
| Seat change |
10 |
3 |
| Popular vote |
702,834 |
510,556 |
| Percentage |
47.2% |
34.3% |
| Swing |
13.2 pp |
6.2 pp |
|
| |
Third party |
Fourth party |
| |
 |
|
| Leader |
Francisco Herrera |
José Ramón Lasuén[1] |
| Party |
IU |
CDS |
| Leader since |
7 June 1990 |
22 March 1991 |
| Last election |
3 seats, 6.1% |
8 seats, 15.1% |
| Seats won |
6 |
0 |
| Seat change |
3 |
8 |
| Popular vote |
144,640 |
43,112 |
| Percentage |
9.7% |
2.9% |
| Swing |
3.6 pp |
12.2 pp |
|
|
|
The 1991 Madrid City Council election was held on Sunday, 26 May 1991, to elect the 4th Madrid City Council, the unicameral local legislature of the municipality of Madrid. At stake were all seats in the City Council, determining the Mayor of Madrid. The number of members increased from 55 to 57 compared to the previous election.
The People's Party (PP), People's Alliance new electoral brand, went on to win a City Council election in Madrid for the first time with an absolute majority of seats. The Spanish Socialist Workers' Party (PSOE) continued its decline in the city and lost 3 seats and around 150,000 votes, while United Left (IU) recovered from its 1987 debacle and, for the first time since 1979, increased in seats and votes. The ruling Democratic and Social Centre (CDS), whose local leader Agustín Rodríguez Sahagún had announced his intention not to run for re-election, all but disappeared from the Council after failing to meet the required 5% threshold.
As a result of the election, José María Álvarez del Manzano was elected Mayor unopposed, a post he would retain until 2003, becoming the longest-serving democratically-elected Mayor of Madrid.
Electoral system
The number of seats in the Madrid City Council was determined by the population count. According to the municipal electoral law, the population-seat relationship on each municipality was to be established on the following scale:
| Inhabitants |
Seats |
| <250 |
5 |
| 251–1,000 |
7 |
| 1,001–2,000 |
9 |
| 2,001–5,000 |
11 |
| 5,001–10,000 |
13 |
| 10,001–20,000 |
17 |
| 20,001–50,000 |
21 |
| 50,001–100,000 |
25 |
Additionally, for populations greater than 100,000, 1 seat was to be added per each 100,000 inhabitants or fraction, according to the most updated census data, and adding 1 more seat if the resulting seat count gives an even number. As the updated population census for the 1991 election was 3,120,732, the Madrid City Council size was set to 57 seats.
All City Council members were elected in a single multi-member district, consisting of the Madrid municipality, using the D'Hondt method and a closed-list proportional representation system. Voting was on the basis of universal suffrage in a secret ballot. Only lists polling above 5% of valid votes in all of the municipality (which include blank ballots—for none of the above) were entitled to enter the seat distribution.
The Spanish municipal electoral law established a clause stating that, if no candidate was to gather an absolute majority of votes to be elected as mayor of a municipality, the candidate of the most-voted party would be automatically elected to the post.[2]
Results
← Summary of the 26 May 1991 Madrid City Council election results →
| |
| Party |
Vote |
Seats |
| Votes |
% |
±pp |
Won |
+/− |
|
People's Party (PP)[lower-alpha 1] |
702,834 | 47.24 | 13.25 |
30 | 10 |
|
Spanish Socialist Workers' Party (PSOE) |
510,556 | 34.32 | 6.15 |
21 | 3 |
|
United Left (IU) |
144,640 | 9.72 | 3.61 |
6 | 3 |
| |
|
Democratic and Social Centre (CDS) |
43,112 | 2.90 | 12.15 |
0 | 8 |
|
Ruiz-Mateos Group (ARM) |
23,404 | 1.57 | New |
0 | ±0 |
|
The Greens (LV) |
18,947 | 1.27 | 0.59 |
0 | ±0 |
|
The Ecologists (LE) |
5,051 | 0.34 | New |
0 | ±0 |
|
Green Union (UVE) |
4,335 | 0.29 | New |
0 | ±0 |
|
Workers' Socialist Party (PST) |
2,949 | 0.20 | New |
0 | ±0 |
|
Madrilian Independent Regional Party (PRIM) |
2,610 | 0.18 | New |
0 | ±0 |
|
Party of Madrid (PAM) |
2,393 | 0.16 | New |
0 | ±0 |
|
Spanish Falange of the JONS (FE-JONS) |
1,962 | 0.13 | 0.15 |
0 | ±0 |
|
Citizen Independent Group Gray Panthers (IND/1 28079) |
1,745 | 0.12 | New |
0 | ±0 |
| Parties with less than 0.1% of the vote |
5,504 |
0.37 |
– |
0 |
±0 |
|
Revolutionary Workers' Party of Spain (PORE) |
859 | 0.06 | 0.01 |
0 | ±0 |
|
Left Platform (PI) |
740 | 0.05 | New |
0 | ±0 |
|
Alliance for the Republic (AR) |
728 | 0.05 | New |
0 | ±0 |
|
Independent Spanish Falange (FEI) |
605 | 0.04 | New |
0 | ±0 |
|
Spanish Catholic Movement (MCE) |
581 | 0.04 | New |
0 | ±0 |
|
Communal Land (TC) |
563 | 0.04 | New |
0 | ±0 |
|
United Republican Action (ARU) |
534 | 0.04 | New |
0 | ±0 |
|
Carlist Party (PC) |
341 | 0.02 | 0.28 |
0 | ±0 |
|
Generational Integration (IG) |
295 | 0.02 | New |
0 | ±0 |
|
Political Natural Power Party (PPNP) |
258 | 0.02 | New |
0 | ±0 |
|
Blank ballots |
18,055 | 1.21 | 0.18 |
|
| |
| Total |
1,487,702 | 100.00 | |
57 | 2 |
| |
| Valid votes |
1,487,702 | 99.63 | 0.75 |
|
| Invalid votes |
5,520 | 0.37 | 0.75 |
| Votes cast / turnout |
1,493,222 | 59.14 | 10.92 |
| Abstentions |
1,031,725 | 40.86 | 10.92 |
| Registered voters |
2,524,947 | |
| |
| Source: Ministry of the Interior |
| Vote share |
|---|
|
|
|
|
|
| PP |
|
47.24% |
| PSOE |
|
34.32% |
| IU |
|
9.72% |
| CDS |
|
2.90% |
| ARM |
|
1.57% |
| LV |
|
1.27% |
| Others |
|
1.77% |
| Blank ballots |
|
1.21% |
| City council seats |
|---|
|
|
|
|
|
| PP |
|
52.63% |
| PSOE |
|
36.84% |
| IU |
|
10.53% |
Notes
References