matplotlib
|
| |
|
Screenshot of matplotlib plots and code | |
| Original author(s) | John D. Hunter |
|---|---|
| Developer(s) | Michael Droettboom, et al. |
| Initial release | 2003[1] |
| Stable release | 1.5.3 (8 September 2016) [±] |
| Repository |
github |
| Written in | Python |
| Operating system | Cross-platform |
| Type | Plotting |
| License | matplotlib license |
| Website |
matplotlib |
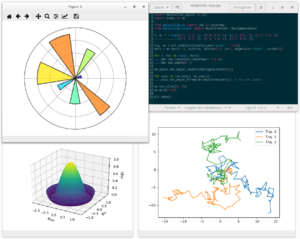
matplotlib is a plotting library for the Python programming language and its numerical mathematics extension NumPy. It provides an object-oriented API for embedding plots into applications using general-purpose GUI toolkits like wxPython, Qt, or GTK+. There is also a procedural "pylab" interface based on a state machine (like OpenGL), designed to closely resemble that of MATLAB. SciPy makes use of matplotlib.
matplotlib was originally written by John D. Hunter, has an active development community,[2] and is distributed under a BSD-style license. Michael Droettboom was nominated as matplotlib's lead developer shortly before John Hunter's death in 2012.[3]
As of 30 October 2015, matplotlib 1.5.x supports Python versions 2.7 through 3.5. Matplotlib 1.2 is the first version of matplotlib to support Python 3.x. Matplotlib 1.4 is the last version of matplotlib to support Python 2.6.[4]
Comparison with MATLAB
The pylab interface makes matplotlib easy to learn for experienced MATLAB users, making it a viable alternative to MATLAB as a teaching tool for numerical mathematics and signal processing.
Some of the advantages of the combination of Python, NumPy, and matplotlib over MATLAB include:
- Based on Python, a full-featured modern object-oriented programming language suitable for large-scale software development
- Free, open source, no license servers
- Native SVG support
Typically pylab is imported to bring NumPy and matplotlib into a single global namespace for the most MATLAB like syntax, however a more explicit import style, which names both matplotlib and NumPy, is the preferred coding style.[5]
Comparison with Gnuplot
Both gnuplot and matplotlib are mature open-source projects. They both can produce many types of different plots. While it is hard to specify a type of figure that one can do and the other can not, they still have different advantages and disadvantages:
| Advantages | Disadvantages | |
|---|---|---|
| Matplotlib |
|
|
| Gnuplot |
|
|
Examples
Line plot
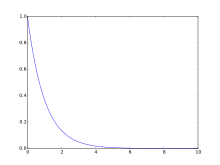
>>> import matplotlib.pyplot as plt
>>> import numpy as np
>>> a = np.linspace(0,10,100)
>>> b = np.exp(-a)
>>> plt.plot(a,b)
>>> plt.show()
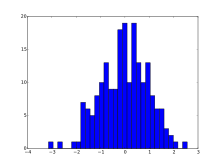
>>> import matplotlib.pyplot as plt
>>> from numpy.random import normal,rand
>>> x = normal(size=200)
>>> plt.hist(x,bins=30)
>>> plt.show()
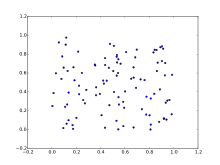
>>> import matplotlib.pyplot as plt
>>> from numpy.random import rand
>>> a = rand(100)
>>> b = rand(100)
>>> plt.scatter(a,b)
>>> plt.show()
3D plot
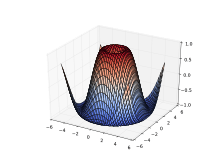
>>> from matplotlib import cm
>>> from mpl_toolkits.mplot3d import Axes3D
>>> import matplotlib.pyplot as plt
>>> import numpy as np
>>> fig = plt.figure()
>>> ax = fig.gca(projection='3d')
>>> X = np.arange(-5, 5, 0.25)
>>> Y = np.arange(-5, 5, 0.25)
>>> X, Y = np.meshgrid(X, Y)
>>> R = np.sqrt(X**2 + Y**2)
>>> Z = np.sin(R)
>>> surf = ax.plot_surface(X, Y, Z, rstride=1, cstride=1, cmap=cm.coolwarm)
>>> plt.show()
More examples
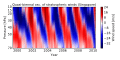 Image plot
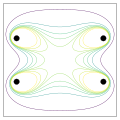 Contour plot
 Scatter plot
 Polar plot
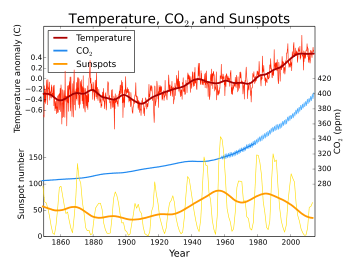 Line plot
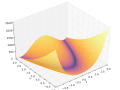 3-D plot
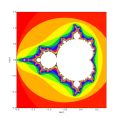 Image plot
Toolkits
Several toolkits are available which extend matplotlib functionality. Some are separate downloads, others ship with the matplotlib source code but have external dependencies.[6]
- Basemap: map plotting with various map projections, coastlines, and political boundaries[7]
- Cartopy: a mapping library featuring object-oriented map projection definitions, and arbitrary point, line, polygon and image transformation capabilities.[8] (matplotlib v1.2 and above)
- Excel tools: utilities for exchanging data with Microsoft Excel
- GTK tools: interface to the GTK+ library
- Qt interface
- Mplot3d: 3-D plots
- Natgrid: interface to the natgrid library for gridding irregularly spaced data.
- matplotlib2tikz: export to Pgfplots for smooth integration into LaTeX documents[9]
Related projects
- Biggles[10]
- Chaco[11]
- DISLIN
- GNU Octave
- Gnuplot-py[12]
- PLplot – Python bindings available
- PyCha[13] – libcairo implementation
- PyPlotter[14] – compatible with Jython
- Pyx[15]
- ReportLab
- SageMath – uses matplotlib to draw plots
- SciPy (modules plt and gplt)
- wxPython (module wx.lib.plot.py)
- Plotly – for interactive, online matplotlib and Python graphs
References
- ↑ "Copyright Policy".
- ↑ "Matplotlib github stats". matplotlib.org.
- ↑ "Announcing Michael Droettboom as the lead matplotlib developer". matplotlib.org.
- ↑ "What's new in matplotlib". Retrieved 2015-10-09.
- ↑ "Matplotlib coding styles". matplotlib.org.
- ↑ "Toolkits". matplotlib.org.
- ↑ Whitaker, Jeffrey. "The Matplotlib Basemap Toolkit User's Guide (v. 1.0.5)". Matplotlib Basemap Toolkit documentation. Retrieved 24 April 2013.
- ↑ Elson, Philip. "Cartopy". Retrieved 24 April 2013.
- ↑ Schlömer, Nico. "matplotlib2tikz". Retrieved 7 November 2016.
- ↑ "Bigglessimple, elegant python plotting". biggles.sourceforge.net. Retrieved 24 November 2010.
- ↑ "Chaco". code.enthought.com.
- ↑ "Gnuplot.py on". gnuplot-py.sourceforge.net. Retrieved 24 November 2010.
- ↑ "PyCha". bitbucket.org.
- ↑ "PyPlotter".
- ↑ "PyX". pyx.sourceforge.net.
External links
| Wikimedia Commons has media related to Matplotlib. |