Minersville Area School District
| Minersville Area School District | |
|---|---|
 | |
| Address | |
|
1 Battlin' Miner Drive, PO Box 787 Minersville, Pennsylvania, Schuylkill County 17954 United States of America | |
| Information | |
| Type | Public |
| School board | 9 elected members |
| Superintendent | Mr Carl G McBreen contract October 12, 2013 to October 11, 2016[1] Salary $93,000 (2013) [2] |
| Administrator |
Mrs Jennifer C Laudeman, Business Manager salary $73,300 (2013) |
| Principal | JAMES M GRABUSKY, JHSHS salary $70,000 (2013) |
| Principal | James A Yaccobacci, MAES & ECEC salary $76,000 (2013) |
| Staff | 76 non teaching staff members (2013) |
| Faculty | 84 (2013)[3] |
| Grades | preK-12 |
| Age | 4 years old preschool to 21 years special education |
| Pupils |
1,218 pupils (2015)[4] |
| • Kindergarten | 95 (2014),[7] 127 (2010) |
| • Grade 1 | 105 (2014), 94 |
| • Grade 2 | 88 (2014), 84 |
| • Grade 3 | 101 (2014), 93 |
| • Grade 4 | 82 (2014), 63 |
| • Grade 5 | 86 (2014), 99 |
| • Grade 6 | 80 (2014), 86 |
| • Grade 7 | 90 (2014), 89 |
| • Grade 8 | 88 (2014), 91 |
| • Grade 9 | 80 (2014), 105 |
| • Grade 10 | 116 (2014), 96 |
| • Grade 11 | 71 (2014), 97 |
| • Grade 12 | 92 (2014), 64 (2010) |
| • Other | 44 (2014) |
| Language | English |
| Budget |
$17,980,686 (2016-17)[8] |
| Per pupil spending |
$11,927 (2008) |
| Website | http://www.battlinminers.com/ |
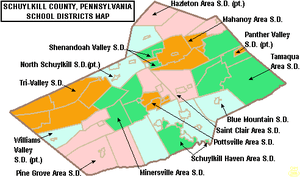
The Minersville Area School District is a small, rural public school district in Schuylkill County, Pennsylvania. It is centered on the borough of Minersville and also serves Branch Township, Cass Township, Foster Township, and Reilly Township. The district encompasses approximately 55 square miles. According to 2000 federal census data, it served a resident population of 10,732 people. By 2010, the District's population declined to 9, 168 people.[13] The educational attainment levels for the Minersville Area School District population (25 years old and over) were 87.6% high school graduates and 12.2% college graduates.[14] The District is one of the 500 public school districts of Pennsylvania.
According to the Pennsylvania Budget and Policy Center, 47.1% of the District's pupils lived at 185% or below the Federal Poverty Level as shown by their eligibility for the federal free or reduced price school meal programs in 2012.[15] In 2009, Minersville Area School District residents’ per capita income was $15,544, while the median family income was $38,655.[16] In the Commonwealth, the median family income was $49,501 [17] and the United States median family income was $49,445, in 2010.[18] In Schuylkill County, the median household income was $45,012.[19] By 2013, the median household income in the United States rose to $52,100.[20] In 2014, the median household income in the USA was reported as $53,700.[21]
Minersville Area School District operates: Early Childhood Education Center (a publicly funded preschool and full day kindergarten), Minersville Area Elementary Center (1st-6th) and Minersville Area Junior Senior High School (7th-12). High school students may choose to attend the Schuylkill Technology Centers for training in the construction and mechanical trades. The Schuylkill Intermediate Unit IU29 provides the District with a wide variety of services like: specialized education for disabled students; state mandated training on recognizing and reporting child abuse; speech and visual disability services; criminal background check processing for prospective employees and professional development for staff and faculty.
Governance
Minersville Area School District is governed by a 9-member board that is elected to serve four-year terms, the Pennsylvania State Board of Education, the Pennsylvania Department of Education and the Pennsylvania General Assembly.[22][23] The federal government controls programs it funds like Title I funding for low-income children in the Elementary and Secondary Education Act and President George W. Bush's No Child Left Behind Act (renamed Every Student Succeeds Act (ESSA) in December 2015) which mandates the district focus its resources on student success in acquiring reading and math skills.[24] The school board is required by state law to post a financial report on the district in its website by March of each school year.[25] Minersville Area School district has not posted its financial information in its website as mandated by state law.[26]
The Superintendent and Business Manager are appointed by the Minersville Area School Board. The Superintendent is the chief administrative officer with overall responsibility for all aspects of operations, including education and finance. The Business Manager is responsible for budget and financial operations. Neither of these officials are voting members of the School Board. The School Board enters into individual employment contracts for these positions. These contracts must be in writing and are subject to public discloure under the state's Right to Know Act. In Pennsylvania, public school districts are required to give 150 days notice to the Superintendent and Business Manager regarding renewal of their employment contracts.[27] Pursuant to Act 141 of 2012 which amended the Pennsylvania School Code, all school districts that have hired superintendents on/after the fall of 2012 are required to develop objective performance standards and post them on the district's website.[28]
The Commonwealth Foundation for Public Policy Alternatives Sunshine Review gave the school board and district administration a "F" for transparency based on a review of "What information can people find on their school district's website". It examined the school district's website for information regarding; taxes, the current budget, meetings, school board members names and terms, contracts, audits, public records information and more.[29]
In 1940, the District won a Supreme Court decision - Minersville School District v. Gobitis regarding forcing students to pledge the American flag.
Academic achievement
In October 2015, Pennsylvania Auditor General Eugene DePasquale reported that one school in the Minersville Area School District was among the 561 academically challenged schools that have been overlooked by the Pennsylvania Department of Education.[30][31] He also reported the Pennsylvania Department of Education failed to take any action to remediate the poorly performing schools to raise student academic achievement or to provide them with targeted professional assistance.[32] Minersville Area Junior Senior HIgh School was on the list.
- Statewide academic ranking
In 2015, Minersville Area District's ranking declined to 437th out of 493 Pennsylvania school districts, in 2015, by the Pittsburgh Business Times.[33] The ranking is based on the last 3 years of student academic achievement as demonstrated by PSSAs results in: reading, writing, math and science and the three Keystone Exams (literature, Algebra 1, Biology I) in high school.[34] Three school districts were excluded because they do not operate high schools (Saint Clair Area School District (in Schuylkill County), Midland Borough School District, Duquesne City School District). The PSSAs are given to all children in grades 3rd through 8th. Adapted PSSA examinations are given to children in the special education programs. Writing exams were given to children in 5th and 8th grades.[35]
|
- Overachievers ranking
In 2010, the Pittsburgh Business Times reported an Overachievers Ranking for 498 Pennsylvania school districts. Minersville Area ranked 324th. In 2009 the district was 299th. The paper describes the ranking as: "a ranking answers the question - which school districts do better than expectations based upon economics? This rank takes the Honor Roll rank and adds the percentage of students in the district eligible for free and reduced-price lunch into the formula. A district finishing high on this rank is smashing expectations, and any district above the median point is exceeding expectations."[41]
District AYP status history
In 2012, Minersville Area School District declined to Warning Adequate Yearly Progress (AYP) status.[42] In 2011, Minersville Area School District achieved Adequate Yearly Progress (AYP). In 2011, 94 percent of the 500 Pennsylvania public school districts achieved the No Child Left Behind Act progress level of 72% of students reading on grade level and 67% of students demonstrating on grade level math. In 2011, 46.9 percent of Pennsylvania school districts achieved Adequate Yearly Progress (AYP) based on student performance. An additional 37.8 percent of Pennsylvania public school districts made AYP based on a calculated method called safe harbor, 8.2 percent on the growth model and 0.8 percent on a two-year average performance.[43][44] Minersville Area School District achieved AYP status each year from 2004 to 2010, while in 2003 the Minersville Area School District was in Warning status due to lagging student achievement.[45]
Minersville Area School District's School was cited in a state report regarding irregularities in the PSSA testing at Minersville Area Elementary Center.[46][47] After an investigation, Minersville Area School District was notified that their investigation was closed with no further action.[48][49] The scandal called into question much of the student academic growth touted by the Rendell Administration which conspicuously ignored the Data Recognition Corp. forensic erasure analysis.[50][51]
Graduation rate
In 2015, Minersville Area School District's graduation rate was 89%.[52]
- 2014 - 93.9%[53]
- 2013 - 84.6%[54]
- 2012 - 88.7%[55]
- 2011 - 84.8%[56]
- 2010 - 88.7%, the Pennsylvania Department of Education issued a new, 4-year cohort graduation rate.[57]
- According to traditional graduation rate calculations
Junior/senior high school
Minersville Area Junior Senior High School is located at Battlin Miner Drive. In 2015, enrollment was reported as 537 pupils in 7th through 12th grades, with 40% of pupils eligible for a free lunch due to the family meeting the federal federal poverty level. Additionally, 17.5% of pupils received special education services, while 0.5% of pupils were identified as gifted.[62] The school employed 39 teachers.[63] Per the Pennsylvania Department of Education, 2% of the teachers were rated "Non‐Highly Qualified" under the federal No Child Left Behind Act.[64]
According to the National Center for Education Statistics, in 2013, the school reported an enrollment of 547 pupils in grades 7th through 12th, with 241 pupils eligible for a federal free or reduced price lunch due to the family meeting the federal poverty level. In 2013, the School employed 39 teachers yielding a student-teacher ratio of 13:1.[65] According to a report by the Pennsylvania Department of Education, multiple teachers were rated "Non‐Highly Qualified" under No Child Left Behind.[66]
- 2015 School Performance Profile
Minersville Area Junior Senior High School achieved a score of 56.4 out of 100. Reflects on grade level reading, mathematics and science achievement. The PDE reported that just 61% of the High School's students were on grade level in reading/literature. In Algebra 1, 55.8% of students showed on grade level skills at the end of the course. In Biology I, 53% demonstrated on grade level science understanding at the end of the course.[67] Statewide, 53 percent of schools with an eleventh grade achieved an academic score of 70 or better. Five percent of the 2,033 schools with 11th grade were scored at 90 and above; 20 percent were scored between 80 and 89; 28 percent between 70 and 79; 25 percent between 60 and 69 and 22 percent below 60. The Keystone Exam results showed: 73 percent of students statewide scored at grade-level in English, 64 percent in Algebra I and 59 percent in biology.[68][69]
- 2014 School Performance Profile
Minersville Area Junior Senior High School achieved 64.9 out of 100. Reflects on grade level reading, mathematics and science achievement. In reading/literature, 73% were on grade level. In Algebra 1, only 62% showed on grade level skills. In Biology, just 38% demonstrated on grade level science understanding at the end of the course.[70][71] Statewide, the percentage of high school students who scored proficient and advanced in Algebra I increased to 39.7% to 40.1%. The percentage of high school students who scored proficient and advanced in reading/literature declined to 52.5%. The percentage of high school students who scored proficient and advanced in biology improved from 39.7% to 41.4%.[72]
According to the Pennsylvania Department of Education, 2,134 of 2,947 Pennsylvania public schools (72 percent of Pennsylvania public schools), achieved an academic score of 70 or higher.[73] Fifty-three percent of schools statewide received lower SPP scores compared with last year's, while 46 percent improved. A handful were unchanged.[74][75]
Compared with 2013, the percentage of schools that earned below 60 declined by nearly 1 percent per Secretary of Education Carolyn Dumaresq. She reported that this is an indication that student achievement is improving as school resources are being used better.[76]
- 2013 School Performance Profile
Minersville Area Junior Senior High School achieved 68.4 out of 100. Reflects on grade level reading, mathematics and science achievement. In reading/literature - 68.8% were on grade level. In Algebra 1, 66.9% showed on grade level skills. In Biology, 60.99% showed on grade level science understanding.[77] According to the Pennsylvania Department of Education, 2,181 public schools (less than 73 percent of Pennsylvania public schools), achieved an academic score of 70 or higher. Pennsylvania 11th grade students no longer take the PSSAs. Instead, beginning in 2012, they take the Keystone Exams at the end of the associated course.[78]
- AYP History
In 2012, Minersville Area junior Senior High School declined further to School Improvement I Adequate Yearly Progress (AYP) status due to missing all academic metrics measured and a low grad rate. The administration was required to develop a plan to raise student achievement and to submit it to the Pennsylvania Department of Education for approval.[79] Effective with Spring 2013, the Pennsylvania Department of Education discontinued administering the PSSA's to 11th graders. AYP status was no longer reported.
- 2011 - declined to 'Warning AYP status due to lagging academic achievement.[80]
- 2006 - 2010 - achieved AYP status.[81]
- 2005 - Making Progress School Improvement level I AYP status[82]
- 2004 - declined to School Improvement level I AYP status[83]
- 2003 - Warning AYP status due to lagging student achievement[84]
- PSSA Results
Pennsylvania System of School Assessments, commonly called PSSAs are No Child Left Behind Act related examinations which were administered from 2003 through 2012, in all Pennsylvania public high schools. The exams were administered in the Spring of each school year. The goal was for 100% of students to be on grade level or better in reading and mathematics, by the Spring of 2014. The tests focused on the state's Academic Standards for reading, writing, mathematics and science. The Science exam included content in science, technology, ecology and the environmental studies. The mathematics exam included: algebra I, algebra II, geometry and trigonometry. The standards were first published in 1998 and are mandated by the Pennsylvania State Board of Education.[85]
In 2013, the Commonwealth of Pennsylvania changed its high school assessments to the Keystone Exams in Algebra 1, Reading/literature and Biology1. The exams are given at the end of the applicable course, rather than all in the spring of the student's 11th grade year.[86] The state announced the change in 2010 and made it in order to comply with Governor Edward G. Rendell's agreement to change to the national Common Core standards.[87]
- 11th Grade Reading
2010 - 63% on grade level. In Pennsylvania, 67% of 11th graders on grade level.[88] (101 pupils)
2009 - 52%, State - 65% [89](70 pupils)
2008 - 52%, State - 65% (78 pupils) [90]
2007 - 62%, State - 65% (94 pupils)
11th Grade Math:
2010 - 52% on grade level. In Pennsylvania, 59% of 11th graders are on grade level.
2009 - 44%, State - 56%[91]
2008 - 39%, State - 56%
2007 - 53%, State - 53%[92]
11th Grade Science:
2010 - 30% on grade level. State - 39% of 11th graders were on grade level.[93]
2009 - 33%, State - 40%
2008 - 30%, State - 39%[94]
College remediation: According to a Pennsylvania Department of Education study released in January 2009, 33% of Minersville Area High School graduates required remediation in mathematics and or reading before they were prepared to take college level courses in the Pennsylvania State System of Higher Education or community colleges.[95] Less than 66% of Pennsylvania high school graduates, who enroll in a four-year college in Pennsylvania, will earn a bachelor's degree within six years. Among Pennsylvania high school graduates pursuing an associate degree, only one in three graduate in three years.[96] Per the Pennsylvania Department of Education, one in three recent high school graduates who attend Pennsylvania's public universities and community colleges takes at least one remedial course in math, reading or English.
Graduation requirements
Minersville Area School District requires students to complete 24 credits in grades 9 through 12, 6.0 credits in Grade 12, and 20 hours of community service by the end of Grade 11. English 4 credits, History 4 credits, Math 3 credits, Science 3 credits, Physical education 1 credits, Health 0.5 credits, 8.5 credits. All students must take English, Math, Science, History, and Physical Education every year.[97]
Graduation project - By law, all Pennsylvania secondary school students must complete a project as a part of their eligibility to graduate from high school. The type of project, its rigor and its expectations are set by the individual school district.[98] Effective with the graduating class of 2017, the Pennsylvania State Board of Education eliminated the state mandate that students complete a culminating project in order to graduate.[99]
By Pennsylvania School Board regulations, for the graduating classes of 2019,[100] students must demonstrate successful completion of secondary level course work in Algebra I, Biology I, English Composition, and Literature by passing the Keystone Exams.[101][102][103] The exam is given at the end of the course. Keystone Exams have replaced the PSSAs for 11th grade.[104]
Students have several opportunities to pass the exam. Schools are mandated to provide targeted assistance to help the student be successful. Those who do not pass after several attempts can perform a project in order to graduate.[105][106] For the class of 2019, a Composition exam will be added. For the class of 2020, passing a civics and government exam will be added to the graduation requirements.[107] In 2011, Pennsylvania high school students field tested the Algebra 1, Biology and English Lit exams. The statewide results were: Algebra 1 38% on grade level, Biology 35% on grade level and English Lit - 49% on grade level.[108] Individual student, school or district reports were not made public, although they were reported to district officials by the Pennsylvania Department of Education. Students identified as having special needs and qualifying for an Individual Educational Program (IEP) may graduate by meeting the requirements of their IEP.
Dual enrollment
The high school does not offer the Pennsylvania dual enrollment program which permits students to earn deeply discounted college credits with the assistance of a state grant.[109] Over 400 school districts in Pennsylvania offer their high school juniors and seniors the dual enrollment program.[110]
SAT scores
In 2015, 59 Minersville Area School District students took the SAT exams. The District's Verbal Average Score was 461. The Math average score was 471. The Writing average score was 447.[111] The College Board also reported that statewide 96,826 pupils took the exams with average scores declining in all three measurers to: 495 in reading, 511 in math and 484 in writing.[112]
In 2014, 51 Minersville Area School District students took the SAT exams. The District's Verbal Average Score was 450. The Math average score was 476. The Writing average score was 433.[113][114] Statewide in Pennsylvania, Verbal Average Score was 497. The Math average score was 504. The Writing average score was 480. The College Board reported that nationwide scores were: 497 in reading, 513 in math and 487 in writing.[115] In 2014, 1,672,395 students took the SATs in the United States.
In 2013, 56 Minersville Area School District students took the SAT exams. The District's Verbal Average Score was 470. The Math average score was 485. The Writing average score was 439. The College Board reported that statewide scores were: 494 in reading, 504 in math and 482 in writing. The nationwide SAT results were the same as in 2012.[116]
n 2012, 55 Minersville Area School District students took the SAT exams. The District's Verbal Average Score was 478. The Math average score was 499. The Writing average score was 462. The statewide Verbal SAT exams results were: Verbal 491, Math 501, Writing 480. In the USA, 1.65 million students took the exams achieving scores: Verbal 496, Math 514, Writing 488. According to the College Board the maximum score on each section was 800, and 360 students nationwide scored a perfect 2,400.
In 2011, 61 Minersville Area School District students took the SAT exams. The District's Verbal Average Score was 465. The Math average score was 470. The Writing average score was 420.[117] Pennsylvania ranked 40th among states with SAT scores: Verbal - 493, Math - 501, Writing - 479.[118] In the United States, 1.65 million students took the exam in 2011. They averaged 497 (out of 800) verbal, 514 math and 489 in writing.[119]
The Center for Rural Pennsylvania, a research arm of the Pennsylvania General Assembly, compared the SAT data of students in rural areas of Pennsylvania to students in urban areas. From 2003 to 2005, the average total SAT score for students in rural Pennsylvania was 992, while urban students averaged 1,006. During the same period, 28 percent of 11th and 12th graders in rural school districts took the exam, compared to 32 percent of urban students in the same grades. The average math and verbal scores were 495 and 497, respectively, for rural students, while urban test-takers averaged 499 and 507, respectively. Pennsylvania's SAT composite score ranked low on the national scale in 2004. The composite SAT score of 1,003 left Pennsylvania ranking 44 out of the 50 states and Washington, DC.[120]
AP Courses
In 2015, Minersville Area Senior High School offered 3 Advanced Placement (AP) courses at a higher cost than regular courses. The fee for each AP Exam is $91 (2014).[121] The school normally retains $9 of that fee as a rebate to help with administrative costs. In 2012, the fee was $89 per test per pupil. Students have the option of taking College Board approved courses and then taking the College Board's examination in the Spring. Students, who achieve a 3 or better on the exam, may be awarded college credits at US universities and colleges. Each higher education institution sets its own standards about what level of credits are awarded to a student based on their AP exam score. Most higher education give credits for scores of 4 or 5. Some schools also give credits for scores of 3. High schools give credits towards graduation to students who take the school's AP class. At Minersville Area Senior High School just 12% of the students who took an AP course earned a 3 or better on the exam.[122]
Junior high school achievement
Seventh grades have been tested in reading and mathematics since 2006. Eighth graders are tested in: reading, writing, mathematics and science. Beginning in the Spring of 2013, eighth graders, who are enrolled in Algebra I take the Keystone Exam for Algebra I at the end of the course. The testing of 8th grade in reading and mathematics began in 1999, as a state initiative.[123] Testing in science began in 2007. The goal is for 100% of students to be on grade level or better in reading and mathematics, by the Spring of 2014. The tests focus on the state's Academic Standards for reading, writing, mathematics and science.[124] The standards were published in 1998 and are mandated by the Pennsylvania State Board of Education.[125] In 2014, the Commonwealth of Pennsylvania adopted the Pennsylvania Core Standards - Mathematics.[126]
- 2015 School Performance Profile
The PDE withheld SPP scores. It was reported that 57% of 8th grade students at the Junior HIgh School students were on grade level in reading on the PSSAs given in April 2015. In math/Algebra 1, just 11% of 8th grade students showed on grade level skills. In science, 56% of the school's 8th graders demonstrated on grade level science understanding. No eighth grade writing scores were reported. In 7th grade, 51% were on grade level in reading, while just 36% showed on grade level math skills.[127] Statewide 58% of eighth (8th) graders were on grade level in reading, while 29% demonstrated on grade level math skills. Pennsylvania 7th graders were 58% on grade level in reading and 33% demonstrated on grade level math skills.[128]
- 8th Grade Reading
- 2012 - 74% on grade level (5% below basic). In Pennsylvania, 79% of 8th graders on grade level.[129]
- 2011 - 87% (9% below basic) State - 81.8%[130]
- 2010 - 84%, State - 81%[131]
- 2009 - 76%, State - 80% (92 pupils)
- 2008 - 75%, State - 78%
- 2007 - 74%, State - 75% (95 pupils)[132]
- 8th Grade Math
- 2012 - 62%% on grade level (11% below basic). State - 76% [133]
- 2011 - 66% (11% below basic). State - 76.9%
- 2010 - 65%, State - 75%
- 2009 - 48%, State - 71%
- 2008 - 69%, State - 70%[134]
- 2007 - 70%, State - 67%
- 8th Grade Science
- 2012 - 57% on grade level (29% below basic). State - 59%[135]
- 2011 - 57% (21% below basic). State - 58.3%
- 2010 - 66%, State - 57%
- 2009 - 51%, State: - 54%
- 2008 - 50%, State - 52%[136]
- 7th Grade Reading
- 2012 - 73% (12% below basic). State - 76%
- 2011 - 79% (8% below basic). State - 76%
- 2010 - 74%. State - 73% (91 pupils)
- 2009 - 70%. State - 71.7% (86 pupils)
- 7th Grade Math
- 2012 - 84% (6% below basic). State - 80%
- 2011 - 81% (9% below basic). State - 78.6%
- 2010 - 80%. State - 77%
- 2009 - 75%. State - 75%
- Dropout Early Warning System
In 2013, Minersville Area School District implemented a no local cost dropout prevention Early Warning System and Interventions Catalog at the junior high school.[137] The process identifies students at risk for dropping out by examining the pupil's: attendance, behavior and course grades. Interventions are implemented to assist at-risk pupils to remain in school. The program is funded by federal and private dollars.[138]
Elementary Center
Minersville Area Elementary Center is located at 300 North Fifth Street, Minersville. In 2015, the School's enrollment was 542 pupils in grades 1st through 6th, with 51.6% of pupils receiving a federal free or reduced price meals due to family poverty. Additionally, 20.5% of the pupils receive special education services, while 0.1% are identified as gifted.[139] According to a report by the Pennsylvania Department of Education, 100% of the teachers were rated highly qualified under No Child Left Behind.[140] The school was a federally designated Title I school.
According to the National Center for Education Statistics, in 2012, enrollment was 542 pupils in grades 1st through 6th, with 294 pupils receiving a free or reduced price lunch. The School employed 37 teachers yielding a student-teacher ratio of 14.7:1.[141] According to a report by the Pennsylvania Department of Education, 100% of its teachers were rated "Highly Qualified" under the federal No Child Left Behind Act.[142]
- 2015 School Performance Profile
According to the Pennsylvania Department of Education (PDE), 45% of 5th grade students at Minersville Area Elementary Center were on grade level in reading on the PSSAs given in April 2015. In mathematics, 25% of 5th grade students showed on grade level skills. No fifth grade writing scores were reported by the PDE. In 4th grade, 68% were on grade level in reading, while 26% showed on grade level math skills. In science, 75% of fourth graders showed on grade level understanding. Among third (3rd) graders, just 64% were on grade level in reading and 28% were on grade level in mathematics. Among 6th graders, 73% were on grade level in reading and just 28% were on grade level in mathematics.[143] Statewide 61.9% of fifth (5th) graders were on grade level in reading, while 42.8% demonstrated on grade level math skills. Pennsylvania 4th graders were 58.6% on grade level in reading and 44.4% demonstrated on grade level math skills. In science, 77.3% of fourth graders showed on grade level understanding. Among Pennsylvania third (3rd) graders, 62% were reading on grade level, while 48.5% demonstrated on grade level math skills.[144]
- 2014 School Performance Profile
Minersville Area Elementary Center achieved a score of 63.8 out of 100. The score reflects on grade level: reading, science, writing and mathematics achievement. In 2013-14, only 64% of the students were reading on grade level in grades 3rd through 6th. In 3rd grade, 75.6% of the pupils were reading on grade level. In math, 63% were on grade level (3rd-6th grades). In 4th grade science, just 63% of the pupils demonstrated on grade level understanding. In writing, only 50% of 5th grade pupils demonstrated on grade level skills.[145]
- 2013 School Performance Profile
Minersville Area Elementary Center achieved a score of 74 out of 100. The score reflects on grade level: reading, science, writing and mathematics achievement. In 2012-13, only 65% of the students were reading on grade level in grades 3rd through 6th. In 3rd grade, 68% of the pupils were reading on grade level. In math, 71% were on grade level (3rd-6th grades). In 4th grade science, 81% of the pupils demonstrated on grade level understanding. In writing, only 47.6% of 5th grade pupils demonstrated on grade level skills.[146] According to the Pennsylvania Department of Education, 2,181 public schools (less than 73 percent of Pennsylvania public schools), achieved an academic score of 70 or higher.
- AYP status history
In 2012, Minersville Area Elementary Center declined to Warning Adequate Yearly Progress (AYP) status, due to lagging academic achievement in reading and mathematics.[147][148]
- 2009-2011 - achieved AYP status each school year.
- 2008 - declined to Warning AYP status due to lagging student achievement in reading and math[149]
- 2003-2007 - achieved AYP status each school year.
- PSSA History
The 3rd graders take the PSSAs in math and reading. The fourth grade is tested in reading, math and science. The fifth grade is evaluated in reading, mathematics and writing. Sixth grade has been tested in reading and math since 2006. Pennsylvania System of School Assessments (PSSAs) are No Child Left Behind Act related examinations which were administered beginning 2003 to all Pennsylvania public school students in grades 3rd-8th.[150] The goal was for 100% of students to be on grade level or better in reading and mathematics, by the Spring of 2014.[151][152][153] The tests focused on the state's Academic Standards for reading, writing, mathematics and science. The Science exam is given to 4th grades and includes content in science, technology, ecology and the environmental studies.[154] The first cohort of children who attended Accountability Block Grant funded full-day kindergarten reached third grade and took the PSSAs in the spring of 2008.
|
6th Grade Math:
|
|
5th Grade Reading:
|
|
|
|
- 4th Grade Science
- 2012 - 85%, (5% below basic). State - 82%
- 2011 - 92%, (1% below basic). State - 82.9%
- 2010 - 75%. State - 81%
- 2009 - 90%. State - 83%
- 2008 - 80%. State - 81%
|
|
Early Childhood Education Center
The district provides both all-day kindergarten and a taxpayer-funded preschool for four-year-olds at a school called the Early Childhood Education Center.[160] The Center is located at 24 Llewellyn Road, Pottsville. In 2015 the School had 139 pupils in preschool and full day kindergarten,[161] with 40% of pupils receiving a federal free or reduced price meals due to family poverty. Additionally, 11.5% of the pupils receive special education services, while none are identified as gifted. According to a report by the Pennsylvania Department of Education, 100% of the teachers were rated highly qualified under No Child Left Behind. The school is a federally designated Title I school. The district has had a full-day kindergarten program in place since 1985 and added the Four-K program in 1990. Minersville Area School District does not use state PreK Counts funding to operate the preschool, relying on local taxes instead.[162][163]
In 2013, the school had 165 pupils with 60 pupils receiving a free or reduced price lunch due to poverty. The school employed 8 teachers.[164] The school was a Title I school. The school was opened in 1996.[165]
Minersville Area School District has provided full-day kindergarten for more than a decade.[166] and preschool.[167] Proponents of full day kindergarten claim it will reduce special education numbers and it will raise primary student academic achievement in reading.[168] Those outcomes have not been realized in the Minersville Area School District. Reading achievement in particular has actually declined.[169]
Special education
In December 2015, Minersville Area School District administration reported that 246 pupils or 20% of the district's pupils received Special Education services, with 44.7% of the identified students having a specific learning disability.[170]
In December 2012, the District administration reported that 253 pupils or 19.7% of the district's pupils received special education services, with 49.8% of the identified students having a specific learning disability.[171] In the 2010-2011 school year, the total student enrollment was more than 1.78 million students with approximately 275,000 students eligible for special education services. Among these students 18,959 were identified with mental retardation and 21,245 students with autism.[172] The largest group of students are identified as Specific Learning Disabilities 126,026 students (46.9 percent) and Speech or Language Impairments with 43,542 students (16.2 percent).[173]
In December 2009, the Minersville Area SD reported that 20% of the pupils received special education services.[174]
In 2007, then Pennsylvania Secretary of Education Gerald Zahorchak testified before the Pennsylvania House Education Committee regarding full day kindergarten. He claimed that districts which offered the program would see a significant decrease in special education students due to early identification and early intervention. He asserted the high cost of full day kindergarten would be recouped by Districts in lower special education costs.[175] School District has provided full day kindergarten since 2008. The District has seen no decrease in the percentage of special education students it serves, yielding no savings.
In order to comply with state and federal Individuals with Disabilities Education Act rules and regulations, the school district engages in identification procedures to ensure that eligible students receive an appropriate educational program consisting of special education and related services, individualized to meet student needs. At no cost to the parents, these services are provided in compliance with state and federal law; and are reasonably calculated to yield meaningful educational benefit and student progress.[176] To identify students who may be eligible for special education services, various screening activities are conducted on an ongoing basis. These screening activities include: review of group-based data (cumulative records, enrollment records, health records, report cards, ability and achievement test scores); hearing, vision, motor, and speech/language screening; and review by the Special Education administration.[177] When screening results suggest that the student may be eligible, the District seeks parental consent to conduct a multidisciplinary evaluation. Parents who suspect their child is eligible may verbally request a multidisciplinary evaluation from a professional employee of the District or contact the district's Special Education Department. By Pennsylvania law, the District has 60 calendar days, after receiving parental consent, to complete the evaluation.[178][179][180] The IDEA 2004 requires each school entity to publish a notice to parents, in newspapers or other media, including the student handbook and website regarding the availability of screening and intervention services and how to access them. This may be requested by the parent or teacher.
Students who have an Individual Education Plan (IEP) may take the PSSA-M an alternative math exam rather than the PSSA.[181] Some special education students may take the PASA (Pennsylvania Alternate System of Assessment), rather than the PSSA.[182] Schools are permitted to provide accommodations to some students.[183]
In 2010, the state of Pennsylvania provided $1,026,815,000 for special education services. The funds were distributed to districts based on a state policy which estimates that 16% of the district's pupils are receiving special education services. This funding is in addition to the state's basic education per pupil funding, as well as, all other state and federal funding.[184] IDEA funds are appropriated to the state on an annual basis and distributed through intermediate units (IUs) to school districts, while state funds are distributed directly to the districts. Total funds that are received by school districts are calculated through a formula. The Pennsylvania Department of Education oversees four appropriations used to fund students with special needs: Special Education; Approved Private Schools; Pennsylvania Chartered Schools for the Deaf and Blind; and Early Intervention. The Pennsylvania Special Education funding system assumes that 16% of the district's students receive special education services. It also assumes that each student's needs accrue the same level of costs.[185] Over identification of students, in order to increase state funding, has been an issue in the Commonwealth. Some districts have more than 20% of its students receiving special education services while others have 10% supported through special education.[186] The state requires each public school district and charter school to have a three-year special education plan to meet the unique needs of its special education students.[187] In 2012, the Obama Administration's US Department of Education issued a directive requiring schools include students with disabilities in extracurricular activities, including sports.[188]
Minersville Area School District received a $672,181 supplement for special education services in 2010.[189] For the 2011-12, 2012–13 and 2013-14 school years, all Pennsylvania public school districts received the same level of funding for special education that they received in 2010-11. This level funding was provided regardless of changes in the number of pupils who need special education services and regardless of the level of services the respective students required.[190][191]
- 2014-2015 school year, Minersville Area School District received an increase to $698,466 from the Commonwealth for special education funding.[192]
- 2016-17 school year, Minersville Area School District received a 3.4% increase in state special education funding to $755,177.[193]
In 2013, the state's Special Education Funding Reform Commission provided a report on the state of funding for special education in the Commonwealth.[194] Funding for special education programs is borne largely on a local basis at 60%, with the state contributing $1 billion or 30% and the federal government providing 10% of the funding.
Gifted education
The District Administration reported that less than 10 its students were identified as gifted in 2009.[195] By law, the district must provide mentally gifted programs at all grade levels. The primary emphasis is on enrichment and acceleration of the regular education curriculum through a push in model with the gifted instructor in the classroom with the regular instructor. This approach permits such specialized instructional strategies as tiered assignments, curriculum compacting, flexible grouping, learning stations, independent projects and independent contracts. Students identified as gifted attending the High School have access to honors and advanced placement courses, and dual enrollment with local colleges. The referral process for a gifted evaluation can be initiated by teachers or parents by contacting the student's building principal and requesting an evaluation. All requests must be made in writing. To be eligible for mentally gifted programs in Pennsylvania, a student must have a cognitive ability of at least 130 as measured on a standardized ability test by a certified school psychologist. Other factors that indicate giftedness will also be considered for eligibility.[196]
Wellness policy
Minersville Area School Board established a district wellness policy in 2006 - Policy 246.[197] The policy deals with nutritious meals served at school, the control of access to some foods and beverages during school hours, age appropriate nutrition education for all students, and physical education for students K-12. The policy is in response to state mandates and federal legislation (P.L. 108 - 265). The law dictates that each school district participating in a program authorized by the Richard B. Russell National School Lunch Act (42 U.S.C. 1751 et seq) or the Child Nutrition Act of 1966 (42 U.S.C. 1771 et seq) "shall establish a local school wellness policy by School Year 2006."
The legislation placed the responsibility of developing a wellness policy at the local level so the individual needs of each district can be addressed. According to the requirements for the Local Wellness Policy, school districts must set goals for nutrition education, physical activity, campus food provision, and other school-based activities designed to promote student wellness. Additionally, districts were required to involve a broad group of individuals in policy development and to have a plan for measuring policy implementation. Districts were offered a choice of levels of implementation for limiting or prohibiting low nutrition foods on the school campus. In final implementation these regulations prohibit some foods and beverages on the school campus.[198] The Pennsylvania Department of Education required the district to submit a copy of the policy for approval.
Minersville Area School District offers both a free school breakfast and a free or reduced-price lunch to children in low income families. All students attending the school can eat breakfast and lunch. Children from families with incomes at or below 130 percent of the federal poverty level are provided a breakfast and lunch at no cost to the family. Children from families with incomes between 130 and 185 percent of the federal poverty level can be charged no more than 30 cents per breakfast. A foster child whose care and placement is the responsibility of the State or who is placed by a court with a caretaker household is eligible for both a free breakfast and a free lunch. Runaway, homeless and Migrant Youth are also automatically eligible for free meals.[199] The meals are partially funded with federal dollars through the United States Department of Agriculture.[200]
In 2013, the USDA issued new restrictions to foods in public schools. The rules apply to foods and beverages sold on all public school district campuses during the day. They limit vending machine snacks to a maximum of 200 calories per item. Additionally, all snack foods sold at school must meet competitive nutrient standards, meaning they must have fruits, vegetables, dairy or protein in them or contain at least 10 percent of the daily value of fiber, calcium, potassium, and Vitamin D.[201] In order to comply with the Healthy, Hunger-Free Kids Act of 2010 all US public school districts are required to raise the price of their school lunches to $2.60 regardless of the actual cost of providing the lunch.[202] The Healthy Hunger-Free Kids Act of 2010 mandates that Districts raise their full pay lunch prices every year until the price of non-subsidized lunches equals the amount the federal government reimburses schools for free meals. That subsidy in 2013-2014 was $2.93. In 2015, federal reimbursement rates were: $3.07 per meal for students who are income-eligible for free lunches and $2.67 for those who qualify for a reduced price. School lunch participation nationally dropped from 31.6 million students in 2012 to 30.4 million in 2014, according to the federal Department of Agriculture. Pennsylvania statistics show school lunch participation dropped by 86,950 students in the same two years, from 1,127,444 in 2012 to 1,040,494 in 2014.[203]
In 2014, President Barack Obama ordered a prohibition of advertisements for unhealthy foods on public school campuses during the school day.[204][205] The US Department of Agriculture requires that students take milk as their beverage at lunch. In accordance with this law, any student requesting water in place of milk with their lunch must present a written request, signed by a doctor, documenting the need for water instead of milk.[206][207]
Minersville Area School District provides health services as mandated by the Commonwealth and the federal government. Nurses are available in each building to conduct annual health screenings (data reported to the PDE and state Department of Health) and to dispense prescribed medications to students during the school day. Students can be excluded from school unless they comply with all the State Department of Health's extensive immunization mandates. School nurses monitor each pupil for this compliance.[208][209] Nurses also monitor each child's weight.[210]
In 2016, the Pennsylvania Department of Health distributed to each Pennsylvania high school the overdose antidote drug naloxone in a nasal spray. School nurses were also provided with educational materials and training developed by the National Association of School Nurses.[211] The cost was covered by a grant from a private foundation.[212]
- Health eTools program
The District participated in Highmark Foundation's Healthy High 5 Health eTools for Schools grant which enabled mobile data collection of pertinent health and physical fitness screening data on students K-12 in a database held by InnerLink, Inc. in Lancaster, Pennsylvania.[213] Health eTools for Schools also provided interdisciplinary research-based curriculum in nutrition, physical education and physical activity to participating districts. The program was discontinued by the company in 2013.[214]
Budget
Pennsylvania public school districts budget and expend funds according to procedures mandated by the General Assembly and the Pennsylvania Department of Education (PDE). An annual operating budget is prepared by school district administrative officials. A uniform form is furnished by the PDE and submitted to the board of school directors for approval prior to the beginning of each fiscal year on July 1.
Under Pennsylvania's Taxpayer Relief Act, Act 1 of the Special Session of 2006, all school districts of the first class A, second class, third class and fourth class must adopt a preliminary budget proposal. The proposal must include estimated revenues and expenditures and the proposed tax rates. This proposed budget must be considered by the Board no later than 90 days prior to the date of the election immediately preceding the fiscal year. The preliminary budget proposal must also be printed and made available for public inspection at least 20 days prior to its adoption. The board of school directors may hold a public hearing on the budget, but are not required to do so. The board must give at least 10 days’ public notice of its intent to adopt the final budget according to Act 1 of 2006.[215]
In 2013, the average teacher salary in Minersville Area School District was $48,958 a year.[216] The District employed 151 teachers with a top salary of $93,000.[217][218] Pennsylvania teacher salaries (2013–14) are searchable in a statewide database provided by TribLive News.[219] Minersville Area School District teacher and administrator retirement benefits are equal to at least 2.00% x Final Average Salary x Total Credited Service. (Some teachers benefits utilize a 2.50% benefit factor.)[220] After 40 years of service, Pennsylvania public school teachers and administrators can retire with 100% of the average salary of their final 3 years of employment. According to a study conducted at the American Enterprise Institute, in 2011, public school teachers’ total compensation is roughly 50 percent higher than they would likely receive in the private sector. The study found that the most generous benefits that teachers receive are not accounted for in many studies of compensation including: pension, retiree health benefits and job security.[221] In 2014-15, the state mandated District contribution to the teacher pension fund rose to 21.40% of employee salaries and in 2015-16 it rose again to 25.84% of total District salaries.[222]
In 2011, the average teacher salary in Minersville Area School District was $51,097 a year. The District employed 96 teachers with a top salary of $81,600.[223] In 2011, Minersville Area School Board inked a new 3-year contract with the teachers union. The terms called for salary increases of 2.8 percent. Co-pay for medical benefits per employee increased by 13.05 percent for the traditional plan and 9.5 percent for the first year of a PPO Plan.[224]
In 2007, Minersville Area School District employed 73 teachers. The average teacher salary in the district was $46,978 for 180 days worked.[225] In 2009, the district employed 99 teachers and the teacher's salaries ranged between $40,000 and $64,000.[226]
- Administration spending
Minersville School District administrative costs per pupil in 2008 was $663 per pupil. The lowest administrative cost per pupil in Pennsylvania was $398 per pupil.[227] In 2007, Mr Brady reported that his salary was $0 and that he had worked without a salary for the past six years.[228] Brady retired in 2013 with 39 years spent as superintendent in MASD. Superintendents and administrators receive a benefit package commensurate with that offered to the district's teachers' union.[229]
- Per pupil spending
In 2008, Minersville Area School District reported spending $11,927 per pupil. This ranked 283rd in the state for per pupil spending.[230] By 2011, Minersville Area SD per pupil spending rose to $11,240.77 per pupil.[231] By 2014, the District's per pupil spending had risen to $11,994.22[232] In 2011, Pennsylvania's per pupil spending was $13,467, ranking 6th in the United States.[233] In 2007, the Pennsylvania per pupil total expenditures was reported as $12,759.[234]
The U.S. Census Bureau reported that Pennsylvania spent $8,191 per pupil in school year 2000-01.[235] In 2007, the Pennsylvania per pupil total expenditures was reported as $12,759.[236] Among the fifty states, Pennsylvania's total per pupil revenue (including all sources) ranked 11th at $15,023 per student, in 2008-09.[237] Pennsylvania's total revenue per pupil rose to $16,186 ranking 9th in the nation in 2011.[238]
Reserves In 2008, the Minersville Area School District reported a balance of $4,297,123.00, in reserve funds.[239] In 2010, Minersville Area School District administration reported $4,049,228 in the unreserved-undesignated fund balance. In 2013-14, Minersville Area School District reported having $2,937,315 in reserves. In 2014 the District reported $4,646,702 in reserves.[240]
Pennsylvania public school district reserve funds are divided into two categories – designated and undesignated. The undesignated funds are not committed to any planned project. Designated funds and any other funds, such as capital reserves, are allocated to specific projects. School districts are required by state law to keep 5 percent of their annual spending in the undesignated reserve funds to preserve bond ratings. According to the Pennsylvania Department of Education, from 2003 to 2010, as a whole, Pennsylvania school districts amassed nearly $3 billion in reserved funds.[241] In 2005, the total reserve funds held by Pennsylvania public school districts was $1.9 billion.[242] By 2013, reserves held by Pennsylvania public school districts, as a whole, had increased to over $3.8 billion.[243][244][245]
- State Audits
In August 2010, the Minersville Area School District was audited by the Pennsylvania Auditor General. The performance audit cited the district for several deficiencies.[246] In early 2014, Minersville Area School District was audited again by the state. Compliance issues found in a previous audit were noted.[247]
- Tuition
Students who live in the Minersville Area School District's attendance area may choose to attend one of Pennsylvania's 157 public charter schools. A student living in a neighboring public school district or a foreign exchange student may seek admission to Minersville Area School District. For these cases, the Pennsylvania Department of Education sets an annual tuition rate for each school district. It is the amount the public school district pays to a charter school for each resident student that attends the charter and it is the amount a nonresident student's parents must pay to attend the District's schools. The 2015 tuition rates were Elementary School - $8,124.82, High School - $8,949.86.[248]
Minersville Area School District is funded by a combination of taxes, including: a local property tax, an earned income tax of 0.5%, a real estate transfer tax 0.5%, ACT 511 tax $5 per person per year, Local Service Tax - $52, Occupation tax, $180 per year coupled with substantial funding from the Commonwealth of Pennsylvania and a small amount generally 10% from the federal government.[249] Grants can provide an opportunity to supplement school funding without raising local taxes. Interest earnings on accounts also provide nontax income to the District. In the Commonwealth of Pennsylvania, pension and Social Security income are exempted from state personal income tax and local earned income tax regardless of the individual's wealth.[250] The average Pennsylvania public school teacher pension in 2011 exceeded $60,000 a year, plus they receive federal Social Security benefits. Both retirement benefits are free of Pennsylvania state income tax and local income tax which funds local public schools.[251] Effective 2016, active duty military are also exempted from paying the local earned income tax in Pennsylvania.[252][253]
State basic education funding
According to a report from Representative Todd Stephens office, Minersville Area School District receives 51.5% of its annual revenue from the state.[254] This exceeds some education advocates goal of the state providing 50% of district funding.[255]
In December 2014, the Pennsylvania Education Funding Reform Commission conducted a hearing. Testimony was given regarding state funding at the fastest growing districts and those with the greatest decline in enrollment since 1996.[256][257] The commission developed a new basic education funding formula which sets a new way to distribute state basic education dollars. It abolished the practice of "hold harmless" funding, which gave districts at least the same as they got the previous school year regardless of declining enrollment. The plan became law in June 2016 (House Bill 1552).[258][259][260]
For the 2016-17 school year, Minersville Area School District received $5,685,548 in Basic Education Funding (BEF) from the Commonwealth of Pennsylvania. This is a 2.7% increase over 2015-16 funding to the District. The highest percentage of BEF increase in Schuylkill County was 4.8% awarded to Shenandoah Valley School District under the state's Basic Education Funding formula. For the 2016-17 school year, Pennsylvania increased its public education spending to a record high of $5,895 billion. It was a $200 million increase, 3.51% increase over the 2015-16 appropriation.[261] The state also funded Ready to Learn grants at $250 million and Special Education funding received a $20 million increase.[262] The state also paid $492 million to the school employee social security fund and another $2.064 billion to the teacher's pension fund.[263]
For the 2015-16 school year, Governor Tom Wolf released a partial Basic Education Funding of $2,664,877 to Minersville Area School District, in January 2016.[264] This was part of $10.3 billion in school funding withheld from the public schools, by the Governor since the summer of 2015.[265] The dispersement did not follow the new Basic Education Fair Funding formula which had been established by the Pennsylvania General Assemby in June 2015.[266]
In compliance with a legislative mandate that was passed with veto proof majorities in the Pennsylvania House and Senate,[267] the final BEF funding was determined for 2015-16, in April 2016. Minersville Area School District received $5,536,555 in Basic Education Funds for the 2015-16 school year. This was a 2.14% increase yielding a $115,795 increase over the previous school year funding. The District also received $228,637 in Ready to Learn funding from the state.[268]
For the 2014-15 school year, Minersville Area School District received $5,420,760 in State Basic Education funding. The District received $228,637 in new Ready To Learn Block grant. The State's enacted Education Budget included $5,526,129,000 for the 2014-2015 Basic Education Funding.[269] The Education budget also included Accountability Block Grant funding at $100 million and $241 million in new Ready to Learn funding for public schools that focus on student achievement and academic success. The State paid $500.8 million to Social Security on the school employees behalf and another $1.16 billion to the state teachers pension system (PSERS). In total, Pennsylvania's Education budget for K-12 public schools is $10 billion. This was a $305 million increase over 2013-2014 state spending and the greatest amount ever allotted by the Commonwealth for its public schools.[270]
In the 2013-2014 school year’’’, Minersville Area School District received a 1.8% increase or $5,420,760 in Pennsylvania Basic Education Funding. This is $97,685 more than its 2012-13 state BEF to the District. Additionally, Minersville Area School District received $79,859 in Accountability Block Grant funding to focus on academic achievement and level funding for special education services. Among the public school districts in Schulykill County, Saint Clair Area School District and Blue Mountain School District both received the highest percentage increase in BEF at 2.2%. The District had the option of applying for several other state and federal grants to increase revenues. The Commonwealth's budget increased Basic Education Funding statewide by $123 million to over $5.5 billion. Most of Pennsylvania's 500 public school districts received an increase of Basic Education Funding in a range of 0.9% to 4%. Eight public school districts received exceptionally high funding increases of 10% to 16%. The highest increase in state funding was awarded to Austin Area School District which received a 22.5% increase in Basic Education Funding.[271] The highest percent of state spending per student is in the Chester-Upland School District, where roughly 78 percent comes from state coffers. In Philadelphia, it is nearly 49 percent.[272] As a part of the education budget, the state provided the PSERS (Pennsylvania school employee pension fund) with $1,017,000,000 and Social Security payments for school employees of $495 million.[273]
For the 2012-13 school year, Minersville Area School District received $5,323,820 in state Basic Ed Funding.[274] The Governor's Executive Budget for 2012-2013 included $9.34 billion for kindergarten through 12th grade public education, including $5.4 billion in basic education funding, which was an increase of $49 million over the 2011-12 budget. In addition, the Commonwealth provided $100 million for the Accountability Block Grant (ABG) program. Minersville Area School District received $79,859. The state also provided a $544.4 million payment for School Employees’ Social Security and $856 million for School Employees’ Retirement fund called PSERS.[275] This amount was a $21,823,000 increase (0.34%) over the 2011-2012 appropriations for Basic Education Funding, School Employees' Social Security, Pupil Transportation, Nonpublic and Charter School Pupil Transportation. Since taking office, Corbett's first two budgets have restored more than $918 million in support of public schools, compensating for the $1 billion in federal stimulus dollars lost at the end of the 2010-11 school year.
In the 2011-12 school year, Minersville Area School District received $5,324,992 allocation, of state Basic Education Funding.[276][277] Additionally, Minersville Area School District received $79,859 in Accountability Block Grant funding. The enacted Pennsylvania state Education budget included $5,354,629,000 for the 2011-2012 Basic Education Funding appropriation. This amount was a $233,290,000 increase (4.6%) over the enacted State appropriation for 2010-2011.[278] The highest increase in state basic education funding was awarded to Duquesne City School District of Allegheny County, which got a 49% increase in state funding for 2011-12.[279] In 2010, the district reported that 882 students received free or reduced price lunches, due to the family meeting the federal poverty level.[280] Some Pennsylvania public school districts experienced a reduction of total funding due to the termination of federal stimulus funding which ended in 2011.
For the 2010-11 budget year, the state gave Minersville Area a 9.69% increase in basic education funding for a total of $5,891,437. This was the highest basic education increase in Schuylkill County. The district also received additional funding for special education services and from the accountability Block Grant Program.[281] Kennett Consolidated School District in Chester County received the highest increase in the state at 23.65% increase in funding for the 2010-11 school year. Fifteen (15) Pennsylvania public school districts received a BEF increase of greater than 10%. The state's hold harmless policy regarding state basic education funding continued where each district received at least the same amount as it received the prior school year, even when enrollment had significantly declined. The amount of increase each school district received was set by Governor Edward Rendell and then Secretary of Education Gerald Zahorchak, as a part of the state budget proposal given each February. This was the second year of Governor Rendell's policy to fund some public school districts at a far greater rate than others.[282]
In the 2009-2010 budget year, the Commonwealth of Pennsylvania provided an 8.17% increase in Basic Education funding for a total of $5,370,996. The state Basic Education funding to the district in 2008-09 was $4,965,147.49. According to the Pennsylvania Department of Education, 442 students received free or reduced-price lunches due to low family income in the 2007-2008 school year.[283] The district also received supplemental funding for English language learners, Title 1 federal funding for low-income students, for district size, a poverty supplement from the Commonwealth and more.[284] Shenandoah Valley School District received the highest increase in Schuylkill County with a 14.50% increase in basic education funding, for the 2009-10 school year. Among the 500 school districts in Pennsylvania, Muhlenberg School District in Berks County received the highest with a 22.31% increase in funding.[285] The amount of funding each school district received was determined by the Governor Edward Rendell and the Secretary of Education Gerald Zahorchak through the allocation set in the state budget proposal made in February each year.[286]
The MASD received more than $6.7 million in state funding for school year 2007-08.[287] According to the U.S. Census Bureau, Pennsylvania spent $7,824 Per Pupil in the year 2000. This amount increased up to $12,085 by the year 2008.[288][289]
All Pennsylvania school districts also receive additional funding from the state through several funding allocations, including: Reimbursement of Charter School Expenditures; Special Education Funding; Secondary Career & Technical Education Subsidy; PA Accountability Grants; and low achieving schools were eligible for Educational Assistance Program Funding. Plus all Pennsylvania school districts receive federal dollars for various programs including: Special Education funding and Title I funding for children from low income families. In 2010, Pennsylvania spent over $24 billion for public education - local, state and federal dollars combined.[290] By 2015, Pennsylvania was spending over $27 billion on public education (local, state and federal resources combined).[291]
Accountability Block Grants
Beginning in 2004-2005, the state launched the Accountability Block Grant school funding. This program has provided $1.5 billion to Pennsylvania's school districts. The Accountability Block Grant program requires that its taxpayer dollars are focused on specific interventions that are most likely to increase student academic achievement. These interventions include teacher training, all-day kindergarten, lower class size K-3rd grade, literacy and math coaching programs that provide teachers with individualized job-embedded professional development to improve their instruction, before or after school tutoring assistance to struggling students. For 2010-11 the Mahanoy Area School District applied for and received $216,756 in addition to all other state and federal funding. The district used the funding to provide full-day kindergarten for the seventh year.[292][293]
Classrooms for the Future grant
The Classroom for the Future state program provided districts with hundreds of thousands of extra state funding to buy laptop computers for each core curriculum high school class (English, Science, History, Math) and paid for teacher training to optimize the computers use. The program was funded from 2006-2009. Mahanoy Area School District did not apply for funding in 2006-07 nor in 2007-08. For the 2008-09, school year the district received $74,691 in state funding. Of the 501 public school districts in Pennsylvania, 447 of them received Classrooms for the Future grant awards.[294]
Ready to Learn grant
Beginning in the 2014-2015 budget, the State funded a new Ready to Learn Grant for public schools. A total of $100 million is allocated through a formula to districts based on the number of students, level of poverty of community as calculated by its market value/personal income aid ratio (MV/PI AR) and the number of English language learners. Ready to Learn Block Grant funds may be used by the Districts for: school safety; Ready by 3 early childhood intervention programs; individualized learning programs; and science, technology, engineering and math (STEM) programs.[295]
Minersville Area School District received $176,250 in Ready to Learn Grant dollars in addition to State Basic Education funding, Special Education funding, transportation reimbursement, reimbursement for Social Security payments for employees and other state grants which the district must apply to receive.
Project 720
Project 720 was a high school reform program implemented for three years under the Rendell administration. The intent was to increase academic rigor and improve the instruction of teachers in the Commonwealth's high schools. Teachers were expected to use data driven instructional practices and to meet the needs of diverse learners.[296] The 720 in the name referred to the number of days a student was in high school in ninth through 12th grades.[297] High schools applied for funding and were required to agree to report to the PDE their plans, their actions and the outcomes. In 2007-08 budget year, the Commonwealth provided $11 million in funding. Minersville Area School District was one of 161 PA public school districts to apply, receiving $192,000 funding over three years.[298][299] For 2010-11, Project 720 funding was decreased to $1.7 million by Governor Rendell. The grant program was discontinued effective with the 2011-12 state budget.[300]
Other grants
Minersville Area School District did not participate in: Pennsylvania Department of Environmental Protection's Environmental Education annual grants;[301][302] PA Science Its Elementary grants (discontinued effective with 2009-10 budget by Governor Rendell);[303] Education Assistance Grants; 2012 Striving Readers Comprehensive Literacy grant;[304] nor the 2013 Safe Schools and Resource Officer grants; 2012 and 2013 Pennsylvania Hybrid Learning Grants;[305]
Common Cents state initiative
The Minersville Area School Board elected to not participate in the Pennsylvania Department of Education Common Cents program. [306] The program called for the state to audit the district, at no cost to local taxpayers, to identify ways the district could save tax dollars.[307][308] After the review of the information, the district was not required to implement the recommended cost savings changes.
Federal funding
Minersville Area School District received an extra $1,095,404 in ARRA - Federal Stimulus money to be used in specific programs like special education and meeting the academic needs of low-income students.[309][310] The funding was limited to the 2009-2010 and 2010-2011 school years.[311] Due to the temporary nature of the funding, schools were repeatedly advised by the Pennsylvania Department of Education, the Pennsylvania Senate Education Committee, the Governor and the Pennsylvania School Board Association, to use the funds for one-time expenditures like acquiring equipment, making repairs to buildings, training teachers to provide more effective instruction or purchasing books and software.
Race to the Top grant
Minersville Area School District officials applied for the Race to the Top federal grant which would have brought the district hundreds of thousands of additional federal dollars for improving student academic achievement.[312] Participation required the administration, the school board and the local teachers' union to sign an agreement to prioritize improving student academic success. In Pennsylvania, 120 public school districts and 56 charter schools agreed to participate.[313] Pennsylvania was not approved for the grant. The failure of districts to agree to participate was cited as one reason that Pennsylvania was not approved.[314]
Title II grants
The Federal government provides annual grants to schools to be used to improve the quality of teacher instructions to pupils. The goal is to provide each child in public schools with "High Quality" teachers and principals as defined by the state.[315] The funds are sent to the state Department of Education which distributes them to each school district and charter school.[316] Beginning in 2002, the federal funding committed to Title II was $3,175,000,000.
Public school district administrations must apply to the state annually for the Title II funds. In 2012-13, Minersville Area School District received $55,069 in federal Title II funding.[317] In 2014-15, Minersville Area School District applied for and received $51,200.[318]
English language learners grant
The Federal government provides annual grants to schools to assist in educating immigrant children and children who are identified as limited English proficient.[319] Upon registering for school a language survey is done for all new enrollment pupils, typically in kindergarten or preschool. They identify the primary language spoken at home. This data is collected and submitted to the Pennsylvania Department of Education, which in turn notifies the federal government.[320]
In 2012-13, Minersville Area School District received $2,173 in Title III funding for English language learners.[321] For 2014-15, Minersville Area School District received $1,141 in Title III funding.[322]
Local Services Tax
All local taxing authorities are required by the Local Tax Enabling Act to exempt disabled veterans and members of the armed forces reserve who are called to active duty at any time during the tax year from any local services tax and to exempt from any local services tax levied at a rate in excess of $10 those persons whose total income and net profits from all sources within the political subdivision is less than $12,000 for the tax year. The Local Tax Enabling Act also authorizes, but does not require, taxing authorities to exempt from per capita, occupation, and earned income taxes and any local services tax levied at a rate of $10 or less per year, any person whose total income from all sources is less than $12,000 per year.
Real estate taxes
Minersville Area School Board set property tax rates in 2015-16 at 38.6700 mills. A mill is $1 of tax for every $1,000 of a property's assessed value. Irregular property reassessments have become a serious issue in the commonwealth as it creates a significant disparity in taxation within a community and across a region.[323] Property taxes, in the Commonwealth of Pennsylvania, apply only to real estate - land and buildings. The property tax is not levied on cars, business inventory, or other personal property. Certain types of property are exempt from property taxes, including: places of worship, places of burial, private social clubs, charitable and educational institutions and all government property (local, state and federal). Additionally, service related, disabled US military veterans may seek an exemption from paying property taxes. Unlike other states, under Pennsylvania state tax policy, natural gas and oil pipelines are exempted from property taxes.[324]
Pennsylvania school district revenues are dominated by two main sources: 1) Property tax collections, which account for the vast majority (between 75-85%) of local revenues; and 2) Act 511 tax collections, which are around 15% of revenues for school districts.[325] When a Pennsylvania public school district includes municipalities in two or more counties, each of which has different rates of property tax assessment, a state board equalizes the tax rates between the counties.[326] In 2010, miscalculations by the State Tax Equalization Board (STEB) were widespread in the Commonwealth and adversely impacted funding for many school districts, including those that did not cross county borders.[327]
The average yearly property tax paid by Schuylkill County residents amounts to about 2.84% of their yearly income. Schuylkill County ranked 700th out of the 3143 United States counties for property taxes as a percentage of median income.[339] According to a report prepared by the Pennsylvania Department of Education, the total real estate taxes collected by all school districts in Pennsylvania rose from $6,474,133,936 in 1999-00 to $10,438,463,356 in 2008-09 and to $11,153,412,490 in 2011.[340] Property taxes in Pennsylvania are relatively high on a national scale. According to the Tax Foundation, Pennsylvania ranked 11th in the U.S. in 2008 in terms of property taxes paid as a percentage of home value (1.34%) and 12th in the country in terms of property taxes as a percentage of income (3.55%).[341] Pennsylvania's 2011 tax burden of 10.35% ranked 10th highest out of 50 states. The tax burden was above the national average of 9.8%. Pennsylvania's taxpayers paid $4,374 per capita in state and local taxes, including school taxes.[342]
Act 1 Adjusted index
The Act 1 of 2006 Index regulates the rates at which each school district can raise property taxes in Pennsylvania. Districts are not allowed to raise taxes above that index unless they allow voters to vote by referendum, or they seek an exception from the state Department of Education. The base index for the 2011-2012 school year is 1.4 percent, but the Act 1 Index can be adjusted higher, depending on a number of factors, such as property values and the personal income of district residents. Act 1 included 10 exceptions, including: increasing pension costs, increases in special education costs, a catastrophe like a fire or flood, increase in health insurance costs for contracts in effect in 2006 or dwindling tax bases. The base index is the average of the percentage increase in the statewide average weekly wage, as determined by the PA Department of Labor and Industry, for the preceding calendar year and the percentage increase in the Employment Cost Index for Elementary and Secondary Schools, as determined by the Bureau of Labor Statistics in the U.S. Department of Labor, for the previous 12-month period ending June 30. For a school district with a market value/personal income aid ratio (MV/PI AR) greater than 0.4000, its index equals the base index multiplied by the sum of .75 and its MV/PI AR for the current year.[343]
The School District Adjusted Index for the Minersville School District 2006-2007 through 2011-2012.[344]
|
For the 2016-17 budget year, Minersville ARea School Board did not apply for any exceptions to exceed the District's Act 1 Index limit.[351] Statewide 299 school districts adopted a resolution to not exceed their Act I index in 2016-17.
For the 2015-16 budget year, Minersville Area School Board did not apply for any exceptions to exceed their Act 1 Index limit. For the school budget 2015-16, 310 Pennsylvania public school districts adopted a resolution certifying that tax rates would not be increased above its Act 1 Index limit. Another 187 school districts adopted a preliminary budget leaving open the option of exceeding the Index limit. Regarding the pension costs exception, 172 school districts received approval to exceed the Index limit in full, while others received a partial approval of their request. For special education costs, 119 districts received approval to exceed their tax limit. No Pennsylvania public school districts received an approval for the grandfathered construction debts exception.[352]
For the 2014-15 budget year, Minersville Area School Board did not apply for exceptions to exceed their Act 1 Index limit. In 2014-15, all Pennsylvania school districts were required to make a 21.4% of payroll payment to the teacher’s pension fund (PSERS).[353] For the school budget 2014-15, 316 Pennsylvania public school districts adopted a resolution certifying that tax rates would not be increased above its Act 1 Index limit. Another 181 school districts adopted a preliminary budget leaving open the option of exceeding the Index limit. Districts may apply for multiple exceptions each year. For the pension costs exception, 163 school districts received approval to exceed the Index in full, while others received a partial approval of their request. For special education costs, 104 districts received approval to exceed their tax limit. Seven Pennsylvania public school districts received an approval for the grandfathered construction debts exception.[354]
In the Spring of 2010, 135 Pennsylvania school boards asked to exceed their adjusted index. Approval was granted to 133 of them and 128 sought an exception for pension costs increases.[355]
Property tax relief
In 2013, Minersville Area School District approved 2,705 homestead properties to receive $131.[356] The amount received by the District must be divided equally among all approved residences.[357]
In 2009, the Homestead/Farmstead Property Tax Relief from gambling for the Minersville Area School District was $131 per approved permanent primary residence. In the district, 2,722 property owners applied for the tax relief. In Schuylkill County, the highest amount of tax relief in 2009, went to Schuylkill Haven Area School District at $195.[358] The tax relief was subtracted from the total annual school property tax bill. Property owners apply for the relief through the county Treasurer's office. Farmers can qualify for a farmstead exemption on building used for agricultural purposes. The farm must be at least 10 contiguous acres and must be the primary residence of the owner. Farmers can qualify for both the homestead exemption and the farmstead exemption. A special report released in 2009 by the Auditor General's office reported many difficulties for applicants for tax relief.[359] Pennsylvania awarded the highest property tax relief to residents of the Chester-Upland School District in Delaware County at $632 per homestead and farmstead in 2010.[360] This was the second year they were the top recipient.
Additionally, the Pennsylvania Property Tax/Rent Rebate program is provided for low income Minersville Area residents aged 65 and older; widows and widowers aged 50 and older; and people with disabilities age 18 and older. The income limit is $35,000 for homeowners. The maximum rebate for both homeowners and renters is $650. Applicants can exclude one-half (1/2) of their Social Security income, consequently individuals who have income substantially more than $35,000, may still qualify for a rebate. Individuals must apply annually for the rebate. This can be taken in addition to Homestead/Farmstead Property Tax Relief.[361]
Enrollment
Minersville Area School District is experiencing low enrollment in K-12. The Pennsylvania Department of Education projects the district's enrollment will remain below 1300 pupils through 2018.[362] Shifting population trends across the U.S. and Pennsylvania are affecting school enrollment and may impact the building needs of school districts in the years to come.[363] Over the next 10 years, rural Pennsylvania school enrollment is projected to decrease 8 percent. The most significant enrollment decline is projected to be in western Pennsylvania, where rural school districts may have a 16 percent decline. More than 40 percent of elementary schools and more than 60 percent of secondary schools in western Pennsylvania are projected to experience significant enrollment decreases (15 percent or greater).[364]
Pennsylvania has one of the highest numbers of school districts in the nation. In Pennsylvania, 80% of the school districts serve student populations under 5,000, and 40% serve less than 2,000. Less than 95 of Pennsylvania's 501 school districts have enrollment below 1250 students, in 2007.[365]
Extracurriculars
Minersville Area School District offers a variety of clubs, activities and an extensive sports program. Eligibility to participate is set by school board policies[366][367] and in compliance with standards set by the Pennsylvania Interscholastic Athletic Association (PIAA). The PIAA mandates that student athletes must be passing at least four full-credit subjects to participate in sports.[368]
It offers: German club, Spanish club, Classics Club, Chemistry Club, Academic League, Drama Club, Students Against Destructive Decisions (S.A.D.D), Student Council, National Honor Society, Yearbook, and spelling bees for 7th and 8th graders. The music program includes: Marching band, chorus, and a musical.
By Pennsylvania law, all K-12 students in the district, including those who attend a private nonpublic school, cyber charter school, charter school and those homeschooled, are eligible to participate in the extracurricular programs, including all athletics. They must meet the same eligibility rules as the students enrolled in the district's schools. [369]
According to PA Child Abuse Recognition and Reporting Act 126 of 2014, all volunteer coaches and all those who assist in student activities, must have criminal background checks. Like all school district employees, they must also attend an anti child abuse training once every three years.[370][371][372]
Sports
Coaches receive compensation as outlined in the teachers' union contract. When athletic competition exceeds the regular season, additional compensation is paid.[373] The District is noncompliant with state law, due to failing to post its Interscholastic Athletic Opportunities Title IV Disclosure Form on its website. Article XVI-C of the Public School Code requires the disclosure of interscholastic athletic opportunities for all public secondary school entities in Pennsylvania. All school entities with grades 7-12 are required to annually collect data concerning team and financial information for all male and female athletes beginning with the 2012-13 school year and submit the information to the Pennsylvania Department of Education. Beginning with the 2013-14 school year, all non-school (booster club and alumni) contributions and purchases must also be reported to PDE.[374]
According to Pennsylvania’s Safety in Youth Sports Act, all sports coaches, paid and volunteer, are required to annually complete the Concussion Management Certification Training and present the certification before coaching.[375][376]
The District funds three teams in many of its sports:
- Varsity
|
|
- Junior High School Sports
|
|
According to PIAA directory July 2016[377]
References
- ↑ Pennsylvania Department of Education (2016). "Minersville Area School District names and addresses".
- ↑ Tribune Live.com (2015). "PA Teacher Salaries Database".
- ↑ National Center for Education Statistics (2014). "Common Core of Data Minersville Area School District".
- ↑ Pennsylvania Department of Education (December 4, 2015). "Minersville Area School District Fast Facts 2015".
- ↑ Pennsylvania Department of Education, Minersville Area School District Enrollment 2013-14, 2014
- ↑ Pennsylvania Department of Education, Minersville Area School District Enrollment and Projections, January 2009
- ↑ Pennsylvania Department of Education, Minersville Area School District Enrollment 2014-15, 2015
- ↑ Minersville Area School Board, Minersville Area School District Budget Highlights 2016-17, May 2016
- ↑ GABRIELLA O'GRADY (May 28, 2015). "Minersville Area school board approves tentative budget". Republican Herald.
- ↑ Thomas Leskin, Minersville superintendent to retire after 51 years with district, The Republican Herald, May 29, 2013
- ↑ Leslie Richardson, No tax increase in Minersville Area's tentative budget, Republican Herald, May 25, 2010
- ↑ PDE, Finances Selected Data, 2015
- ↑ US Census Bureau, 2010 Census Poverty Data by Local Education Agency, 2011
- ↑ proximityone (2014). "School District Comparative Analysis Profiles".
- ↑ Pennsylvania Budget and Policy Center, Education Facts Student Poverty Concentration by LEA, 2012
- ↑ US Census Bureau, American Fact Finder, 2009
- ↑ US Census Bureau (2010). "American Fact Finder, State and County quick facts".
- ↑ US Census Bureau (September 2011). "Income, Poverty, and Health Insurance Coverage in the United States: 2010" (PDF).
- ↑ US Census Bureau (2014). "Pennsylvania Median household income, 2006-2010 by County".
- ↑ Michael Sauter & Alexander E.M. Hess, (August 31, 2013). "America's most popular six-figure jobs". USA Today.
- ↑ Jeff Guo (September 15, 2015). "Lower wages for whites, higher wages for immigrants, and inequality for all". Washington Post.
- ↑ Pennsylvania General Assembly (2010). "Pennsylvania Public School Code Governance".
- ↑ Minersville Area School District administration, Minersville Area School Board, 2010
- ↑ US Department of Education (2015). "Every Student Succeeds Act".
- ↑ Pennsylvania General Assembly (2012). "Act of Jul. 12, 2012, P.L. 1142, No. 141 Section 921-A".
- ↑ Minersville Area School District administration, Minersville Area School District website, August 2016
- ↑ Pennsylvania General Assembly, Pennsylvania School Code, 2013
- ↑ Pennsylvania General Assembly (2012). "Act of Jul. 12, 2012, P.L. 1142, No. 141".
- ↑ The Commonwealth Foundation for Public Policy Alternatives, The Pennsylvania Project, May 20, 2010
- ↑ Pennsylvania Auditor General Office (October 6, 2015). "561 Academically Challenged Schools Overlooked by the Department of Education" (PDF).
- ↑ Joe Sylvester (October 7, 2015). "8 schools in Valley jilted, audit reveals". The Daily Item.
- ↑ Pennsylvania Auditor General Office (October 7, 2015). "Special Performance Audit Report - Pennsylvania Department of Education" (PDF).
- ↑ Pittsburgh Business Times (April 10, 2015). "Guide to Pennsylvania Schools Statewide School District Ranking 2015".
- ↑ Pittsburgh Business Times (April 11, 2014). "What makes up a district's School Performance Profile score?".
- ↑ Paul Jablow (November 18, 2015). "Understanding the PSSA exams". The Notebook.
- ↑ Pittsburgh Business Times (April 11, 2014). "Western Pennsylvania School Guide 2014".
- ↑ "Statewide Honor Roll Rankings 2013". Pittsburgh Business Times. April 5, 2013.
- ↑ Pittsburgh Business Times, Statewide Honor Roll Rankings 2012, April 4, 2012
- ↑ Pittsburgh Business Times (May 6, 2010). "Statewide Honor Roll Ranking 2010".
- ↑ USC Ranked Best School District In Pa.; Complete List Inside, WTEA, Pittsburgh Business Times, May 18, 2007
- ↑ Overachiever statewide ranking, Pittsburgh Business Times. May 6, 2010
- ↑ Pennsylvania Department of Education (September 21, 2012). "Minersville Area School District AYP Overview 2012".
- ↑ Pennsylvania Department of Education (September 21, 2012). "About Adequate Yearly Progress (AYP) in Pennsylvania".
- ↑ Pennsylvania Department of Education, Pennsylvania Public School District AYP History, 2011
- ↑ Pennsylvania Department of Education, Pennsylvania Minersville Area School District AYP History 2003-2010, 2011
- ↑ Liz Hayes and Jody Weigand (July 13, 2011). "New Kensington-Arnold 'flagged' for test scores". TribLIVE.
- ↑ The Notebook (July 15, 2011). "List of 89 Pa. schools to be investigated".
- ↑ Eleanor Chute and Mary Niederberger (September 9, 2012). "Inquiry continues into cheating on PSSA tests". Pittsburgh Post Gazette.
- ↑ Republican Herald, Minersville Area records letter closing investigation into allegations of test irregularities, JANUARY 24, 2012
- ↑ USA Today (July 13, 2011). "Pa. looking into possible cheating on state tests".
- ↑ Data Recognition Corporation (July 2009). "Data Forensics Technical Report" (PDF).
- ↑ PDE, Graduation rate by LEA, 2015
- ↑ PDE, Graduation rate by LEA, 2014
- ↑ PDE, Graduation rate by LEA, 2013
- ↑ Pennsylvania Department of Education (September 21, 2012). "Minersville Area School District AYP Data Table 2012".
- ↑ Pennsylvania Department of Education, School District AYP Data Table 2011, September 29, 2011
- ↑ Pennsylvania Department of Education (March 15, 2011). "New 4-year Cohort Graduation Rate Calculation Now Being Implemented".
- ↑ Minersville Area School District Academic Achievement Report Card 2010 data table
- ↑ Minersville Junior Senior High School Academic Achievement Report Card 2009
- ↑ "2008 Graduation Rates Schulykill County". June 25, 2009.
- ↑ Pennsylvania Partnership for Children. "Pennsylvania High School Graduation Rates report" (PDF).
- ↑ Pennsylvania Department of Education (November 4, 2015). "Minersville Area Junior Senior High School Fast Facts 2015".
- ↑ US News and World Report, Best High Schools, 2016
- ↑ Pennsylvania Department of Education (2015). "Highly Qualified Teacher Guidelines".
- ↑ National Center for Education Statistics, Common Core Data - Minersville Area junior Senior High School, 2014
- ↑ Pennsylvania Department of Education, Professional Qualifications of Teachers Minersville Area Junior Senior High School 2012, September 21, 2012
- ↑ Pennsylvania Department of Education (November 4, 2015). "Minersville Area Junior Senior High School School Performance Profile 2015".
- ↑ Jan Murphy (November 4, 2015). "Report card for state's high schools show overall decline". Pennlive.com.
- ↑ Pennsylvania Department of Education (November 4, 2015). "2015 Keystone Exam School Level Data".
- ↑ Pennsylvania Department of Education (November 6, 2014). "Minersville Area Junior Senior High School Academic Performance Data 2014".
- ↑ Evamarie Socha (November 6, 2014). "Half of Valley districts see state test scores decline". The Daily Item.
- ↑ Eleanor Chute (November 21, 2014). "Pennsylvania student scores declined with reduced funding, test results show". Pittsburgh Post-Gazette.
- ↑ Acting Secretary of Education Carolyn Dumaresq, Acting Secretary of Education Announces Results of 2013-14 School Performance Profile; Strong Performance in 72 Percent of Schools, November 6, 2014
- ↑ Kathy Boccella, Dylan Purcell, Kristen A. Graham., Pa. school rankings: Downingtown STEM No. 1; Phila. falters, Philadelphia Inquirer , November 6, 2014
- ↑ Jan Murphy (November 6, 2014). "More Pa. school scores decline than improve, state report card shows". Pennlive.com.
- ↑ Evamarie Socha (November 6, 2014). "Half of Valley districts see state test scores decline".
- ↑ Pennsylvania Department of Education, Minersville Area Junior Senior High School Academic Performance Data 2013, October 4, 2013
- ↑ Eleanor Chute, Mary Niederberger (December 11, 2013). "New assessment shows fuller picture of Pa. schools". Pittsburgh Post-Gazette.
- ↑ Pennsylvania Department of Education (September 21, 2012). "Minersville Area Junior Senior High School Academic Report 2012".
- ↑ PDE, Minersville Area Junior Senior High School Academic Report 2011, September 29, 2011
- ↑ Pennsylvania Department of Education, Minersville Area Junior Senior High School Academic Report Card 2010, October 20, 2010
- ↑ Pennsylvania Department of Education, Minersville Area Junior Senior High School Academic Report Card 2005, 2005
- ↑ Pennsylvania Department of Education, Minersville Area Junior Senior High School Academic Report Card 2004, 2004
- ↑ Pennsylvania Department of Education, Minersville Area Junior Senior High School Academic Report Card 2003, 2003
- ↑ Pennsylvania Department of Education (2014). "State Academic Standards".
- ↑ Pennsylvania Department of Education (2014). "State Assessment System".
- ↑ Steve Esack, (May 14, 2013). "Pennsylvania getting swept into national 'Common Core' education debate". MCALL news.
- ↑ 2010 PSSAs: Reading, Math, Writing and Science Results
- ↑ 2009 PSSAs: Reading, Math, Writing and Science Results
- ↑ The 2008 PSSA Mathematics and Reading School Level Proficiency Results (by Grade and School Total)
- ↑ 2009 PSSA RESULTS Minersville Area School District, The Morning Call, June 2009
- ↑ Pennsylvania 2006-2007 PSSA and AYP Results
- ↑ 2009-10 School Level Science PSSA Results
- ↑ Pennsylvania 2007-08 School Level Science PSSA Results
- ↑ Pennsylvania College Remediation Report
- ↑ National Center for Education Statistics - IPEDS 2008
- ↑ Minersville High School Administration. "Minersville Area School District Student Handbook" (PDF).
- ↑ "Pennsylvania Code §4.24 (a) High school graduation requirements".
- ↑ Pennsylvania State Board of Education, Proposed changes to Chapter 4, May 10, 2012
- ↑ Jan Murphy (February 3, 2016). "Wolf signs bill to suspend use of Keystone Exams as a graduation requirement". Pennlive.com.
- ↑ Pennsylvania Department of Education (September 2011). "Pennsylvania Keystone Exams Overview".
- ↑ Pennsylvania Department of Education (2010). "Keystone Exam Overview" (PDF).
- ↑ Associated Press (January 20, 2016). "State moves ahead with plan to delay Keystone Exams as graduation requirement".
- ↑ Megan Harris (September 12, 2013). "Pennsylvania changing high school graduation requirements". Tribune Live.
- ↑ Pennsylvania Department of Education (September 2011). "Pennsylvania Keystone Exams Overview".
- ↑ Pennsylvania State Board of Education (2010). "Rules and Regulation Title 22 PA School Code CH. 4".
- ↑ Pennsylvania Department of Education, State Board of Education Finalizes Adoption of Pennsylvania Common Core State Academic Standards and High School Graduation Requirements, March 14, 2013
- ↑ Pennsylvania Department of Education (2011). "Keystone Exams".
- ↑ Pennsylvania Department of Education. "Dual Enrollment Program in Pennsylvania".
- ↑ Pennsylvania Department of Education. "Pennsylvania Dual Enrollment Guidelines and Awards 2010".
- ↑ Pennsylvania Department of Education (2015). "SAT and AP Scores 2015".
- ↑ College Board, SAT 2015 Total Group report Pennsylvania, 2016
- ↑ PDE, Minersville Area High School - School Performance profile, November 6, 2014
- ↑ Pennsylvania Department of Education (2014). "SAT and ACT Scores".
- ↑ College Board (2014). "2014 College-Bound Seniors State Profile Report" (PDF).
- ↑ College Board (2013). "The 2013 SAT Report on College & Career Readiness".
- ↑ Pennsylvania Department of Education (2011). "Public School SAT Scores 2011".
- ↑ College Board (September 15, 2011). "SAT Scores State By State - Pennsylvania".
- ↑ "While U.S. SAT scores dip across the board, N.J. test-takers hold steady". NJ.com. September 15, 2011.
- ↑ The Center for Rural Pennsylvania (August 2006). "SAT Scores and Other School Data".
- ↑ College Board (2014). "Exam Fees and Reductions: 2015".
- ↑ PDE, School Performance Profile - Academic Performance Data - Minersville Area Senior High School, December 2015
- ↑ Pennsylvania Department of Education. "IU16-PSSA 95-96 Results by School". Retrieved May 11, 2014.
- ↑ Pennsylvania Department of Education (2014). "Standards Aligned Systems".
- ↑ Pennsylvania Department of Education (2014). "State Academic Standards".
- ↑ Pennsylvania Department of Education (2014). "State Academic Standards Mathematics".
- ↑ Pennsylvania Department of Education (October 1, 2015). "2015 PSSA School Level Data".
- ↑ Pennsylvania Department of Education (October 1, 2015). "2015 PSSA State Level Data".
- ↑ Pittsburgh Post Gazette (October 15, 2012). "How is your school doing?".
- ↑ The Times-Tribune (2011). "Grading Our Schools database, 2010-11 Reading PSSA results".
- ↑ Pennsylvania Department of Education, PSSA Math and Reading Results 2010, October 20, 2010
- ↑ Pennsylvania Department of Education, PSSA Math and Reading Results 2007, 2007
- ↑ Pennsylvania Department of Education (September 21, 2012). "Minersville Area Junior Senior HIgh School Academic Achievement Report Card 2012" (PDF).
- ↑ Pennsylvania Department of Education, PSSA Results Math and Reading School 2008, August 15, 2008
- ↑ The Times-Tribune (2012). "Grading Our Schools database, 2011-12 Science PSSA results".
- ↑ Pennsylvania Department of Education, The 2008 PSSA Science State Level Proficiency Results by Grade and State Total (Full Academic Year)
- ↑ Office of First Lady (September 2, 2014). "Pennsylvania First Lady and Acting Secretary of Education Announce 35 Schools Statewide Implementing Dropout Program".
- ↑ Pennsylvania Department of Education, The Early Warning System, 2014
- ↑ Pennsylvania Department of Education (November 4, 2015). "Minersville Area Elementary Center Fast Facts 2015".
- ↑ Pennsylvania Department of Education, School Performance Profile, Minersville Area Elementary Center Fast Facts, 2015
- ↑ National Center for Education Statistics, Common Core Data – Minersville Area Elementary Center, 2013
- ↑ Pennsylvania Department of Education, Professional Qualifications of Teachers Elementary School, September 21, 2012
- ↑ Pennsylvania Department of Education (October 1, 2015). "2015 PSSA School Level Data".
- ↑ Pennsylvania Department of Education (October 1, 2015). "2015 PSSA State Level Data".
- ↑ Pennsylvania Department of Education (November 6, 2014). "Minersville Area Elementary Center Academic Performance Data 2014".
- ↑ PDE,Minersville Area Elementary Center Academic Performance Data 2013, October 4, 2013
- ↑ Pennsylvania Department of Education, Minersville Area Elementary Center AYP Overview 2012, September 21, 2012
- ↑ Pennsylvania Department of Education (September 21, 2012). "Minersville Area Elementary Center Report Card 2012".
- ↑ PDE, Minersville Area Elementary Center AYP history 2003-2012, 2012
- ↑ Pennsylvania State Board of Education (2003). "PSSA results 2003".
- ↑ New America Foundation (2003). "No Child Left Behind Overview".
- ↑ The Goals of No Child Left Behind (July 20, 2010). "The Goals of No Child Left Behind".
- ↑ Learning Point Associates (2002). "Understanding the No Child Left Behind Act" (PDF).
- ↑ Pennsylvania State Board of Education (January 11, 2003). "Pennsylvania Academic Standards Science and Technology, Ecology and Environment".
- ↑ Pennsylvania Department of Education (September 21, 2012). "Minersville Area Elementary Center Academic Performance report 2012" (PDF).
- ↑ Pennsylvania Department of Education, Minersville Area Elementary Center Academic Performance Report 2011, September 29, 2011
- ↑ Pennsylvania Department of Education, Minersville Area Elementary Center Academic Performance Report 2010, October 20, 2010
- ↑ Pennsylvania Department of Education, Minersville Area Elementary Center Academic Performance Report 2009, September 14, 2009
- ↑ Pittsburgh Post Gazette (October 15, 2012). "How is your school doing?".
- ↑ Minersville Area School Administration, Early Childhood Center,info, 2010
- ↑ "Minersville Early Childhood Education Center Fast Facts 2015". December 2015.
- ↑ PDE, 2013-14 PreK Counts Grantee, 2013
- ↑ PDE, PreK Counts Grant 2010-11, 2010
- ↑ NCES, Common Core of Data - Early Childhood Education Center, 2013
- ↑ EDNA, Minersville Area School District, 2015
- ↑ PDE, Full Day Kindergarten report 2010-11, 2010
- ↑ PDE, Governor Rendell Announces Grants for 'Pre-K Counts' Early Childhood Initiative, 2007
- ↑ Malia Villegas, Early Education Policy Brief, WestEd Center on Policy , April 2005
- ↑ Pennsylvania Department of Education, M School District academic report card 2012, 2012
- ↑ Pennsylvania Bureau of Special Education Services (2016). "Minersville Area School District Special Education Data Report LEA Performance on State Performance Plan (SPP) Targets".
- ↑ Pennsylvania Bureau of Special Education Services (2012). "Minersville Area School District Special Education Data Report LEA Performance on State Performance Plan (SPP) Targets".
- ↑ Pennsylvania Department of Education, Testimony Hearing on Special Education Senate Republican Policy Committee, January 2013
- ↑ Pennsylvania Department of Education (2016). "PA Special Education".
- ↑ Special Education Data Report LEA Performance on State Performance Plan (SPP) Targets School Year 2008-2009
- ↑ Gerald L. Zahorchak, D. Ed. (May 30, 2007). "House Education Committee Hearing on Governor's Proposed Increase for Accountability Block Grants Testimony for Gerald L. Zahorchak, D. Ed. Secretary, Pennsylvania Department of Education" (PDF).
- ↑ Pennsylvania Bureau of Special Education (2008). "Pennsylvania Parent Guide to Special Education Services" (PDF).
- ↑ Minersville Area School District, 2009-2010 Notice of Special Education Services, 2009
- ↑ Education Law Center (2012). "Key Timelines in the School-Age Special Education System" (PDF).
- ↑ Pennsylvania Department of Education - School District Administration (January 6, 2011). "Procedural Safeguards Notice".
- ↑ Pennsylvania Department of Education, Bureau of Special Education (September 2005). "Gaskin Settlement Agreement Overview Facts Sheet" (PDF).
- ↑ Eleanor Chute., Modified PSSA test in math offered for 1st time, Pittsburgh Post-Gazette, April 18, 2010
- ↑ "PSSA and Keystone Exam Accommodation Guidelines for Students with IEPs and 504 Plans". 2015.
- ↑ Pennsylvania Department of Education (December 12, 2014). "PSSA/ Keystone Accommodations Guidelines (PDE) 2015".
- ↑ Pennsylvania Department of Education. "Pennsylvania Special Education Funding".
- ↑ Browne, Patrick., Senate Education Committee Hearing on Special Education Funding & Accountability testimony, November 1, 2011
- ↑ Kintisch, Baruch (November 11, 2011). "Public Hearing: Pennsylvania Special Education Funding & Accountability Testimony".
- ↑ Amy Morton, Executive Deputy Secretary, Public Hearing: Special Education Funding & Accountability Testimony, Pennsylvania Department of Education, November 11, 2011
- ↑ US Department of Education (January 25, 2013). "U.S. Department of Education Clarifies Schools' Obligation to Provide Equal Opportunity to Students with Disabilities to Participate in Extracurricular Athletics".
- ↑ Pennsylvania Department of Education (July 2010). "Special Education Funding from Pennsylvania State_2010-2011".
- ↑ Pennsylvania Department of Education, Special Education Funding 2011-2012 Fiscal Year, 2011
- ↑ Pennsylvania Department of Education, Investing in PA kids, April 2012
- ↑ Pennsylvania Department of Education, Special Education funding report by LEA, July 2014
- ↑ Pennsylvania Department of Education, BEF, Special Education Funding, RTL Grants 2016-17, July 2016
- ↑ Special Education Funding Reform Commission (December 11, 2015). "Special Education Funding Reform Commission Report" (PDF).
- ↑ Pennsylvania Department of Education (July 2010). "Gifted Students as Percentage of Total Enrollment by School District/Charter School" (PDF).
- ↑ Pennsylvania Department of Education and Pennsylvania School Board. "CHAPTER 16. Special Education For Gifted Students". Retrieved February 4, 2011.
- ↑ Minersville Area School Board (June 26, 2006). "Policy Manual Student Wellness Policy" (PDF).
- ↑ Nutrition Standards for Competitive Foods in Pennsylvania Schools for the School Nutrition Incentive, Pennsylvania Department of Education — Division of Food and Nutrition. July 2008
- ↑ USDA, Child Nutrition Programs - Eligibility Manual for School Meals, 2012
- ↑ Pennsylvania Hunger Action Center, The Pennsylvania School Breakfast Report Card, 2009
- ↑ USDA, Child Nutrition Programs, June 27, 2013
- ↑ United States Department of Agriculture (2011). "Food and Nutrition Service Equity in School Lunch Pricing Fact Sheet" (PDF).
- ↑ Mary Pickels (March 5, 2016). "Opting out of school lunch program appeals as a palatable option". TribLive.com.
- ↑ Denver Nicks (February 25, 2014). "White House Sets New Limits on Junk Food Ads in Schools". Time Magazine.
- ↑ Mary Clare Jalonick (February 25, 2014). "New rules limit junk food advertising in schools". Associated Press.
- ↑ USDA Food and Nutrition Service (2014). "School Meals FAQ".
- ↑ Monica Eng (November 26, 2012). "Lactose intolerance: When drinking school milk makes students feel sick". Chicago Tribune.
- ↑ Pennsylvania State Department of Health (2010). "Pennsylvania Bulletin Doc. No. 10-984 School Immunizations; Communicable and Noncommunicable Diseases".
- ↑ Pennsylvania Department of Health (2014). "School Immunization Requirements".
- ↑ Pennsylvania Department of Health (2014). "Mandated School Health Screenings".
- ↑ York Dispatch (February 4, 2016). "All PA high schools to receive donated naloxone kits".
- ↑ Ben Allen (February 2, 2016). "Pa. to put drug that reverses overdoses in schools for free". WITF.
- ↑ Kristin Ioannou, Highmark. Inc. (2007). "Highmark Healthy High 5 Health eTools for Schools Available Free Through 2009".
- ↑ Cathy Hoffman, Interlink (September 2, 2008). "Highmark Foundation Extends Subsidy for Health eTools for Schools through 2013" (PDF).
- ↑ Pennsylvania General Assembly, Taxpayer Relief Act, Act 1 of the Special Session of 2006, June 27, 2006
- ↑ Pennsylvania Department of Education, Investing in Pennsylvania Students, 2013
- ↑ "Minersville Area School District Payroll report 2013". OpenPA Gov.org. 2014.
- ↑ Times Tribune (June 16, 2013). "PA Teacher Profile Database 2011-12".
- ↑ Triblive News (2015). "Pennsylvania teacher salary search".
- ↑ Pennsylvania School Employees Retirement System (2014). "Your PSERS Benefits & Leaving Employment".
- ↑ American Enterprise Institute, (2011). "Assessing the Compensation of Public School Teachers".
- ↑ PSERS Board of Trustees (2015). "Fiscal Year 2015/2016 Employer Contribution Rate" (PDF).
- ↑ "Minersville Area School District Payroll report 2011". OpenPA Gov.org. 2011.
- ↑ Leslie Richardson, Minersville school board and teachers ratify 3-year contract, The Republican Herald, March 29, 2011
- ↑ Fenton, Jacob, Average classroom teacher salary in Schuylkill County, 2006-07. The Morning Call, March 2009
- ↑ Asbury Park Press, Search PA Public School Salaries, 2009
- ↑ Fenton, Jacob., Pennsylvania School District Data: Will School Consolidation Save Money?, The Morning Call, February 2009
- ↑ M. Joseph Brady (August 8, 2007). "Letter from Mr. M. Joseph Brady, Superintendent to the Altoona Mirror" (PDF).
- ↑ Pennsylvania School Board Association (October 2009). "Public School Salaries 11th Annual".
- ↑ Per Pupil Spending in Pennsylvania Public Schools in 2008 Sort Administrative Spending, 2010
- ↑ Pennsylvania Department of Education (2010). "2009-10 Selected Data - 2009-10 Total Expenditures per ADM".
- ↑ PDE, Finances Selected data by LEA, 2014
- ↑ US Census Bureau, States Ranked According to Per Pupil Public Elementary-Secondary School System Finance Amounts: Fiscal Year 2011, May 2013
- ↑ US Census Bureau (2009). "Total and current expenditures per pupil in fall enrollment in public elementary and secondary education, by function and state or jurisdiction: 2006-07".
- ↑ US Census Bureau (March 2003). "Public Education Finances 2000-01 Annual Survey of Local Government Finances" (PDF).
- ↑ US Census Bureau (2009). "Total and current expenditures per pupil in fall enrollment in public elementary and secondary education, by function and state or jurisdiction: 2006-07".
- ↑ United States Census Bureau (2009). "States Ranked According to Per Pupil Elementary-Secondary Public School System Finance Amounts: 2008-09" (PDF).
- ↑ US Census Bureau (May 2013). "States Ranked According to Per Pupil Public Elementary-Secondary School System Finance Amounts: Fiscal Year 2011" (PDF).
- ↑ Pennsylvania Department of Education, (2008). "General Reserved Fund Balance by School District 1996-2008,".
- ↑ Jan Murphy (June 15, 2016). "Search the database: How much is in your school district's fund balance?".
- ↑ Murphy, Jan., Pennsylvania's public schools boost reserves, CentreDaily Times, September 22, 2010
- ↑ John Baer (December 9, 2013). "Pa. schools and $$ behind the curtain". Philadelphia Daily News.
- ↑ Melissa Daniels (June 1, 2013). "PA school districts look to cash stash to balance budgets". PA Independent.
- ↑ Jan Murphy (August 18, 2014). "School district reserves rise despite $1 billion cut in state aid". Pennlive.com.
- ↑ Commonwealth Foundation (May 17, 2012). "Chart: School District Fund Balances Nearly Tripled in 14 Years".
- ↑ Auditor General of Pennsylvania, Minersville Area School District PERFORMANCE AUDIT REPORT, AUGUST 2010
- ↑ Pennsylvania Auditor General (May 2014). "Minersville Areas School District Performance Audit" (PDF).
- ↑ Pennsylvania Department of Education (May 2015). "Pennsylvania Public School District Tuition Rates For Use During the 2014-2015 Fiscal Year".
- ↑ Penn State Cooperative Extension (2010). "What are the Local Taxes in Pennsylvania?, Local Tax Reform Education Project" (PDF).
- ↑ Pennsylvania Department of Revenue (April 2010). "Personal Income Taxation Guidelines".
- ↑ John Finnerty (2013). "PA teachers pensions". CNHI Harrisburg Bureau.
- ↑ Herald-Mail Media (February 24, 2016). "Kauffman law exempts military pay from Pa. earned-income taxes".
- ↑ Myle Snyder (February 23, 2016). "Gov. Wolf signs bill to exempt active duty military pay from local tax". ABC27 News.
- ↑ Pennsylvania Representative Todd Stephens (January 23, 2014). "LEEF Funding Chart 2014".
- ↑ JANICE BISSETT & ARNOLD HILLMAN (2006). "A Summary of the History and Financing of Education in Pennsylvania 1682- 2013" (PDF). PA Association of Rural and Small Schools.
- ↑ Nathan Benefield and James Paul Senior Policy Analyst (December 3, 2014). "School Funding Reform & Weighted Student Funding" (PDF).
- ↑ Pennsylvania General Assembly - Education Reform Commission (December 2014). "Basic Education Funding Commission Public Hearing Funding Issues related to Enrollment and Growth".
- ↑ Basic Education Funding Commission, Commission minutes, 2016
- ↑ York Dispatch, Governor Wolf Signs Fair Funding Formula, June 2016
- ↑ Pennsylvania General Assembly (June 2016). "House Bill 1552, Act 35 of 2016".
- ↑ Pennsylvania Department of Eductaion, Education Budget 2016-17, July 2016
- ↑ PDE, Special Education Funding fiscal year 2016-17, July 2017
- ↑ PA Office of Budget, Commonwealth 2016-17 Enacted Budget Line-Item Appropriations, July 2016
- ↑ Jan Murphey (January 4, 2016). "Here's the payout your school district gets from the partial 2015-16 state budget". Pennlive.com.
- ↑ Jennifer Wakeman (January 4, 2016). "Harrisburg releases $3.3 billion in delayed funds".
- ↑ Pennsylvania General Assembly (June 26, 2015). "Basic Education Funding Commission".
- ↑ Jan Murphy (April 15, 2016). "House, Senate cast veto-proof majority votes on school funding bill". Pennlive.com.
- ↑ PDE, Ed Budget 2015-16 , May 2016
- ↑ PDE (July 7, 2014). "Enacted Education Budget 2014-2015".
- ↑ Pennsylvania Department of Education, 2014-15 Enacted Education Budget Fast Facts, July 14, 2014
- ↑ Democrat Appropriations Committee, Report on Education funding by LEA, July 2, 2013
- ↑ Sam Wood and Brian X. McCrone (January 29, 2014). "Montgomery County lawmaker proposes using Pa. horse racing funds for education". Philadelphia Inquirer.
- ↑ Pennsylvania Office of the Budget, 2013-14 State Budget Highlights, 2013
- ↑ Senator Jake Corman (June 28, 2012). "Pennsylvania Education funding by Local School District" (PDF).
- ↑ Pennsylvania General Assembly Sen Jake Corman (June 29, 2012). "SB1466 of 2012 General Fund Appropriation".
- ↑ PA Senate Appropriations Committee (June 28, 2011). "School District 2011-12 Funding Report".
- ↑ Pennsylvania Department of Education, Education Funding, July 2011
- ↑ Pennsylvania Department of Education (June 30, 2011). "Basic Education Funding".
- ↑ Pennsylvania Department of Education (June 30, 2011). "Basic Education Funding 2011-2012 Fiscal Year".
- ↑ Pennsylvania Department of Education, District Allocations Report 2009, 2009-10
- ↑ Pennsylvania House Appropriations Committee (June 30, 2010). "PA Basic Education Funding-Printout2 2010-2011" (PDF).
- ↑ Office of the Budget (February 2010). "Pennsylvania Budget Proposal 2010".
- ↑ Pennsylvania Department of Education Funding Report by LEA 2009.
- ↑ Pennsylvania Department of Education - Basic Education Funding by School District 2009-10. October 2009
- ↑ Pennsylvania Department of Education, Report on Funding by school district October 2009, 2009
- ↑ Pennsylvania Office of Budget (February 2009). "Governor's Budget Proposal 2009 Pennsylvania Department of Education Budget Proposal 2009".
- ↑ Pennsylvania Department of Education, Funding Report by LEA, 2009
- ↑ U.S. Census Bureau., Annual Survey of Local Government Finances., 2000
- ↑ U.S. Census Bureau., 2008 Survey of Local Government Finances – School Systems, 2010
- ↑ Governor's Budget Office (2014). "Past Budgets 2013-14 to 2006-07".
- ↑ State Senator Lloyd Smucker Senate Education Committee Chairperson, PCNTV Interview state education Budget, June 2015
- ↑ Pennsylvania Department of Education. "Accountability Block Grant report 2010, Grantee list 2010".
- ↑ Pennsylvania Department of Education. "Accountability Block Grant Mid Year report".
- ↑ Pennsylvania Auditor General (2008-12-22). "Special Performance Audit Classrooms For the Future grants" (PDF).
- ↑ Pennsylvania Department of Education (2013). "Passport for Learning Block Grant".
- ↑ CAIU 15 (2007). "Project 720".
- ↑ PSEA (2006). "Project 720 PDE Education Improvement Initiative Series" (PDF).
- ↑ Pennsylvania Department of Education (2007). "Transforming Pennsylvania High Schools".
- ↑ Robert Hayes Postupac, PROJECT 720: A CASE STUDY OF HIGH SCHOOL REFORM, University of Pittsburgh, 2011
- ↑ PA Office of the Budget, 2011-12 Budget General Fund - State Appropriations, June 28, 2011
- ↑ Department of Environmental Protection (2014). "Environmental Education Grants".
- ↑ Pennsylvania Department of Environmental Protection (April 22, 2013). "Governor Corbett Awards 92 Grants for Environmental Education and Stewardship".
- ↑ Pennsylvania Department of Education, Science: It's Elementary Grantees Students in 143 Schools Benefit from Intensive Science Curriculum, July 22, 2008
- ↑ Pennsylvania Department of Education (May 23, 2012). "Pennsylvania Awards $36.1 Million to Strengthen Literacy Programs".
- ↑ Pennsylvania Department of Education Press Office (October 17, 2013). "Acting Secretary of Education Says Hybrid Learning Benefits Students; Highlights Success of First-Year Pilot Program".
- ↑ Governor Office Press release (March 12, 2008). "PA Education Department Announces 39 Districts to Take Part in 'Common Cents' Cost-Saving".
- ↑ Pennsylvania Department of Education, Common Cents program - Making Every Dollar Count, 2007
- ↑ PA General Assembly Task Force on School Cost Reduction (November 16, 2006). "Final Report Task Force on School Cost Reduction Findings and Recommendations".
- ↑ Commonwealth of Pennsylvania, County ARRA FUNDING Report, 2009
- ↑ ProPublica (2009). "Recovery Tracker Eye on the stimulus".
- ↑ "School stimulus money". Pittsburgh Post-Gazette. March 12, 2009.
- ↑ Pennsylvania Department of Education, Race To The Top Webinar powerpoint for districts December 2009, December 9, 2009
- ↑ Pennsylvania's 'Race to the Top' Fueled by Effective Reforms, Strong Local Support
- ↑ Governor's Press Office release (January 20, 2010). "Pennsylvania's 'Race to the Top' Fueled by Effective Reforms, Strong Local Support,".
- ↑ PDE (2015). "TITLE II, PART A - TEACHER AND PRINCIAL TRAINING & RECRUITING".
- ↑ PDE (2015). "Federal Programs".
- ↑ PDE, Title IIA egrants 2012-13, 2012
- ↑ PDE, Title IIA egrants 2014-15, 2014
- ↑ US Department of Education (September 15, 2004). "Title III — Language Instruction for Limited English Proficient and Immigrant Students".
- ↑ PDE, English As A Second Language (ESL), 2015
- ↑ PDE (2015). "Title III Supplemental Program".
- ↑ PDE, Title III Grant Allocations 2014-15, 2014
- ↑ Pennsylvania Department of Education (2012). "Real Estate Tax Rates by School District 2012-13 Real Estate Mills".
- ↑ Katie Colaneri (June 11, 2015). "New pipeline could mean tax bonanza for NJ towns, but for Pa.? Not so much". State Impact NPR.org.
- ↑ Pennsylvania Department of Education (2004). "Act 511 Tax Report".
- ↑ State Tax Equalization Board (2011). "State Tax Equalization Board About US".
- ↑ Pennsylvania Auditor General office - Bureau of Audits (February 2011). "A Special Performance Audit of the Pennsylvania State Tax Equalization Boards" (PDF).
- ↑ Pennsylvania Department of Education (2014). "Real Estate Tax Rates by School District 2014-15 Real Estate Mills".
- ↑ Pennsylvania Department of Education (2013). "Real Estate Tax Rates by School District 2013-14 Real Estate Mills".
- ↑ Pennsylvania Department of Education, Finances_Real Estate Tax Rates 2012-13, 2012
- ↑ Pennsylvania Department of Education (2011). "Real Estate Tax Millage by School District,".
- ↑ Pennsylvania Department of Education, Finances_Real Estate Tax Rates 2010-11, 2011
- ↑ The Times Tribune. (June 29, 2010). "Minersville School Board Approves Budget with no tax increase,".
- ↑ Pennsylvania Department of Education, Financial Elements Reports, 2010
- ↑ Pennsylvania Department of Education, Financial Elements Reports 2008-09 Real Estate Mills, 2009
- ↑ Pennsylvania Department of Education, Real Estate Tax Millage by School District, 2008
- ↑ Pennsylvania Department of Education, Real Estate Tax Millage by School District, 2006
- ↑ Pennsylvania Department of Education, Real Estate Tax Millage by School District, 2005
- ↑ Tax-rates.org., The 2015 Tax Resource County Property Taxes 2014, 2015
- ↑ Pennsylvania Department of Education, Pennsylvania School Finances - Summaries of Annual Financial Report Data 2010-11, 2011
- ↑ New Census Data on Property Taxes on Homeowners, Tax Foundation, September 22, 2009
- ↑ Tax Foundation, The facts on Pennsylvania’s Tax Climate, January 2015
- ↑ Pennsylvania Department of Education 2010-11 Act 1 of 2006 Referendum Exception Guidelines.
- ↑ Special Session Act 1 of 2006 School District Adjusted Index for 2006-2007 through 2010-2011, Report prepared by Pennsylvania Department of Education, May 2010.
- ↑ Pennsylvania Department of Education, 2012-2013 School District Adjusted Index, September 2011
- ↑ Pennsylvania Department of Education, 2013-2014 School District Adjusted Index, September 2012
- ↑ Pennsylvania Department of Education, 2014-2015 School District Adjusted Index, September 2013
- ↑ Pennsylvania Department of Education, 2015-2016 School District Adjusted Index, September 2014
- ↑ Pennsylvania Department of Education (September 5, 2015). "2016-2017 School District Adjusted Index,".
- ↑ Pennsylvania Department of Education (2015). "Property Tax Relief".
- ↑ Pennsylvania Department of Education (April 2016). "Report on Referendum Exceptions For School Year 2016-2017" (PDF).
- ↑ Pennsylvania Department of Education (April 2015). "Taxpayer Relief Act Special Session Act 1 of 2006 Report on Referendum Exceptions For School Year 2015-2016" (PDF).
- ↑ Pennsylvania School Employees, Retirement System, PSERS Chart showing payment mandates 2007-2020, 2014
- ↑ Pennsylvania Department of Education (April 30, 2014). "Report on Referendum Exceptions For School Year 2014-2015".
- ↑ Scarcella, Frank and Pursell, Tricia, Local school tax assessments exceed state averages. The Daily Item, May 25, 2010
- ↑ Pennsylvania Department of Education (May 1, 2014). "2014-2015 Estimated State Property Tax Relief per Homestead".
- ↑ Pennsylvania Gaming Control Board (2014). "Gaming Benefits for Pennsylvanians".
- ↑ Tax Relief per Homestead 2009, Pennsylvania Department of Education Report May 1, 2009
- ↑ Special Report Pennsylvania Property Tax Relief, Auditor General Office, 2-23-2010.
- ↑ Tax Relief per Homestead 5-1-10. Report Pennsylvania Department of Education, May 2010
- ↑ Department of Revenue (2014). "Property Tax/Rent Rebate Program".
- ↑ PDE Minersville ASD Enrollment and Projections. January 2009
- ↑ Research Analyzes Rural School District Enrollment and Building Capacity
- ↑ "Research Analyzes Rural School District Enrollment and Building Capacity", The Center for Rural Pennsylvania. October 2009.
- ↑ Pennsylvania Legislative Budget and Finance Committee, Study of the Cost Effectiveness of Consolidating Pennsylvania School Districts, 2007.
- ↑ Minersville Area School Board, Extracurriculars Policy 123, 2005
- ↑ Minersville area School Board, Interscholastic Athletics Policy 122, 2005
- ↑ Pennsylvania Interscholastic Athletic Association (2015). "KNOW YOUR ELIGIBILITY RULES".
- ↑ Pennsylvania Office of the Governor Press Release (November 10, 2005). "Home-Schooled, Charter School Children Can Participate in School District Extracurricular Activities".
- ↑ Eleanor Chute., New Pa. law expands clearance requirements for school volunteers, employees, Pittsburgh Post-Gazette, December 15, 2014
- ↑ Pennsylvania General Assembly (2014). "ACT 126 – Child Abuse Recognition and Reporting Act".
- ↑ Ali Stevens., Child Protective Services Law impacts schools, WKOK.com 1070AM, January 6, 2015
- ↑ Minersville Area School Board, Minersville Area School District Teacher Union Contract, 2012
- ↑ Pennsylvania Department of Education (2013). "Interscholastic Athletic Opportunities Disclosure Form" (PDF).
- ↑ PA General Assembly, (July 1, 2012). "Senate Bill 200 of Session 2011 Safety in Youth Sports Act".
- ↑ UMPC Sports Medicine (2014). "Managing Concussions in Student Athletes: The Safety in Youth Sports Act".
- ↑ Pennsylvania Interscholastic Athletics Association (2016). "PIAA School Directory".
Schuylkill County, Pennsylvania Schools | |||||||||||||||||||||||||||||||||||||||||||||
|---|---|---|---|---|---|---|---|---|---|---|---|---|---|---|---|---|---|---|---|---|---|---|---|---|---|---|---|---|---|---|---|---|---|---|---|---|---|---|---|---|---|---|---|---|---|
| |||||||||||||||||||||||||||||||||||||||||||||
| |||||||||||||||||||||||||||||||||||||||||||||