Nuneaton and Bedworth
| Nuneaton and Bedworth Borough of Nuneaton and Bedworth | |
|---|---|
| Borough & Non-metropolitan district | |
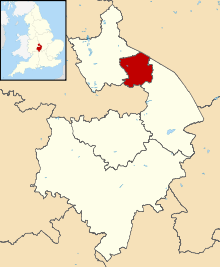 Shown within Warwickshire | |
| Sovereign state | United Kingdom |
| Constituent country | England |
| Region | West Midlands |
| Administrative county | Warwickshire |
| Admin. HQ | Nuneaton |
| Government | |
| • Type | Non-metropolitan borough |
| • Leadership: | Leader and cabinet |
| • MPs |
Marcus Jones Craig Tracey Mark Pawsey |
| Area | |
| • Total | 30.48 sq mi (78.95 km2) |
| Area rank | 243rd |
| Population (mid-2014 est.) | |
| • Total | 126,174 |
| • Rank | Ranked 169th |
| • Density | 4,100/sq mi (1,600/km2) |
| Time zone | Greenwich Mean Time (UTC+0) |
| • Summer (DST) | British Summer Time (UTC+1) |
| Postcode | CV7, CV10, CV11, CV12 |
| ONS code |
44UC (ONS) E07000219 (GSS) |
| Ethnicity |
91.4% White (88.9% White British) 6.2% Asian 1.1% Mixed race 0.8% Black 0.5% Other [1] |
| Website | Nuneaton and Bedworth |
Nuneaton and Bedworth is a local government district with borough status, in northern Warwickshire, England, consisting of the densely populated towns of Nuneaton and Bedworth, the village of Bulkington and the green belt land in between. It has a population of just over 120,000.
It borders the Warwickshire districts of Rugby to the east, and North Warwickshire to the west. To the south it borders the county of West Midlands, and to the north Leicestershire.
As of the most recent local election, Labour had majority control of the council.
History
The Nuneaton and Bedworth district was created on 1 April 1974 by the Local Government Act 1972. It was from the merger of the municipal borough of Nuneaton and the urban district of Bedworth (which included Bulkington). The new district was originally named just "Nuneaton"; however, objections from Bedworth residents led to it being renamed "Nuneaton & Bedworth" in 1980.[2]
Nuneaton had gained the status of a municipal borough in 1907,[3] and Bedworth had gained the status of an urban district in 1928.[4] In 1938, Bulkington became part of the Bedworth Urban District. Borough status was conferred upon the new district of Nuneaton and Bedworth on 15 November 1976.
In 2008, after 34 years of Labour Party control, the ruling Labour council lost to the Conservative Party, who gained the four seats needed to gain control; the BNP also gained two seats on the new council (their first ever seats in the borough), but lost one seat to the Labour Party in a by-election held in December 2009. The Labour Party won two seats from the Conservative Party in the 2010 local elections, leaving the council under no overall control, but led by the Labour group (as the largest party).[5] The 2012 local election saw Labour regain majority control of the council. Labour maintained majority control after the 2014 local election.
Subdivisions
Nuneaton and Bedworth is divided into 17 wards, each represented by 2 councillors, giving a total of 34 councillors. The borough has no civil parishes.
| Ward name | Approximate coverage | Population (2001 census) |
Population (2011 census) |
|---|---|---|---|
| Abbey | Abbey Green, Nuneaton town centre | 7,234 | 8,717 |
| Arbury | Heath End, Glendale, Bermuda, Arbury | 5,482 | 6,736 |
| Attleborough | Attleborough, Maple Park, SW Whitestone | 7,564 | 7,676 |
| Bar Pool | Black-a-Tree, Sunnyside, Stockingford (east) | 7,451 | 7,452 |
| Bede | Collycroft (east), Furnace Fields (north), Bedworth town centre, Burnside, Water Tower estate | 6,760 | 6,666 |
| Bulkington | Bulkington, Weston-in-Arden, Ryton, Marston Jabbett, Bramcote (west) | 6,303 | 6,146 |
| Camp Hill | Camp Hill | 7,325 | 7,321 |
| Exhall | Exhall (west), Ash Green, Keresley End | 7,381 | 8,006 |
| Galley Common | Galley Common, Chapel End, Whittleford | 7,593 | 8,233 |
| Heath | Bedworth Heath, Goodyers End, Market End | 6,377 | 7,473 |
| Kingswood | Grove Farm, Robinson's End, Stockingford (west) | 6,878 | 6,878 |
| Poplar | Furnace Fields (south), Coalpit Field, Exhall (east), Hawkesbury | 6,850 | 8,043 |
| St Nicolas | Horeston Grange, Hinckley Road, The Long Shoot, St Nicolas Park (south) | 7,073 | 6,943 |
| Slough | Collycroft (west), Mount Pleasant, Bedworth Woodlands, Woodland Park | 7,058 | 7,041 |
| Weddington | Weddington, St Nicolas Park (north) | 7,286 | 7,256 |
| Wem Brook | Hill Top, Caldwell, Chilvers Coton | 7,082 | 7,787 |
| Whitestone | Whitestone (except SW part), Attleborough Fields | 7,435 | 6,877 |
| TOTAL | NUNEATON & BEDWORTH | 119,132 | 125,252 |
For a sortable list of wards in Nuneaton and Bedworth by population, see List of wards in Nuneaton and Bedworth by population.
Council affiliation
After the 2016 local election, the political make up of the council was as follows: [6]
| Party | Number of councillors |
|---|---|
| Labour | 25 |
| Conservative | 7 |
| Green | 2 |
For past results, see Nuneaton and Bedworth Borough Council elections.
Twinnings
Nuneaton and Bedworth is twinned with:
References
- ↑ http://www.ons.gov.uk/ons/rel/census/2011-census/key-statistics-for-local-authorities-in-england-and-wales/rft-table-ks201ew.xls
- ↑ Bedworth society - Timeline
- ↑ visionofbritain.org.uk
- ↑ visionofbritain.org.uk
- ↑ 2010 Local Election Results
- ↑ http://www.nuneatonandbedworth.gov.uk/info/200038/elections_and_voting/298/election_results/2
External links
Districts of the West Midlands Region | ||
|---|---|---|
| Herefordshire |  | |
| Shropshire | ||
| Staffordshire | ||
| Warwickshire | ||
| West Midlands | ||
| Worcestershire | ||
Coordinates: 52°31′18″N 1°28′03″W / 52.5218°N 1.4676°W