Quebec general election, 1981
| | |||||||||||||||||||||||||||||||||||||||||||||||||||||||||||||||
| |||||||||||||||||||||||||||||||||||||||||||||||||||||||||||||||
| |||||||||||||||||||||||||||||||||||||||||||||||||||||||||||||||
| |||||||||||||||||||||||||||||||||||||||||||||||||||||||||||||||
.jpg)
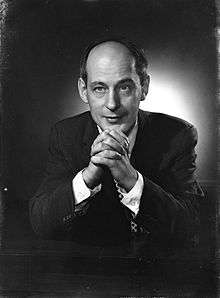
The Quebec general election of 1981 was held on April 13, 1981, to elect members of the National Assembly of the Province of Quebec, Canada. The incumbent Parti Québécois, led by René Lévesque, won re-election, defeating the Quebec Liberal Party, led by Claude Ryan.
The PQ won re-election despite having lost the 1980 Quebec referendum on sovereignty-association, the party's proposal for political independence for Quebec in an economic union with the rest of Canada. To some extent, they were helped by Claude Ryan's old-fashioned campaign style: he refused to tailor sound bites for the evening news and ran a campaign generally unsuited for television coverage. Despite finishing only three percent behind the PQ, the Liberals still finished a distant second, with 42 seats to the PQ's 80.
The Union Nationale, which had won 11 seats in a modest comeback in the 1976 general election, was reduced to five seats at dissolution by numerous floor crossings, retirements and resignations. Among the departures was that of its leader in the 1976 election, Rodrigue Biron, who crossed the floor to the PQ. The once-proud party lost all of its remaining seats, never to return. The party essentially ended at this point, though it lingered in desultory fashion until 1989.
Results
The overall results were:[1]
| Party | Party leader | # of candidates |
Seats | Popular vote | |||||
|---|---|---|---|---|---|---|---|---|---|
| 1976 | Elected | % Change | # | % | % Change | ||||
| Parti Québécois | René Lévesque | 122 | 71 | 80 | +12.7% | 1,773,237 | 49.26% | +7.89% | |
| Liberal | Claude Ryan | 122 | 26 | 42 | +53.8% | 1,658,753 | 46.07% | +12.29% | |
| Union Nationale | Roch LaSalle | 121 | 11 | - | -100% | 144,070 | 4.00% | -14.20% | |
| Workers Communist | Roger Rashi | 33 | * | - | * | 4,956 | 0.14% | * | |
| Freedom of Choice | Duncan McDonald | 12 | * | - | * | 4,955 | 0.14% | * | |
| Marxist–Leninist | Robert Verrier | 40 | * | - | * | 3,299 | 0.09% | * | |
| Libertarian | Victor Levis | 10 | * | - | * | 3,178 | 0.09% | * | |
| United Social Credit | Jean-Paul Poulin | 16 | * | - | - | 1,284 | 0.04% | * | |
| Workers | 10 | * | - | * | 1,027 | 0.03% | * | ||
| Communist | Sam Walsh | 10 | * | - | * | 768 | 0.02% | * | |
| Independents/no designation | 29 | 4,570 | 0.12% | ||||||
| Total | 525 | 110 | 122 | +10.9% | 3,600,097 | 100% | |||
Note:
* Party did not nominate candidates in the previous election or information not available.
See also
- List of Quebec premiers
- Politics of Quebec
- Timeline of Quebec history
- List of Quebec political parties
- 32nd National Assembly of Quebec
External links
References
- ↑ "Résultats officiels par parti politique pour l'ensemble des circonscriptions". Directeur général des élections du Québec. Retrieved 2012-01-31.
| General elections | |
|---|---|
| Referendums | |
See also: List of Quebec by-elections | |