Radial tree
A radial tree, or radial map, is a method of displaying a tree structure (e.g., a tree data structure) in a way that expands outwards, radially. It is one of many ways to visually display a tree,[2][3] with examples extending back to the early 20th century.[4] In use, it is a type of information graphic.

Comparison to other layouts
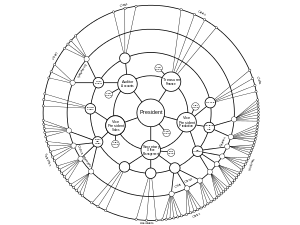
In a simple case, the first node is at the top, and the linked nodes are beneath. As each node typically has more than one child, the resulting shape is relatively triangular. In a radial layout, instead of each successive generation being displayed a row below, each generation is displayed in a new, outer orbit.
Since the length of each orbit increases with the radius, there tends to be more room for the nodes. A radial tree will spread the larger number of nodes over a larger area as the levels increase. We use the terms level and depth interchangeably.[5] Nevertheless, the number of nodes increases exponentially with the distance from the first node, whereas the circumference of each orbit increases linearly, so by the outer orbits, the nodes tend to be packed together.
Basic layout
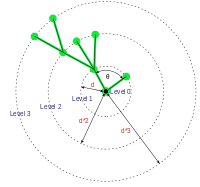
The overall distance "d" is the distance between levels of the graph. It is chosen so that the overall layout will fit within a screen. Layouts are generated by working outward from the center, root. The first level is a special case because all the nodes have the same parent. The nodes for level 1 can be distributed evenly, or weighted depending on the number of children they have. For subsequent levels, the children are positioned within sectors of the remaining space, so that child nodes of one parent do not overlap with others.
There are a many extensions to this algorithm to create more visually balanced layouts, to allow a user to navigate from node to node (changing the center),[6] or accommodate node labels and mix force-directed layouts with radial layouts.[7]
The layout has some similarities to a hyperbolic tree, though a key difference is that hyperbolic trees are based on hyperbolic geometry, whereas in a radial tree the distance between orbits is relatively linear.
Examples
- MindManager and MindMapper are mindmapping systems, which can make radial-like layouts, though are not radial beyond the 2nd level.
- SpicyNodes is an approach to visualizing hierarchies, which allows moving from node to node.
References
- ↑ W. H. Smith., Graphic Statistics in Management (McGraw-Hill Book Company, New York, ed. First, 1924) http://www.visualcomplexity.com/vc/project.cfm?id=10
- ↑ Various 2-D radial graph and network visualizations, from SpicyNodes documentation
- ↑ http://www.visualcomplexity.com/vc/project.cfm?id=26
- ↑ http://www.visualcomplexity.com/vc/project.cfm?id=289
- ↑ Greg Book & Neeta Keshary. "Radial Tree Graph Drawing Algorithm for Representing Large Hierarchies." University of Connecticut December 2001
- ↑ Yee, K.-P, D. Fisher, R. Dhamija, & M. Hearst. “Animated Exploration of Dynamic Graphs with Radial Layout”. Proc. Information Visualization, 43-50, 2001.
- ↑ Douma, Michael, Greg Ligierko, Ovidiu Ancuta, P. Gritsai, and S. Liu. SpicyNodes: Radial Layout Authoring for the General Public. InfoVis 2009. Atlantic City, NJ. October 2009. Presentation.
External links
- Comprehensive survey and bibliography of Tree Visualization techniques
- Chris Harrison – WikiViz: Visualizing Wikipedia
- Radial maps at "Visual Complexity" site