Sainte-Barbe, Quebec
| Sainte-Barbe | |
|---|---|
| Municipality | |
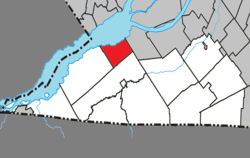 Location within Le Haut-Saint-Laurent RCM | |
 Sainte-Barbe Location in southern Quebec | |
| Coordinates: 45°10′N 74°12′W / 45.167°N 74.200°WCoordinates: 45°10′N 74°12′W / 45.167°N 74.200°W[1] | |
| Country |
|
| Province |
|
| Region | Montérégie |
| RCM | Le Haut-Saint-Laurent |
| Constituted | June 12, 1882 |
| Government[2][3] | |
| • Mayor | Louise Lebrun |
| • Federal riding | Beauharnois—Salaberry |
| • Prov. riding | Huntingdon |
| Area[2][4] | |
| • Total | 67.50 km2 (26.06 sq mi) |
| • Land | 40.24 km2 (15.54 sq mi) |
| Population (2011)[4] | |
| • Total | 1,403 |
| • Density | 34.9/km2 (90/sq mi) |
| • Pop 2006-2011 |
|
| • Dwellings | 790 |
| Time zone | EST (UTC−5) |
| • Summer (DST) | EDT (UTC−4) |
| Postal code(s) | J0S 1P0 |
| Area code(s) | 450 and 579 |
| Highways |
|
| Website |
www |
Sainte-Barbe is a municipality of Quebec, located within Le Haut-Saint-Laurent Regional County Municipality in the Montérégie administrative region. The population as of the Canada 2011 Census was 1,403.
Geography
Communities
The following locations reside within the municipality's boundaries:[1]
- Pointe-Biron (45°10′33″N 74°14′43″W / 45.17583°N 74.24528°W) – a residential area on the south shore of the Saint Lawrence River along Route 132.
- Pointe-Lalonde (45°10′33″N 74°13′57″W / 45.17583°N 74.23250°W) – a residential area on the south shore of the Saint Lawrence River along Route 132.
Lakes & Rivers
The following waterways pass through or are situated within the municipality's boundaries:[1]
- Saint Lawrence River – situated at municipality's northern boundary.
Demographics
Population
| Canada census – Sainte-Barbe, Quebec community profile | |||
|---|---|---|---|
| 2011 | 2006 | 2001 | |
| Population: | 1,403 (-3.4% from 2006) | 1,453 (+8.6% from 2001) | 1,338 (+4.8% from 1996) |
| Land area: | 40.24 km2 (15.54 sq mi) | 40.24 km2 (15.54 sq mi) | 40.24 km2 (15.54 sq mi) |
| Population density: | 34.9/km2 (90/sq mi) | 36.1/km2 (93/sq mi) | 33.3/km2 (86/sq mi) |
| Median age: | 47.1 (M: 47.3, F: 46.8) | 43.9 (M: 44.5, F: 43.0) | 41.7 (M: 41.3, F: 41.9) |
| Total private dwellings: | 790 | 848 | 850 |
| Median household income: | $48,371 | $45,956 | $39,351 |
| References: 2011[4] 2006[5] 2001[6] | |||
| Historical Census Data - Sainte-Barbe, Quebec[7] | ||||||||||||||||||||||||||
|---|---|---|---|---|---|---|---|---|---|---|---|---|---|---|---|---|---|---|---|---|---|---|---|---|---|---|
|
|
| ||||||||||||||||||||||||
Language
| Canada Census Mother Tongue - Sainte-Barbe, Quebec[7] | ||||||||||||||||||
|---|---|---|---|---|---|---|---|---|---|---|---|---|---|---|---|---|---|---|
| Census | Total | French |
English |
French & English |
Other | |||||||||||||
| Year | Responses | Count | Trend | Pop % | Count | Trend | Pop % | Count | Trend | Pop % | Count | Trend | Pop % | |||||
| 2011 |
1,395 |
1,325 | |
94.98% | 60 | |
4.30% | 5 | |
0.36% | 5 | |
0.36% | |||||
| 2006 |
1,445 |
1,335 | |
92.39% | 95 | |
6.57% | 0 | |
0.00% | 15 | |
1.04% | |||||
| 2001 |
1,325 |
1,225 | |
92.45% | 65 | |
4.91% | 20 | |
42.9% | 15 | |
50.0% | |||||
| 1996 |
1,275 |
1,210 | n/a | 98.75% | 30 | n/a | 0.69% | 35 | n/a | 0.33% | 10 | n/a | 0.23% | |||||
See also
References
- 1 2 3 Reference number 404650 of the Commission de toponymie du Québec (French)
- 1 2 Ministère des Affaires municipales, des Régions et de l'Occupation du territoire: Sainte-Barbe
- ↑ Riding history for Beauharnois—Salaberry, Quebec from the Library of Parliament
- 1 2 3 2011 Statistics Canada Census Profile: Sainte-Barbe, Quebec
- ↑ "2006 Community Profiles". Canada 2006 Census. Statistics Canada. March 30, 2011. Retrieved 2013-05-11.
- ↑ "2001 Community Profiles". Canada 2001 Census. Statistics Canada. February 17, 2012. Retrieved 2013-05-11.
- 1 2 Statistics Canada: 1996, 2001, 2006, 2011 census
 |
Saint Lawrence River Rivière-Beaudette |
Saint Lawrence River Saint-Zotique |
| |
| Saint-Anicet | |
Saint-Stanislas-de-Kostka | ||
| ||||
| | ||||
| Godmanchester |
| Cities | |
|---|---|
| Municipalities | |
| Parishes | |
| Townships | |
| |
This article is issued from Wikipedia - version of the 8/5/2016. The text is available under the Creative Commons Attribution/Share Alike but additional terms may apply for the media files.