Shikellamy School District
| Shikellamy School District | |
|---|---|
|
Shikellamy School District region shown in orange | |
| Address | |
|
200 Island Blvd Sunbury, Pennsylvania, Northumberland County 17801-1028 United States | |
| Information | |
| Type | Public |
| Closed | Sunbury Middle School, C.W. Rice Middle School, Edison School, Fort Augusta School, Maclay School |
| School board | 9 locally elected members |
| Superintendent |
Brett Misavage (contract March 11, 2016 - March 11, 2017)[1] |
| School number | (570) 286-3721 |
| Administrator |
Mrs. Abbey Walshaw-Wertz, Director of Education |
| Principal |
Michael Egan SHS[7] |
| Principal | Mrs. Mary Murphy-Kahn, SMS salary $87,061 (2013) |
| Principal | Gregg Wetzel, Priestley ES |
| Principal | Susan Giberson, Beck ES salary $90,561 (2013) |
| Principal |
Todd VanKirk, Chief Shik ES[8] |
| Staff | 130 non teaching staff members[10] |
| Faculty |
147 teachers (2013) |
| Grades | K-12 |
| Age | 5 years to 21 years old special education |
| Pupils |
2,855 pupils (2015)[12] |
| • Kindergarten | 251 (2014),[17] 238 (2012),[18] 218 pupils (2010) |
| • Grade 1 | 247 (2014),[19] 264 (2012), 227 (2010) |
| • Grade 2 | 219 (2014), 241 (2012), 219 |
| • Grade 3 | 255 (2014), 234 (2012), 192 |
| • Grade 4 | 220 (2014), 202 (2012), 215 |
| • Grade 5 | 225 (2014), 221 (2012), 226 |
| • Grade 6 | 203 (2014), 212 (2012), 212 |
| • Grade 7 | 221 (2014), 232 (2012), 232 |
| • Grade 8 | 208 (2014), 224 (2012), 219 |
| • Grade 9 | 237 (2014), 242 (2012), 249 |
| • Grade 10 | 198 (2014), 221 (2012), 225 |
| • Grade 11 | 181 (2014), 206 (2012), 204 |
| • Grade 12 | 190 (2014), 196 (2012), 217 (2010) |
| • Other | Enrollment projected to decline to 3,199 in 2020[20] |
| Language | English |
| Mascot | Braves |
| Budget |
$44.4 million (2016–17)[21] |
| Per pupil spending 2008 | $11,130[28] |
| Per pupil Spending 2010 | $12,598.16[29] |
| Website | http://www.shikbraves.org/ |
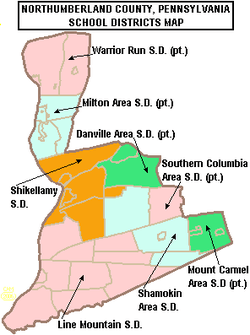
Shikellamy School District is a midsized, suburban/rural, public school district in Northumberland County, Pennsylvania. It serves Northumberland Borough, Point Township, Rockefeller Township, Snydertown Borough, the City of Sunbury, and Upper Augusta Township. The administrative offices are located at Administration Center, 200 Island Blvd, Sunbury, Pennsylvania. Shikellamy School District encompasses approximately 71 square miles (180 km2). According to 2000 federal census data, it served a resident population of 23,180.[30] Per the US Census Bureau, by 2010, the District's population declined to 22,554 people.[31] The educational attainment levels for the Shikellamy School District population 25 and over were 83.6% high school graduates and 15.3% college graduates.[32]
According to the Pennsylvania Budget and Policy Center, 45% of the Shikellamy School District’s pupils lived at 185% or below the Federal Poverty Level as shown by their eligibility for the federal free or reduced price school meal programs in 2012.[33] In 2013 the Pennsylvania Department of Education, reported that 37 students in the Shikellamy School District were homeless.[34]
In 2009, the District residents’ per capita income was $16,811, while the median family income was $40,063.[35] In the Commonwealth, the median family income was $49,501[36] and the United States median family income was $49,445, in 2010.[37] In Northumberland County, the median household income was $41,208.[38] By 2013, the median household income in the United States rose to $52,100.[39] In 2014, the median household income in the USA was $53,700.[40]
Per school district officials, in school year 2005-06, the Shikellamy School District provided basic educational services to 3,256 pupils through the employment of 229 teachers, 178 full-time and part-time support personnel, and 12 administrators. In 2006, the 3,104 student population was: 90% white, 4% black, < 1% Asian, Native American < 0.1% and 5% Hispanic.[41] By 2009-10, enrollment had declined to 2,850 pupils.[42] According to District officials, in school year 2009-10 Shikellamy School District employed: 229 teachers, 207 full-time and part-time support personnel, and 13 administrators. Shikellamy School District received more than $17.2 million in state funding in school year 2009-10. For school year 2014-2015, the District received $17,110,709 in state funding.
High school students may choose to attend the SUN Area Technical Institute for training in the construction and mechanical trades. The Central Susquehanna Intermediate Unit CSIU16 provides the District with a wide variety of services like: specialized education for disabled students; state mandated training on recognizing and reporting child abuse; speech and visual disability services; criminal background check processing for prospective employees and professional development for staff and faculty.
Governance
The Shikellamy School District is governed by 9 individually elected board members (serve four-year terms), the Pennsylvania State Board of Education, the Pennsylvania Department of Education and the Pennsylvania General Assembly.[43] The federal government controls programs it funds like Title I funding for low-income children in the Elementary and Secondary Education Act and the No Child Left Behind Act (renamed Every Student Succeeds Act (ESSA) in December 2015) which mandates the district focus its resources on student success in acquiring reading and math skills.[44] The school board is required by state law to post a financial report on the district in its website by March of each school year.[45]
The Superintendent and Business Manager are appointed by the school board. The Superintendent is the chief administrative officer with overall responsibility for all aspects of operations, including education and finance. The Business Manager is responsible for budget and financial operations. Neither of these officials are voting members of the School Board. Shikellamy School Board enters into individual employment contracts for these positions. These contracts must be in writing and are subject to public discloure under the state’s Right to Know Act. In Pennsylvania, public school districts are required to give 150 days notice to the Superintendent regarding renewal of the employment contract.[46] Pursuant to Act 141 of 2012 which amended the Pennsylvania School Code, all school districts that have hired superintendents on/after the fall of 2012 are required to develop objective performance standards and post them on the district’s website.[47]
The Commonwealth Foundation for Public Policy Alternatives Sunshine Review gave the school board and district administration a "D-" for transparency based on a review of "What information can people find on their school district's website". It examined the school district's website for information regarding; taxes, the current budget, meetings, school board members names and terms, contracts, audits, public records information and more.[48]
Schools
- Shikellamy High School grades 9th-12th
In May 2011, the Shikellamy School Board voted to close both middle schools due to three factors: declining enrollment district-wide; the need for costly, major renovations of the two middle school buildings and significant budget challenges for the foreseeable future. Beginning with the 2011-12 school year, sixth grade will be provided at each elementary school while seventh and eighth grades will be provided at the recently renovated and underutilized high school building. The superintendent reported that closing of the middle schools would save district taxpayers about $800,000.[49] C.W. Rice Middle School enrollment was 314 (2010). Sunbury Middle School enrollment was 355 students (2010). In the fall of 2013, the former Sunbury Middle School building and the 2.7 acres or property was sold at auction for $100,000 to Mark Walberg.[50] The School Board voted to build a new middle school building in 2013.[51][52]
Shikellamy Middle School grades 6th-8th
Opened on September 6, 2016 the Shikellamy Middle School replaced the closed Sunbury Middle School and CW Rice Middle school, built on the site of the latter. Cost of new building over $20 million to $22 million.[53]
Elementary Schools grades kindergarten through 5th
- Grace Beck Elementary School 273 pupils 2010[54]
- Chief Shikellamy Elementary School 298 pupils 2010[55]
- Oaklyn Elementary School 342 pupils 2010[56]
- Priestley Elementary School 373 pupils 2010[57]
Shikellamy High School students may choose to attend, the award winning SUN Area Technical Institute, in New Berlin, Union County for training in the building trades, culinary arts, mechanical trades, cosmetology, and allied health services. Costs for attending are paid by Shikellamy School District. The District provides transportation to and from the technical school each school day. The Central Susquehanna Intermediate Unit IU16 provides the District with a wide variety of services like specialized education for disabled students and hearing, speech and visual disability services and professional development for staff and faculty.
In 2015, 100 Shikellamy School District pupils attend full-time cyber school.[58] The District does not offer its own cyber school program. The pupils may attend any of the 13 cyber schools operating in Pennsylvania in 2015, including locally operated SusQ Cyber Charter School.[59]
Academic achievement
In 2016, Shikellamy School District ranked 276th out of 493 Pennsylvania public school districts, by the Pittsburgh Business Times.[60] The ranking is based on the last 3 years of student academic achievement as demonstrated by PSSAs results in: reading, writing, math and science and the three Keystone Exams (literature, Algebra 1, Biology I) in high school.[61] Three school districts were excluded because they do not operate high schools (Saint Clair Area School District, Midland Borough School District, Duquesne City School District). The PSSAs are given to all children in grades 3rd through 8th. Adapted PSSA examinations are given to children in the special education programs. Writing exams were given to children in 5th and 8th grades.
- 2015 - 324th[62]
- 2014 - 363rd[63]
- 2013 - 334th[64]
- 2012 - 371st[65]
- 2011 - 334th[66]
- 2010 - 383rd[67]
- 2009 - 380th[68]
- 2008 - 425th
- 2007 - 434th out of 501 school districts.[69]
- Overachievers ranking
The Pittsburgh Business Times also reported an Overachievers Ranking for 498 Pennsylvania school districts. Shikellamy ranked 352nd in 2010. In 2009, the district was 397th. The paper describes the ranking as: "a ranking answers the question - which school districts do better than expectations based upon economics? This rank takes the Honor Roll rank and adds the percentage of students in the district eligible for free and reduced-price lunch into the formula. A district finishing high on this rank is smashing expectations, and any district above the median point is exceeding expectations."[70]
Opportunity Scholarship Tax Credit Program
In July 2012, the Pennsylvania Department of Education released a report identifying two Shikellamy School District schools as among the lowest-achieving schools for reading and mathematics in 2011.[71] Grace S. Beck School and Chief Shikellamy School were on the 15% lowest-achieving schools in the Commonwealth of Pennsylvania. In 2013, Chief Shikellamy School was once again listed. Parents may be eligible for scholarships to transfer to another public or nonpublic school through the state's Opportunity Scholarship Tax Credit Program passed in June 2012. The scholarships are limited to those students whose family's income is less than $60,000 annually, with another $12,000 allowed per dependent. Maximum scholarship award is $8,500, with special education students receiving up to $15,000 for a year's tuition. Parents pay any difference between the scholarship amount and the receiving school's tuition rate. Students may seek admission to neighboring public school districts. Each year, the Pennsylvania Department of Education publishes the tuition rate for each individual public school district.[72] The two Shikellamy schools are the only ones in Northumberland County on the list. According to the state report, parents in 414 public schools (74 school districts) were offered access to these scholarships. For the 2012-13 school year, seven public school districts in Pennsylvania had all of their schools placed on the list, including: Sto-Rox School District, Chester Upland School District, Clairton City School District, Duquesne City School District, Farrell Area School District, Wilkinsburg Borough School District and Steelton-Highspire School District.[73] Funding for the scholarships comes from donations by businesses which receive a state tax credit for donating.[74]
In 2015, Chief Shikellamy School remained on the lowest achievement list.[75]
District AYP status
In 2012, Shikellamy School District declined to Warning Adequate Yearly Progress (AYP) status due to missing all but 1 academic metric measured in: reading, math and graduation rate.[76] In school years 2011 and 2010, Shikellamy School District achieved Adequate Yearly Progress (AYP) status.[77] In 2011, 94 percent of the 500 Pennsylvania public school districts achieved the No Child Left Behind Act progress level of 72% of students reading on grade level and 67% of students demonstrating on grade level math.[78] In 2011, 46.9 percent of Pennsylvania school districts achieved Adequate Yearly Progress (AYP) based on student performance. An additional 37.8 percent of school districts made AYP based on a calculated method called safe harbor, 8.2 percent on the growth model and 0.8 percent on a two-year average performance. School districts can achieve AYP even though their individual schools do not. For example: Shikellamy High School is in Corrective Action II in 2011.[79]
Shikellamy student proficiency in reading, math and science has trailed other students both in the region and in the state. The Shikellamy School District was in the bottom 17th percentile in the state, for academic achievement in 2009.[80]
Graduation rate
In 2015, Shikellamy School District's graduation rate improved to 84.31%.[81]
- 2014 - improved to 82%.[82]
- 2013 - 78%.[83]
- 2012 - declined to 77%.[84]
- 2011 - 79%.[85]
- 2010 - 79.25%, in 2010, the Pennsylvania Department of Education issued a new, 4-year cohort graduation rate.[86]
- 2009 - 78% [87]
- 2008 - 84% [88]
- 2007 - 78% [89]
- 2006 - 83% [90]
- 2005 - 81% [91]
Dr. Alan Lonoconus, then Superintendent of the Shikellamy School District, in a December 2007 interview on WKOK's Leaders and Lawmakers radio show said, "Where I envision us going is a lot of new curriculum revisions. With the State standards and everything we have to do with the state and Federal No Child Left Behind regulations, we have to really ramp up what we are doing."[92] In October 2009, Dr Lonoconus announced his resignation effective in November 2009.[93]
The District's policy is that if a student does not achieve proficiency on the PSSAs, a retest will be administered during the senior year for deficient subject areas. Failure to achieve proficiency in the retest requires a passing grade on a final examination and a passing course grade for any and all deficient subject areas reported by the Pennsylvania System of School Assessment. The student must pass both the course and the final examination in order to graduate. If a student fails to show evidence of this proficiency, the student can achieve a Shikellamy diploma by passing a summer school course or by returning for an additional school year to achieve a passing grade.[94]
The curriculum is currently under revision to align it with the 1999 Pennsylvania State Academic Standards.[95] These standards are assessed in the third through eighth and eleventh grades under the guise of the Pennsylvania System of School Assessment. These tests last several days and cover Reading, Writing, Speaking, Mathematics and Science. Revision of the Shikellamy School District's mathematics curriculum, to bring it into compliance with Chapter 4 regulations of 2000, was to begin in fall 2007.[96]
The poor academic performance of students in the District is evident beginning in 3rd grade with three of the four elementary schools far below the state average for reading.[97] Oaklyn Elementary School achieved 81% of 3rd graders on grade level in reading in 2009. Mathematics scores, for 3rd graders, were similarly low with Grace S. Beck School having 55% on grade level in math, in 2009. It was the lowest-performing school in the IU16 region. On the whole, 81% of Pennsylvania's third graders were on grade level in mathematics in 2009. In the local region's school 87% were on grade level.[98]
High school
Shikellamy High School is located at 600 Walnut Street, Sunbury. In 2013, enrollment was reported as 858 pupils in 9th through 12th grades, with 41% of pupils eligible for a free lunch due to family poverty. Additionally, 10% of pupils received special education services, while 1% of pupils were identified as gifted. The school employed 41 teachers.[99] Per the PA Department of Education, 100% of the teachers were rated "Highly Qualified" under the federal No Child Left Behind Act.
According to the National Center for Education Statistics, in 2011, the school reported an enrollment of 897 pupils in grades 9th through 12th, with 342 pupils eligible for a federal free or reduced price lunch due to the family meeting the federal poverty level. In 2011, the School employed 40 teachers yielding a student-teacher ratio of 22:1.[100] According to a report by the Pennsylvania Department of Education, 100% of the teachers were rated "Highly Qualified" under No Child Left Behind.[101]
- 2015 School Performance Profile
Shikellamy High School achieved 80 out of 100. The PDE reported that 76% of the High School’s students were on grade level in reading/literature. In Algebra 1, 67% of students showed on grade level skills at the end of the course. In Biology I, 68% demonstrated on grade level science understanding at the end of the course.[102] Statewide, 53 percent of schools with an eleventh grade achieved an academic score of 70 or better. Five percent of the 2,033 schools with 11th grade were scored at 90 and above; 20 percent were scored between 80 and 89; 28 percent between 70 and 79; 25 percent between 60 and 69 and 22 percent below 60. The Keystone Exam results showed: 73 percent of students statewide scored at grade-level in English, 64 percent in Algebra I and 59 percent in biology.[103][104]
- 2014 School Performance Profile
Shikellamy High School achieved 76.3 out of 100. Reflects on grade level reading, mathematics and science achievement. In reading/literature - 76,6% were on grade level. In Algebra 1, 70.9% showed on grade level skills at the end of the course. In Biology, just 57% showed on grade level science understanding at the end of the course.[105][106] According to the Pennsylvania Department of Education, 2,134 of 2,947 Pennsylvania public schools (72 percent of Pennsylvania public schools), achieved an academic score of 70 or higher.[107] Fifty-three percent of schools statewide received lower SPP scores compared with last year's, while 46 percent improved. A handful were unchanged.[108][109]
- 2013 School Performance Profile
In 2013, Shikellamy High School achieved 67.6 out of 100 in the State's School Performance Profile. The score reflects on grade level reading, mathematics and science achievement. In reading/literature - 76% were on grade level. In Algebra 1, 65.5% showed on grade level skills. In Biology, 46% showed on grade level science understanding.[110]
In 2011, Shikellamy High School was part of a research study of the effectiveness of the state's Project 720 School Reform funding grants. From 2007 through 2009, the School received a total of $209,941 in state supplemental funding to improve instruction at the school.[111]
AYP Status
In 2012, Shikellamy High School declined to Corrective Action II 2nd Year AYP status due to poor academic achievement in reading and math coupled with a declining graduation rate.[112]
- 2011 - declined to Corrective Action II 1st Year AYP status due to 11th grade Reading (63.5% on grade level), nor in Mathematics (53% on grade level). In science, 32% of students were on grade level.[113] These PSSA scores were below: the state level, AYP level and regional high school achievement. The high school remains in Corrective Action status. Under No Child Left Behind, students could transfer to an achieving school within the district, however the district operates just one high school.[114]
- 2010 - Making Progress: in Corrective Action I AYP status due to chronically low student academic achievement.
- 2009 - declined to Corrective Action I.[115] In 2009, Shikellamy High School ranked 464th out of 666 Pennsylvania high schools for the reading and mathematics achievement of its students and had its 80th bicentennial.[116] In 2009, 45% of Shikellamy High School 11th graders were on-grade level in mathematics.[117] With the 2009 graduation rate decline to 78%, Shikellamy High School was placed on Corrective Action I with the Pennsylvania Department of Education.
- 2008 - Making Progress - School Improvement Level II AYP status. in 2008, Shikellamy High School ranked 384th out of 606 public high schools in Pennsylvania. The 2008 11th grade math, reading and science scores remained low and were lower than other school districts in the Central Susquehanna Valley IU16 region.[118]
- 2007 - declined to School Improvement Level II[119]
- 2006 - declined to School Improvement Level I[120]
- 2005 - declined to Warning AYP Level[121]
In 2005, Shikellamy High School was ranked 384th out of 606 public high schools in Pennsylvania.[122] In 2006, SHS was ranked 384th out 607 Pennsylvania high schools.[123]
- PSSA results
Pennsylvania System of School Assessments, commonly called PSSAs are No Child Left Behind Act related examinations which were administered from 2003 through 2012, in all Pennsylvania public high schools. The exams were administered in the Spring of each school year. The goal was for 100% of students to be on grade level or better in reading and mathematics, by the Spring of 2014. The tests focused on the state's Academic Standards for reading, writing, mathematics and science. The Science exam included content in science, technology, ecology and the environmental studies. The mathematics exam included: algebra I, algebra II, geometry and trigonometry. The standards were first published in 1998 and are mandated by the Pennsylvania State Board of Education.[124] In 2013, the Commonwealth of Pennsylvania changed its high school assessments to the Keystone Exams in Algebra 1, Reading/literature and Biology1. The exams are given at the end of the course, rather than all in the spring of the student's 11th grade year.[125]
11th Grade Reading:
- 2012 - 53% on grade level, (25% below basic). State - 67% of 11th graders are on grade level.[126]
- 2011 - 52% (21% below basic). State - 69.1%[127]
11th Grade Math:
- 2012 - 59% on grade level (22% below basic). In Pennsylvania, 59% of 11th graders are on grade level.[128]
- 2011 - 62% (18% below basic). State - 60.3% [129]
11th Grade Science:
- 2012 - 38% on grade level (14% below basic). State - 42% of 11th graders were on grade level.[130]
- 2011 - 32% (15% below basic). State - 40%[131]
ACE
Shikellamy School District students have access to Bloomsburg University's Summer College and Advanced College Experience (ACE) during the summer of their sophomore, junior and senior years (after high school graduation). Tuition is deeply discounted to 75% of the regular student rate.[132] Successful students earn college credits that can be readily transferred to other Pennsylvania public colleges and universities through the Pennsylvania Transfer and Articulation Center (PA TRAC) system.[133]
Middle school
In 2012 through 2014, Shikellamy Middle School was housed in the same building as the high school. It provided grades 7th and 8th. In 2014, enrollment was 442 pupils, with 47% of pupils eligible for a free lunch due to family poverty. Additionally, 17.8% of pupils received special education services, while 2.5% of pupils were identified as gifted.[134]
- 2015 School Performance Profile
The PDE reported that 62% of 8th grade students at Shikellamy Middle School students were on grade level in reading on the PSSAs given in April 2015. In math/Algebra 1, 34.5% of 8th grade students showed on grade level skills. In science, 74% of the school’s 8th graders demonstrated on grade level science understanding. No eighth grade writing scores were reported. In 7th grade, 61% were on grade level in reading, while 37.6% showed on grade level math skills.[135] Statewide 58% of eighth (8th) graders were on grade level in reading, while 29% demonstrated on grade level math skills. Pennsylvania 7th graders were58% on grade level in reading and 33% demonstrated on grade level math skills.[136]
- 2014 School Performance Profile
Shikellamy Middle School achieved 87.2 out of 100. Reflects on grade level reading, mathematics and science achievement. In reading/literature - 72% were on grade level. In Algebra 1/Math, 75.8% showed on grade level mathematics skills. In Science, 66.5% of 8th graders showed on grade level science understanding. In writing, 85% of the 8th grade students demonstrated on grade level writing skills.[137]
- 2013 School Performance Profile
Shikellamy Middle School achieved 84 out of 100. Reflects on grade level reading, writing, mathematics and science achievement. In reading, just 65% of the students were on grade level. In Mathematics/Algebra 1, 72% of the students showed on grade level skills. In Science, only 57.5% of the 8th graders demonstrated on grade level understanding. In writing, 83% of the 8th grade students demonstrated on grade level writing skills.[138] According to the Pennsylvania Department of Education, 2,181 public schools (less than 73 percent of Pennsylvania public schools), achieved an academic score of 70 or higher.
- AYP status
In 2012, Shikellamy Middle School was in Warning AYP status due to low student achievement in reading and mathematics.[139]
- PSSA Results
Seventh grades have been tested in reading and mathematics since 2006. Eighth graders are tested in: reading, writing, mathematics and Science. Beginning in the Spring of 2013, eighth graders, who are enrolled in Algebra I take the Keystone Exam for Algebra I at the end of the course. The testing of 8th grade in reading and mathematics began in 1999, as a state initiative.[140] Testing in science began in 2007. The goal is for 100% of students to be on grade level or better in reading and mathematics, by the Spring of 2014. The tests focus on the state's Academic Standards for reading, writing, mathematics and science.[141] The standards were published in 1998 and are mandated by the Pennsylvania State Board of Education.[124] In 2014, the Commonwealth adopted the Pennsylvania Core Standards - Mathematics.[142]
Eighth grade Reading 2012 - 79% on grade level, (5% below basic). State - 79%[143]
Eighth grade Mathematics 2012 - 80%, (10% below basic). State - 76%
Eighth grade Science 2012 - 75%, (13% below basic). State - 59% [144]
- Seventh grade
Reading - 58% on grade level (15% below basic). State - 76% Math - 70%, (8% below basic). State - 80%
- Dropout Early Warning System
In 2013, Shikellamy School District did not implement the state's free dropout prevention Early Warning System and Interventions Catalog.[145] The process identifies students at risk for droping out by examining the pupil’s: attendance, behavior and course grades. Interventions are implemented to assist at-risk pupils to remain in school. The program is funded by federal and private dollars.[146]
Grace S. Beck School
Grace S. Beck School is located at 600 Arch Street, Sunbury. In 2014, Grace S Beck School's enrollment was 359 pupils in grades kindergarten through 6th, with 75% of pupils receiving a federal free or reduced price meals due to family poverty. Additionally, 18% of the pupils receive special education services, while less than 1% are identified as gifted.[147] According to a report by the Pennsylvania Department of Education, 100% of the teachers were rated highly qualified under No Child Left Behind. The school provides full day kindergarten.[148] The school is a federally designated Title I school.
According to the National Center for Education Statistics, in 2011, the school reported an enrollment of 343 pupils in grades kindergarten through 6th, with 74% of its pupils receiving a federal free or reduced price lunch due to family poverty. The school is a federally designated Title I school. The school had a student-teacher ratio of 18:1.[149] According to a report by the Pennsylvania Department of Education, 100% of its teachers were rated "Highly Qualified" under No Child Left Behind.[150] The School provides full day kindergarten since 2007.[151]
- 2015 School Performance Profile
Among Grace S. Beck School 6th graders, 65% were on grade level in reading and 53% were on grade level in mathematics on the PSSAs given in April 2015.. According to the Pennsylvania Department of Education, 65.3% of 5th grade students were on grade level in reading. In mathematics, 37% of 5th grade students showed on grade level skills. No fifth grade writing scores were reported. In 4th grade, 41% were on grade level in reading, while 14.7% showed on grade level math skills. In science, 61.8% of fourth graders showed on grade level understanding. Among third (3rd) graders, only 34% were on grade level in reading and 26% were on grade level in mathematics.[152] Statewide 61.9% of fifth (5th) graders were on grade level in reading, while 42.8% demonstrated on grade level math skills. Pennsylvania 4th graders were 58.6% on grade level in reading and 44.4% demonstrated on grade level math skills. In science, 77.3% of fourth graders showed on grade level understanding. Among Pennsylvania third (3rd) graders, 62% were reading on grade level, while 48.5% demonstrated on grade level math skills.[153]
- 2014 School Performance Profile
Grace S. Beck School achieved a score of 69.4 out of 100. The score reflects on grade level: reading, science, writing and mathematics achievement. In 2013-14, only 54% of the students were reading on grade level in grades 3rd through 5th. In 3rd grade, 48% of the pupils were reading on grade level. In math, 68.7% were on grade level (3rd-5th grades). In 4th grade science, just 68% of the pupils demonstrated on grade level understanding. In writing, only 57% of 5th grade pupils demonstrated on grade level skills.[154]
- 2013 School Performance Profile
Grace S. Beck School achieved 72 out of 100. The score reflects on grade level: reading, science and mathematics achievement. In 2012-13, only 54% of the students were reading on grade level in grades 3rd through 6th. In math, 68% were on grade level. In 4th grade science, just 73% of the pupils demonstrated on grade level understanding. In writing only 66% of pupils were on grade level.[155]
- AYP History
In 2012, Grace S Beck School achieved AYP status under No Child Left Behind Act.[156]
- 2011 - achieved AYP status due to improving scores over 2010 results.[157]
- 2010 - declined to Warning status due to the lagging student achievement.[158]
- 2009 - achieved AYP status.[159]
The attendance rate was 94% in 2011 and 96% in 2010.[160]
- PSSA Results
|
|
|
|
|
|
- 4th Grade Science:
- 2012 - 81%, (2% below basic). State - 82%
- 2011 - 65%, (11% below basic). State - 82.9%
- 2010 - 69%, State - 81.4%
- 2009 - 61%, State - 83% Ranks last in 4th grades in CSIU16 Region.[170]
- 2008 - 79%, State - 81%
|
|
Low income 3rd graders achievement 2010: [174]
- Reading - 50% on grade level, Advanced - 16.7%, Proficient - 33%. State - 61%
- Math - 73.4% on grade level, Advanced - 16.7%, Proficient - 56.7%. State - 74%
Chief Shikellamy School
Chief Shikellamy School is located at 338 Memorial Drive, Sunbury. In 2014, Chief Shikellamy School's enrollment was 375 pupils in grades kindergarten through 6th, with 82% of pupils receiving a federal free or reduced price meals due to family poverty. Additionally, 23.7% of the pupils receive special education services, while less than 1% are identified as gifted.[175] According to a report by the Pennsylvania Department of Education, 100% of the teachers were rated highly qualified under No Child Left Behind.[176] The school is a federally designated Title I school. The school provides full day kindergarten since 2007.[151]
According to the National Center for Education Statistics, in 2011, Chief Shikellamy School reported an enrollment of 372 pupils in grades kindergarten through 6th, with 81% of its pupils receiving a federal free or reduced price lunch due to family poverty. The school is a federally designated Title I school. The school had a student-teacher ratio of 14:1.[177] According to a report by the Pennsylvania Department of Education, 100% of its teachers were rated "Highly Qualified" under No Child Left Behind.[178]
- 2015 School Performance Profile
Among 6th graders at Chief Shikellamy School, 50% were reading on grade level and 35.5% were on grade level in mathematics. In 5th grade, 46% of students were on grade level in reading on the PSSAs given in April 2015. In mathematics, 50% of 5th grade students showed on grade level skills. No fifth grade writing scores were reported. In 4th grade, 50% were on grade level in reading, while 30% showed on grade level math skills. In science, 80% of fourth graders showed on grade level understanding. Among third (3rd) graders, 66% were on grade level in reading and 39% were on grade level in mathematics.[179]
- 2014 School Performance Profile
Chief Shikellamy School achieved a score of 75.1 out of 100. The score reflects on grade level: reading, science, writing and mathematics achievement. In 2013-14, only 53% of the students were reading on grade level in grades 3rd through 5th. In 3rd grade, 63.8% of the pupils were reading on grade level. In math, 65.5% were on grade level (3rd-5th grades). In 4th grade science, 82% of the pupils demonstrated on grade level understanding. In writing, only 71% of 5th grade pupils demonstrated on grade level skills.[180]
- 2013 School Performance Profile
Chief Shikellamy School achieved 69 out of 100. The score reflects on grade level: reading, science and mathematics achievement. In 2012-13, only 53% of the students were reading on grade level in grades 3rd through 6th. In math, 68% were on grade level. In 4th grade science, just 77% of the pupils demonstrated on grade level understanding. In writing only 54% of pupils were on grade level.[181]
- AYP History
In 2012, Chief Shikellamy declined to Warning AYP status due to lagging student achievement.[182]
- 2006 through 2010 - achieved AYP status.[183]
- 2005 - Making Progress in School Improvement I
- 2004 - declined to School Improvement I AYP level due to lagging reading achievement[184]
- 2003 - Warning AYP status due to lagging achievement
In 2011, Chief Shikellamy School's the attendance rate was 94%, while in 2010 the rate was 93%.[185]
|
|
|
|
|
|
- 4th Grade Science:
- 2012 - 73%, (6% below basic). State – 82%
- 2011 - 78%, (2% below basic). State – 82.9%
- 2010 - 76.7%, State - 81.4%
- 2009 - 81%, State - 83%
- 2008 - 82.5%, State - 81%
|
|
Low income 3rd graders achievement 2010:
- Reading - 63.3% on grade level, Advanced - 20%, Proficient - 43.3%, State - 61%
- Math - 76.7% on grade level, Advanced - 30%, Proficient - 46.7%, State - 74%
Oaklyn School
Oaklyn School is located at 115 Oak Street, Sunbury. In 2013, the school's enrollment was 436 pupils in grades kindergarten through sixth, with 34.8% of pupils receiving a federal free or reduced price meals due to family poverty. Additionally, 18% of the pupils receive special education services, while 2.98% are identified as gifted.[192] According to a report by the Pennsylvania Department of Education, 100% of the teachers were rated highly qualified under the federal No Child Left Behind Act.[193] The school is a federally designated Title I school. The school provides full day kindergarten since 2007.[151] In June 2014, then Principal Holly Judge resigned after being charged with drunk driving.
According to the National Center for Education Statistics, in 2012, enrollment was 426 pupils in grades kindergarten through 6th, with 138 pupils receiving a free or reduced price lunch. The School employed 21 teachers yielding a student-teacher ratio of 20:1.[194] The school was a federally designated Title I school. In 2010, Oaklyn Elementary School's enrollment was reported as 372 pupils in kindergarten through 5th grade.[195]
- 2015 School Performance Profile
Among Oaklyn School, 6th graders, 75% were on grade level in reading and 55% were on grade level in mathematics. Seventy-four percent of 5th grade students were on grade level in reading. In mathematics, 41% of 5th grade students showed on grade level skills. No fifth grade writing scores were reported. In 4th grade, 71% were on grade level in reading, while 46% showed on grade level math skills. In science, 92% of fourth graders showed on grade level understanding. Among third (3rd) graders, 75% were on grade level in reading and 64% were on grade level in mathematics.[196]
- 2014 School Performance Profile
Oaklyn School achieved a score of 82.4 out of 100. The score reflects on grade level: reading, science, writing and mathematics achievement. In 2013-14, only 77% of the students were reading on grade level in grades 3rd through 5th. In 3rd grade, 79% of the pupils were reading on grade level. In math, 79.8% were on grade level (3rd-5th grades). In 4th grade science, just 84% of the pupils demonstrated on grade level understanding. In writing, only 60% of 5th grade pupils demonstrated on grade level skills.[197]
- 2013 School Performance Profile
Oaklyn Elementary School achieved a score of 81.1 out of 100. The score reflects on grade level: reading, science, writing and mathematics achievement. In 2012-13, 77% of the students were reading on grade level in grades 3rd through 5th. In 3rd grade, 86% of the pupils were reading on grade level. In math, 79% were on grade level (3rd-6th grades). In 4th grade science, 87% of the pupils demonstrated on grade level understanding. In writing, only 65% of 5th grade pupils demonstrated on grade level writing skills.[198]
- AYP status
In 2003 through 2012, Oaklyn Elementary School achieved Adequate Yearly Progress (AYP) each school year.[199]
- PSSA History
In the Spring of each school year, the 3rd graders take the PSSAs in math and reading. The fourth grade is tested in reading, math and science. The fifth grade is evaluated in reading, mathematics and writing. Sixth grade is assessed in reading and mathematics.
|
6th Grade Reading:
|
6th Grade Math:
|
|
5th Grade Reading:
|
5th Grade Math:
|
|
|
- 4th Grade Science
- 2012 - 93%, (2% below basic). State - 82%
- 2011 - 82%, (2% below basic). State - 82.9%
|
|
Priestley Elementary School
Priestley Elementary School is located at 423 Cannery Road, Northumberland. In 2013, the School reported an enrollment 461 pupils in kindergarten through sixth grade, with 46.8% of the pupils receiving a federal free or reduced price meals due to family poverty. Additionally, 10.6% of the pupils receive special education services, while 2.17% are identified as gifted.[202] According to a report by the Pennsylvania Department of Education, 100% of the teachers were rated highly qualified under No Child Left Behind. The school provides full day kindergarten since 2007. The school was a Title I school.
According to the National Center for Education Statistics, in 2010, Priestley School enrollment was 383 pupils in kindergarten through 5th grade, with 38% of pupils eligible for a free or reduced price lunch.[203] The School employed 19 teachers yielding a student-teacher ratio of 19:1.
- 2015 School Performance Profile
According to the Pennsylvania Department of Education, Priestley School's 6th graders, 66% were on grade level in reading and 61.7% were on grade level in mathematics. Seventy percent of 5th grade students were on grade level in reading. In mathematics, 61% of 5th grade students showed on grade level skills. No fifth grade writing scores were reported. In 4th grade, 68.7% were on grade level in reading, while 42.8% showed on grade level math skills. In science, 82% of fourth graders showed on grade level understanding. Among Priestley School third (3rd) graders, 74% were reading on grade level and 53% demonstrated on grade level mathematics skills.[204]
- 2014 School Performance Profile
Priestley School achieved a score of 86.6 out of 100. The score reflects on grade level: reading, science, writing and mathematics achievement. In 2013-14, only 71% of the students were reading on grade level in grades 3rd through 5th. In 3rd grade, only 67% of the pupils were reading on grade level. In math, 83% were on grade level (3rd-5th grades). In 4th grade science, 85% of the pupils demonstrated on grade level understanding. In writing, only 65% of 5th grade pupils demonstrated on grade level skills.[205]
- 2013 School Performance Profile
Priestley Elementary School achieved a score of 75.1 out of 100. The score reflects on grade level: reading, science, writing and mathematics achievement. In 2012-13, only 70% of the students were reading on grade level in grades 3rd through 6th. In 3rd grade, 74% of the pupils were reading on grade level. In math, 78.6% were on grade level (3rd-6th grades). In 4th grade science, just 71% of the pupils demonstrated on grade level understanding. In writing, 80% of 5th grade pupils demonstrated on grade level writing skills.[206]
- AYP history
In 2003 through 2012 school years, Priestley Elementary School achieved AYP status each school year.[207]
- PSSA History
Each year, in the Spring, the 3rd graders take the PSSAs in math and reading. The fourth grade is tested in reading, math and science. The fifth grade is evaluated in reading, mathematics and writing. Sixth graders are tested in reading and math.
|
6th Grade Reading:
|
6th Grade Math:
|
|
5th Grade Reading:
|
5th Grade Math:
|
|
|
- 4th Grade Science
- 2012 - 91%, (2% below basic). State - 82%
- 2011 - 89%, (0% below basic). State - 82.9%
|
|
Special education
In December 2013, Shikellamy School District administration reported that 514 pupils or 17.2% of the District's pupils received Special Education services, with 42.4% of the identified students having a specific learning disability.[211] In December 2011, the Shikellamy School District administration reported that 469 pupils or 15.7% of the district's pupils received Special Education services, with 41% of the identified students having a specific learning disability.[212] In December 2009, Shikellamy School District administration reported that 423 pupils or 14.6% of the district's pupils received Special Education services, with 40.7% of the identified students having a specific learning disability. Special education services in the Commonwealth are provided to students from ages three years to 21 years old. In the 2010-11 school year, the total student enrollment was more than 1.78 million students with approximately 275,000 students eligible for special education services. Among these students 18,959 were identified with mental retardation and 21,245 students with autism.[213] The largest group of students are identified as Specific Learning Disabilities 126,026 students (46.9 percent) and Speech or Language Impairments with 43,542 students (16.2 percent).
In 2007, Pennsylvania Secretary of Education Gerald Zahorchak testified before the Pennsylvania House Education Committee regarding full day kindergarten. He claimed that districts which offered the program would see a significant decrease in special education students due to early identification and early intervention. He asserted the high cost of full day kindergarten would be recouped by Districts in lower special education costs.[214] Shikellamy School District has offered full day kindergarten since 2003. Shikellamy School District has seen an increase in the percentage of special education students it serves and has repeatedly sought an exception to raise taxes due to escalating special education costs. Full day kindergarten has yielding no savings.
In order to comply with state and federal Individuals with Disabilities Education Act rules and regulations, the school district engages in identification procedures to ensure that eligible students receive an appropriate educational program consisting of special education and related services, individualized to meet student needs. At no cost to the parents, these services are provided in compliance with state and federal law; and are reasonably calculated to yield meaningful educational benefit and student progress.[215] To identify students who may be eligible for special education services, various screening activities are conducted on an ongoing basis. These screening activities include: review of group-based data (cumulative records, enrollment records, health records, report cards, ability and achievement test scores); hearing, vision, motor, and speech/language screening; and review by the Special Education administration. When screening results suggest that the student may be eligible, the District seeks parental consent to conduct a multidisciplinary evaluation. Parents who suspect their child is eligible may verbally request a multidisciplinary evaluation from a professional employee of the District or contact the district's Special Education Department.[216][217] The IDEA 2004 requires each school entity to publish a notice to parents, in newspapers or other media, including the student handbook and website regarding the availability of screening and intervention services and how to access them.
In 2010, the state of Pennsylvania provided $1,026,815,000 for Special Education services. This funding is in addition to the state's basic education per pupil funding, as well as, all other state and federal funding.[218] The Special Education funding structure is through the federal Individuals with Disabilities Education Act (IDEA) funds and state appropriations. IDEA funds are appropriated to the state on an annual basis and distributed through intermediate units (IUs) to school districts, while state funds are distributed directly to the districts. Total funds that are received by school districts are calculated through a formula. The Pennsylvania Department of Education oversees four appropriations used to fund students with special needs: Special Education; Approved Private Schools; Pennsylvania Chartered Schools for the Deaf and Blind; and Early Intervention. The Pennsylvania Special Education funding system assumes that 16% of the district’s students receive special education services. It also assumes that each student’s needs accrue the same level of costs.[219] Over identification of students, in order to increase state funding, has been an issue in the Commonwealth. Some districts have more than 20% of its students receiving special education services while others have 10% supported through special education.[220] The state requires each public school district and charter school to have a three-year special education plan to meet the unique needs of its special education students.[221] In 2012, the Obama Administration's US Department of Education issued a directive that schools include students with disabilities in extracurricular activities, including sports.[222]
The Shikellamy School District (SSD) received a $1,769,952 supplement for special education services in 2010.[223] For the 2011-12, 2012–13 and 2013-14 school years, all Pennsylvania public school districts received the same level of funding for special education that they received in 2010-11. This level funding is provided regardless of changes in the number of pupils who need special education services and regardless of the level of services the respective students required.[224][225] Additionally, the state provides supplemental funding for extraordinarily impacted students. The District must apply for this added funding. For the 2014-2015 school year, SSD received an increase to $1,812,375 from the Commonwealth for special education funding.[226]
Gifted education
The District Administration reported that 31 or 1.09% of its students were gifted in 2009. The highest percentage of gifted students reported among all 500 school districts and 100 public charter schools in Pennsylvania was North Allegheny School District with 15.5% of its students identified as gifted.[227] By law, the district must provide mentally gifted programs at all grade levels. The referral process for a gifted evaluation can be initiated by teachers or parents by contacting the student’s building principal and requesting an evaluation. All requests must be made in writing. To be eligible for mentally gifted programs in Pennsylvania, a student must have a cognitive ability of at least 130 as measured on a standardized ability test by a certified school psychologist. Other factors that indicate giftedness will also be considered for eligibility.[228][229]
Budget
Pennsylvania public school districts budget and expend funds according to procedures mandated by the General Assembly and the Pennsylvania Department of Education (PDE). An annual operating budget is prepared by school district administrative officials. A uniform form is furnished by the PDE and submitted to the board of school directors for approval prior to the beginning of each fiscal year on July 1.
Under Pennsylvania’s Taxpayer Relief Act, Act 1 of the Special Session of 2006, all school districts of the first class A, second class, third class and fourth class must adopt a preliminary budget proposal. The proposal must include estimated revenues and expenditures and the proposed tax rates. This proposed budget must be considered by the Board no later than 90 days prior to the date of the election immediately preceding the fiscal year. The preliminary budget proposal must also be printed and made available for public inspection at least 20 days prior to its adoption. The board of school directors may hold a public hearing on the budget, but are not required to do so. The board must give at least 10 days’ public notice of its intent to adopt the final budget according to Act 1 of 2006.[230]
In June 2011, the school board approved a $36.2 million budget for 2011-12 that closed the two middle schools effective July 2011. The budget also froze administration pay and that reduced staffing by 24 positions.[231] Beginning in 2011-12, the sixth grades will remain at the elementary schools, while seventh and eighth grades will be provided at the high school.[232] The high school has been overstaffed, according to Superintendent Robin Musto, with 24 teachers not working a full teaching schedule and having 2 or more planning periods each day. Additionally, class size at the high school has been as low as 9 pupils for 15% of the classes, while many classes have 10-15 students.[233] According to the Pennsylvania Department of Education, enrollment in the Shikellamy School District has declined 12.5% over the past five years, to a low of 2800 pupils. In 2006, the enrollment was reported by the administration as 3200 pupils.
The Shikellamy School Board set the budget at $34.62 million for 2007-2008. The board levied a variety of taxes to support its programs. Taxes include 62.5 mills real estate tax in 2007.[234] Per capita taxes are $5 per resident. An occupational tax, which charges a set amount based on job title, earns approximately $1.7 million. Many see this tax as particularly unfair, as people classified in the same job title often earn vastly different amounts, but pay the same amount of tax. An earned income tax of one-half of 1 percent of income yields a revenue of approximately $1.8 million. Additionally, the real estate transfer tax of one-half percent (Northumberland Borough, Point Township, Rockefeller Township) and one percent (Snydertown borough) is levied on real estate transfers.[235]
In October 2015, Shikellamy School board and the Shikellamy teachers union entered into a contract that assures teachers a 3% raise each year June 2014 to June 2019.[236] Some adjustments were made to the benefits package offered teachers. During the negotiations, the Board issued a last best offer to the union.[237]
In 2014-15, the district's mandated teacher pension contribution rose to 21.40% of employee salaries and in 2015-16 it rose again to 25.84% of total salaries. Shikellamy School District teacher and administrator retirement benefits are equal to at least 2.00% x Final Average Salary x Total Credited Service. (Some teachers benefits utilize a 2.50% benefit factor.)[238] After 40 years of service, a teacher can retire with 100% of the average salary of their final 3 years of employment. According to a study conducted at the American Enterprise Institute, in 2011, public school teachers’ total compensation is roughly 50 percent higher than they would likely receive in the private sector. The study found that the most generous benefits that teachers receive are not accounted for in many studies of compensation including: pension, retiree health benefits and job security.[239]
In the 2013-14 school year, the average salary of Shikellamy School District educators was $61,935, while the costs of the benefits package had risen to $30,076 per teacher for a total compensation of $92,012 a year.[240] According to a state report, Shikellamy SD has provided raises to its teachers, which exceeded the rate of inflation since 2001 by $12 million.[241] The district was also required to contribute an amount equal to 16.93% of each employee's salary to the state pension system.[242]
In 2012-2013, the average teacher salary in Shikellamy School District was reported as $60,635 a year, while the cost of the benefits teachers received was $23,066.55 per employee, for a total annual average teacher compensation of $83,701.59.[243] The District's top salary of $125,000.[244]
In 2010-11, the average teacher salary was $58,920 and the top salary was $115,000. The District employed 252 teachers.[245] In 2010, the teacher's union and Board signed a new 5-year contract. Among the terms the teachers will work 186 days, one more than their previous contract required.[246]
In 2007, the Shikellamy School District employed 204 teachers. The average teacher salary in the Shikellamy School District was $48,795 for 184 days worked.[247][248] The teacher’s work day is 7.5 hours, including a 30-minute duty-free lunch and a daily preparation period. Teacher who write courses or attend IEP meetings outside of the school day are paid at $20.50 per hour. Additionally, the teachers receive a defined benefit pension, health insurance (teachers contribute $1,650 per year towards the premium), Vision insurance, dental insurance, professional development courses reimbursement, 3 paid personal days, 10 paid sick days, and other benefits.[249] As of 2007, Pennsylvania ranked in the top 10 states in average teacher salaries. When adjusted for cost of living Pennsylvania ranked fourth in the nation for teacher compensation.[250]
Administration spending The Shikellamy School District administrative costs per pupil were $587.43 in 2008. The lowest administrative cost per pupil in Pennsylvania was $398 per pupil.[251] In 2010 the school board hired Robin Musto as Superintendent.[252] Ms Musto retired unexpectedly after a brief leave due to illness.[253]
Per pupil spending In 2008, the Shikellamy School District reported spending $11,130 per pupil. This ranked 387th in the commonwealth.[254] In 2010, the District’s per pupil spending had increased to $12,865.21.[255] In 2011, Pennsylvania’s per pupil spending was $13,467, ranking 6th in the United States.[256] In 2007, the Pennsylvania per pupil total expenditures was reported as $12,759.[257]
The U.S. Census Bureau reported that Pennsylvania spent $8,191 per pupil in school year 2000-01.[258] In 2007, the Pennsylvania per pupil total expenditures was reported as $12,759.[257] Among the fifty states, Pennsylvania’s total per pupil revenue (including all sources) ranked 11th at $15,023 per student, in 2008-09.[259] Pennsylvania’s total revenue per pupil rose to $16,186 ranking 9th in the nation in 2011.[260]
Reserves In 2008, the District reported a $3,322,311 in an unreserved-undesignated fund balance. The designated fund balance was reported as zero.[261] In 2010, Shikellamy School District Administration reported an increase to $3,589,270 in the unreserved-undesignated fund balance. The District also reported zero in its unreserved-designated fund in 2010. Pennsylvania public school district reserve funds are divided into two categories – designated and undesignated. The undesignated funds are not committed to any planned project. Designated funds and any other funds, such as capital reserves, are allocated to specific projects. School districts are required by state law to keep 5 percent of their annual spending in the undesignated reserve funds to preserve bond ratings. According to the Pennsylvania Department of Education, from 2003 to 2010, as a whole, Pennsylvania school districts amassed nearly $3 billion in reserved funds.[262] By 2013, reserves held by Pennsylvania public school districts, as a whole, had increased to over $3.8 billion.[263] By 2014, Shikellamy School Board had $8,546,867 in reserve accounts.[264]
Debt In 2009, Shikellamy School District reported having over $27 million in outstanding debt in General Obligation bonds.[265]
Tax shift referendum Shikellamy School District voters rejected a tax referendum in May 2007 which would have increased local earned income tax by another 0.5 percent to reduce property taxes for homeowners and farmers by $176.[266]
Audit In December 2010, the Pennsylvania Auditor General conducted a performance audit of the district. The findings were reported to the board and administration.[267] In 2014, Shikellamy School District was audited again. It was found that the District had taken appropriate corrective action in implementing recommendations pertaining to a certification deficiency.[268]
Tuition Students who live in the Shikellamy School District's attendance area may choose to attend one of Pennsylvania's 157 public charter schools. A student living in a neighboring public school district or a foreign exchange student may seek admission to Shikellamy School District. For these cases, the Pennsylvania Department of Education sets an annual tuition rate for each school district. It is the amount the public school district pays to a charter school for each resident student that attends the charter and it is the amount a nonresident student's parents must pay to attend the District's schools. The 2012 tuition rates are Elementary School - $8,489.68, High School - $9,786.03.[269]
Assessment appeal In June 2014, Viking Energy won an appeal of its closed power plant's property assessment. The assessment fell from $1.2 million to $600,000. Consequently, the property taxes on the plant also fell significantly from $28,593 in 2012 to $13,504 for 2013.[270]
The Shikellamy School District is funded by a combination of: a local Occupation Tax, an earned income tax 0.5%, 2 per capita taxes $10, a property tax, a real estate transfer tax 0.5%, coupled with substantial funding from the Commonwealth of Pennsylvania and the federal government. Grants can provide an opportunity to supplement school funding without raising local taxes. Interest earnings on accounts also provide nontax income to the District. In the Commonwealth of Pennsylvania, pension income and Social Security income are exempted from state personal income tax and local earned income tax, regardless of the level of the individual’s personal wealth.[271] The average Pennsylvania public school teacher pension in 2011 exceeds $60,000 a year plus they receive federal Social Security benefits: both are free of Pennsylvania state income tax and local income tax which funds local public schools.[272]
State basic education funding
According to a report from Representative Todd Stephens office, Shikellamy School District receives 46.2% of its annual District revenue from the state.[273]
For the 2016-17 school year, Shikellamy School District received $12,509,580 in Basic Education Funding from the Commonwealth of Pennsylvania. This is a 3.3% increase over 2015-16 funding to the District. The highest percentage of BEF increase in Northumberland County was 3.3% awarded to Shikellamy School District under the state’s Basic Education Funding formula. Additionally, Shikellamy was awarded an increase in special education state funding and Ready to Learn grants. For the 2016-17 school year, Pennsylvania increased its public education spending to a record high of $5,895 billion. It was a $200 million increase, 3.51% increase over the 2015-16 appropriation.[274] The state also funded Ready to Learn grants at $250 million and Special Education funding received a $20 million increase.[275] The state also paid $492 million to the school employee social security fund and another $2.064 billion to the teacher’s pension fund.[276]
For the 2015-16 school year, Governor Tom Wolf released a partial Basic Education Funding of $5,867,727 to Shikellamy School District, in January 2016.[277] This was part of $10.3 billion in school funding withheld from the public schools, by the Governor since the summer of 2015.[278] The dispersement did not follow the new Basic Education Fair Funding formula which had been established by the Pennsylvania General Assemby in June 2015.[279] Ten (10) Pennsylvania school districts received no increase in Basic Eductaion funding under Governor Wolf.[280][281] In April 2016, Governor Wolf announced his finalized dispersement of 2015-16 state Basic Education Funding. Shikellamy School District received a 2.79% increase for a total funding of $12,563,232.[282] This was the highest BEF increase awarded to a Northumberland County public school district. The highest increase in funding statewide was awarded by Governor Wolf to Wilkinsburg Borough School District which got a 48.07% increase in state Basic Education Funding. The average BEF increase among the Commonwealth’s 500 public school districts for 2015-16 was 2.21%.
For the 2014-15 school year, Shikellamy School District received $11,804,913 in State Basic Education funding. The District also received $208,219 in Accountability Block Grant funding and $208,520 in new Ready To Learn Block grant. The State’s enacted Education Budget includes $5,526,129,000 for the 2014-2015 Basic Education Funding.[283] The Education budget also includes Accountability Block Grant funding at $100 million and $241 million in new Ready to Learn funding for public schools that focus on student achievement and academic success. The State is paying $500.8 million to Social Security on the school employees behalf and another $1.16 billion to the state teachers pension system (PSERS). In total, Pennsylvania’s Education budget for K-12 public schools is $10 billion. This was a $305 million increase over 2013-2014 state spending and the greatest amount ever allotted by the Commonwealth for its public schools.[284]
For the 2013-14 school year, Shikellamy School District received a 1.9% increase or $11,806,795 in Pennsylvania Basic Education Funding. This is $216,931 more than its 2012-13 state BEF to the District. Additionally, Shikellamy School District received $208,219 in Accountability Block Grant funding to focus on academic achievement and level funding for special education services. Among the public school districts in Allegheny County, South Fayette Township School District received the highest percentage increase in BEF at 5.5%. The District has the option of applying for several other state and federal grants to increase revenues. The Commonwealth’s budget increased Basic Education Funding statewide by $123 million to over $5.5 billion. Most of Pennsylvania’s 500 public school districts received an increase of Basic Education Funding in a range of 0.9% to 4%. Eight public school districts received exceptionally high funding increases of 10% to 16%. The highest increase in state funding was awarded to Austin Area School District which received a 22.5% increase in Basic Education Funding.[285] The state funded the PSERS (Pennsylvania school employee pension fund) with $1,017,000,000 and Social Security payments for school employees of $495 million.[286]
For the 2012-13 school year, Shikellamy School District received $11,589,864 .[287] The Governor's Executive Budget for 2012-2013 included $9.34 billion for kindergarten through 12th grade public education, including $5.4 billion in basic education funding, which was an increase of $49 million over the 2011-12 budget. In addition, the Commonwealth provided $100 million for the Accountability Block Grant (ABG) program. Shikellamy School District received $208,219 in Accountability Block Grant funding to focus on academic achievement. The state also provided a $544.4 million payment for School Employees’ Social Security and $856 million for School Employees’ Retirement fund called PSERS.[288] This amount was a $21,823,000 increase (0.34%) over the 2011-2012 appropriations for Basic Education Funding, School Employees' Social Security, Pupil Transportation, Nonpublic and Charter School Pupil Transportation. Since taking office, Corbett’s first two budgets have restored more than $918 million in support of public schools, compensating for the $1 billion in federal stimulus dollars lost at the end of the 2010-11 school year.
In the 2011-12 budget year, Shikellamy School District received $11,589,864 in state Basic Education Funding.[289] Additionally, the District received $208,219 in Accountability Block Grant funding.[290] The enacted Pennsylvania state Education budget includes $5,354,629,000 for the 2011-2012 Basic Education Funding appropriation. This amount is a $233,290,000 increase (4.6%) over the enacted State appropriation for 2010-2011. The highest increase in state basic education funding was awarded to Duquesne City School District, which got a 49% increase in state funding for 2011-12.[291] Districts experienced a reduction in funding due to the loss of federal stimulus funding which ended in June 2011.
For the 2010-11 budget cycle, the state provided the Shikellamy School District with a 3.17% increase in state basic education funding for a total of $12,601,663. In Northumberland County, Milton Area School District received the highest basic education funding increase at 6.46%. In the Commonwealth, the largest increase went to Kennett Consolidated School District in Chester County which received a 23.65% increase in state funding for the 2010-11 school year. One hundred and fifty school districts received the base 2% increase in funding.[292] Fifteen (15) Pennsylvania public school districts received a BEF increase of greater than 10%. The state's hold harmless policy regarding state basic education funding continued where each district received at least the same amount as it received the prior school year, even when enrollment had significantly declined. The amount of increase each school district receives was determined by then Governor Edward Rendell and the Secretary of Education Gerald Zahorchak through the allocation set in the state budget proposal made in February each year.[293] This was the second year of Governor Rendell’s policy to fund some public school districts at a far greater rate than others.[294] In 2010, Shikellamy School District reported that 1,264 pupils received a free or reduced-price lunch due to the family meeting the federal poverty level.
For the 2009-10 budget year, the Commonwealth of Pennsylvania provided a 5.38% increase in Basic Education Funding, to the Shikellamy School District, for a total of $12,213,894. The Pennsylvania Department of Education gave 15 public school districts an increase of Basic Education Funding of over 10% in the 2009-10 budget.[295] Ninety (90) Pennsylvania public school districts received the base 2% increase. Muhlenberg School District of Berks County received the highest percentage increase in Pennsylvania for 2009 at 22.31%.[296] The amount of increase each public school district received was set by Governor Edward G. Rendell and the Secretary of Education Gerald Zahorchak, as a part of the state budget proposal.
The state Basic Education Funding to the Shikellamy School District in 2008-09 was $11,589,863.77. The Department of Education reported that 1,194 students in the Shikellamy School District received a free or reduced-price lunch in 2007 due to low family income.[297]
High school reform grant
In 2007, Shikellamy School District was awarded two state grants to improve the education of their high school students. The administration announced the receipt of a three-year Project 720 grant of $270,000.[298] Some of these dollars will be used to revise the graduation project to include a career component. In 2007-08 budget year, the Commonwealth provided $11 million in funding. Shikellamy School District was one of 161 PA public school districts to apply, receiving $89,527 funding over three years.[299][300] For 2010-11, Project 720 funding was decreased to $1.7 million by Governor Rendell. The grant program was discontinued effective with the 2011-12 state budget.[301]
Accountability Block Grants
Beginning in 2004-2005, the state launched the Accountability Block Grant school funding. This program has provided $1.5 billion to Pennsylvania’s school districts. The Accountability Block Grant program requires that its taxpayer dollars are focused on specific interventions that are most likely to increase student academic achievement. These interventions include: teacher training, all-day kindergarten, lower class size K-3rd grade, literacy and math coaching programs that provide teachers with individualized job-embedded professional development to improve their instruction, before or after school tutoring assistance to struggling students, For 2010-11, Shikellamy School District applied for and received $565,158, in addition to all other state and federal funding. The district used the funding to provide full-day kindergarten and to increase instructional time for struggling pupils.[302]
Ready to Learn grant
Beginning in the 2014-2015 budget, the State funded a new Ready to Learn Grant for public schools. A total of $100 million is allocated through a formula to districts based on the number of students, level of poverty of community as calculated by its market value/personal income aid ratio (MV/PI AR) and the number of English language learners. Ready to Learn Block Grant funds may be used by the Districts for: school safety; Ready by 3 early childhood intervention programs; individualized learning programs; and science, technology, engineering and math (STEM) programs.[303]
Shikellamy School District received $208,520 in Ready to Learn Grant dollars in addition to State Basic Education funding, Special Education funding, Accountability Block Grant funding, PreK Counts funding, reimbursement for Social Security payments for employees and other state grants which the district must apply to receive. In 2016-17 Shikellamy SD received an increase to $530,067.
Education Assistance grant
The state's EAP funding provides for the continuing support of tutoring services and other programs to address the academic needs of eligible students. Funds are available to eligible school districts and full-time career and technology centers (CTC) in which one or more schools have failed to meet at least one academic performance target, as provided for in Section 1512-C of the Pennsylvania Public School Code. In 2010-2011, the Shikellamy School District received $113,404.[304]
Classrooms for the Future grant
The Classroom for the Future state program provided districts with hundreds of thousands of extra state funding to buy laptop computers for each core curriculum high school class (English, Science, History, Math) and paid for teacher training to optimize the computers use. The state grant requires the district hire a part-time technology coach, whose role is to assist the teachers in using the equipment and software effectively to improve their instruction. The salary is covered by the grant.[305] The program was funded from 2006-2009. Shikellamy School District was denied funding in 2006-07. In 2007-08, Shikellamy School District received $316,667. Shikellamy School District received another $57,023 in 2008-09 for a total of $373,690.[306][307] The grant program was discontinued by Governor Edward Rendell as part of the 2009-10 state budget.
21st Century Community Learning Center Grant
Shikellamy School District was designated as a before and after school program provider. They receive state funding through grant of $496,000. CCLCs provide academic, artistic and cultural enhancement activities to students and their families when school is not in session.[308] In 2010, the program served 160 students.[309] In July 2012, Shikellamy was awarded a second grant funding of $400,000.[310]
Other grants
The Shikellamy School District did not participate in: Pennsylvania Department of Environmental Protection's Environmental Education annual grants;[311] PA Science Its Elementary grants (discontinued effective with 2009-2010 budget by Governor Rendell);[312] the 2012 and 2013 Striving Readers Comprehensive Literacy grant;[313] 2013 Safe Schools and Resource Officer grants, 2012 and 2013 Pennsylvania Hybrid Learning Grants.[314]
Federal Stimulus funding
Shikellamny School District received over $2.3 million in ARRA (Federal Stimulus) funding. This is in addition to all regular state and federal funding.[315] Federal Stimulus money was to be used in specific programs like special education and meeting the academic needs of low-income students.[316] The funding was limited to the 2009-10 and 2010-2011 school years.[317] Due to the temporary nature of the funding, schools were repeatedly advised to use the funds for one time expenditures like: acquiring equipment, making repairs to buildings, training teachers to provide more effective instruction or purchasing books and software.
Race to the Top Grant
The Shikellamy School Board, Administration and teachers' union chose to not participate in the federal government grant program called Race to the Top. The grant would have meant hundreds of thousands in additional federal dollars that would have been focused on improving student academic achievement.[318] Participation required the written consent of the school board, the school administration and the teachers' union. In Pennsylvania, 120 public school districts and 56 charter schools agreed to participate.[319] Pennsylvania was not approved for the grant. The failure of districts to agree to participate was cited as one reason that Pennsylvania was not approved.[320]
Common Cents state initiative
The Shikellamy School Board decided to not participate in the Pennsylvania Department of Education Common Cents program. The program called for the state to audit the district, at no cost to local taxpayers, to identify ways the district could save tax dollars.[321] After the review of the information, the district was not required to implement the recommended cost savings changes.
Real estate taxes
Shikellamy School District property tax rate in 2016-17 was increased again to 87.0000 mills.[322] In 2013, one mill of real estate taxes was set aside for future construction while 2 mills went to increase funding in the school year budget. A mill is $1 of tax for every $1,000 of a property's assessed value. Irregular property reassessments have become a serious issue in the commonwealth as it creates a significant disparity in taxation within a community and across a region. Unlike other states, under Pennsylvania state tax policy, natural gas and oil pipelines are exempted from property taxes.[323] Shikellamy School District is adversely impacted by the Atlantic Sunrise pipeline.[324] Pipeline companies prohibit development within the 100 foot wide right-of-way, there by limiting future development options for the landowner. This limits future potential property tax revenues for the school district, by constraining future land development.[325][326][327]
On the local level, Pennsylvania district revenues are dominated by two main sources: 1) Property tax collections, which account for the vast majority (between 75-85%) of local revenues; and 2) Act 511 tax collections, which are around 15% of revenues for school districts.[328] When a Pennsylvania public school district includes municipalities in two or more counties, each of which has different rates of property tax assessment, a state board equalizes the tax rates between the counties.[329] In 2010, miscalculations by the State Tax Equalization Board (STEB) were widespread in the Commonwealth and adversely impacted funding for many school districts, including those that did not cross county borders like Shikellamy School District The error was not corrected by the PDE.[330]
The average yearly property tax paid by Northumberland County residents amounts to about 2.23% of their yearly income. Northumberland County ranked 1219th out of the 3143 United States counties for property taxes as a percentage of median income.[341] According to a report prepared by the Pennsylvania Department of Education, the total real estate taxes collected by all public school districts in Pennsylvania rose from $6,474,133,936 in 1999-00 to $10,438,463,356 in 2008-09 and to $11,153,412,490 in 2011.[342] Property taxes in Pennsylvania are relatively high on a national scale. According to the Tax Foundation, Pennsylvania ranked 11th in the U.S. in 2008 in terms of property taxes paid as a percentage of home value (1.34%) and 12th in the country in terms of property taxes as a percentage of income (3.55%).[343]
Act 1 Adjusted index
The Act 1 of 2006 Index regulates the rates at which each school district can raise property taxes in Pennsylvania. Districts are not allowed to raise taxes above that index unless they allow voters to vote by referendum, or they seek an exception from the state Department of Education. The base index for the 2011-2012 school year is 1.4 percent, but it can be adjusted higher, depending on a number of factors, such as property values and the personal income of district residents. Act 1 included 10 exceptions, including: increasing pension costs, increases in special education costs, a catastrophe like a fire or flood, increasing rising health care costs for contracts in effect in 2006 or dwindling tax bases. The base index is the average of the percentage increase in the statewide average weekly wage, as determined by the PA Department of Labor and Industry, for the preceding calendar year and the percentage increase in the Employment Cost Index for Elementary and Secondary Schools, as determined by the Bureau of Labor Statistics in the U.S. Department of Labor, for the previous 12-month period ending June 30. For a school district with a market value/personal income aid ratio (MV/PI AR) greater than 0.4000, its index equals the base index multiplied by the sum of .75 and its MV/PI AR for the current year.[344]
The School District Adjusted Index for the Shikellamy School District 2006-2007 through 2010-2011.[345]
For the 2016-17 budget year, Shikellamy School Board applied for two exceptions to exceed the District's Act 1 Index limit: accelerating pension costs and increasing special education costs.[354] Statewide 299 school districts adopted a resolution to not exceed their Act I index in 2016-17.
For the 2015-16 budget year, Shikellamy School Board applied for two exceptions to exceed their Act 1 Index limit: for special education cost and for its rapidly rising teacher pension costs. For the school budget 2015-16, 310 Pennsylvania public school districts adopted a resolution certifying that tax rates would not be increased above its Act 1 Index limit. Another 187 school districts adopted a preliminary budget leaving open the option of exceeding the Index limit. Regarding the pension costs exception, 172 school districts received approval to exceed the Index limit in full, while others received a partial approval of their request. For special education costs, 119 districts received approval to exceed their tax limit. No Pennsylvania public school districts received an approval for the grandfathered construction debts exception.[355]
For the 2013-14 budget year, Shikellamy School Board applied for an exception to exceed their Act 1 Index limit due to rapidly escalating teacher pension costs. For the school budget year 2013-14, 311 Pennsylvania public school districts adopted a resolution certifying that tax rates would not be increased above their index. Another 171 school districts adopted a preliminary budget leaving open the option of exceeded the Index limit. For the exception for pension costs, 89 school districts received approval to exceed the Index in full while others received a partial approval of their request. For special education costs, 75 districts received approval to exceed their tax limit. For the pension costs exception, 169 school districts received approval to exceed the Index. Eleven Pennsylvania public school districts received an approval for grandfathered construction debts.[356]
For the 2012-13 budget year, Shikellamy School Board applied for an exception to exceed the Act 1 Index due to rising teacher pension costs. For 2012-2013, 274 school districts adopted a resolution certifying that tax rates would not be increased above their index; 223 school districts adopted a preliminary budget leaving open the option of exceeded the Index limit. For the exception for pension costs, 194 school districts received approval to exceed the Index. For special education costs, 129 districts received approval to exceed the tax limit.[357]
For the 2011-12 school year, the Shikellamy School Board sought 2 exceptions: special education costs and pension costs.[358] In 2011-12, all Pennsylvania school districts were required to make a 8.65% of payroll payment to the teacher’s pension fund. Each year, the School Board has the option of adopting either: 1) a resolution in January certifying they will not increase taxes above their index or 2) a preliminary budget in February. A school district adopting the resolution may not apply for referendum exceptions or ask voters for a tax increase above the inflation index.
For the 2011-12 school year budgets, 247 school districts adopted a resolution certifying that tax rates would not be increased above their index; 250 school districts adopted a preliminary budget. Of the 250 school districts that adopted a preliminary budget, 231 adopted real estate tax rates that exceeded their index. Tax rate increases in the other 19 school districts that adopted a preliminary budget did not exceed the school district’s index. Of the districts who sought exceptions 221 used the pension costs exemption and 171 sought a Special Education costs exemption. Only 1 school district sought an exemption for Nonacademic School Construction Project, while 1 sought an exception for Electoral debt for school construction.[359]
For the 2010-11 budget year, the Shikellamy School Board sought 2 exceptions: special education costs and pension costs.[360] The Shikellamy School Board can no longer seek an exception for health care benefits because there is a new teachers' union contract effective 2010.[361] Each year, the school district has the option of adopting either 1) a resolution in January certifying they will not increase taxes above their index or 2) a preliminary budget in February. A school district adopting the resolution may not apply for referendum exceptions or ask voters for a tax increase above the inflation index. A specific timeline for these decisions is publisher each year by the Pennsylvania Department of Education.[362]
For the 2009-10 budget year, Shikellamy School Board did not apply for exceptions to exceed the Act 1 index for the budget, in 2009-10.[363] In the Spring of 2010, 135 Pennsylvania school boards asked to exceed their adjusted index. Approval was granted to 133 of them and 128 sought an exception for pension costs increases.[364]
Property tax relief
In 2010, the Shikellamy School District property tax relief was set at $174 for 5,135 approved homesteads.[365] In 2009, the Homestead/Farmstead Property Tax Relief from gambling for the Shikellamy School District was $201 per approved permanent primary homestead. In the district, 4,451 property owners applied for the tax relief. The relief was subtracted from the total annual school property tax bill. Property owners apply for the relief through the county Treasurer's office. Farmers can qualify for a farmstead exemption on building used for agricultural purposes. The farm must be at least 10 contiguous acres and must be the primary residence of the owner. Farmers can qualify for both the homestead exemption and the farmstead exemption. In Northumberland County the highest amount of relief in 2009 went to Shikellamy School District. The highest property tax relief in Pennsylvania went to the residents of Chester Upland School District of Delaware County who received $632 per approved homestead.[366]
Additionally, the Pennsylvania Property Tax/Rent Rebate program is provided for low income Pennsylvanians aged 65 and older; widows and widowers aged 50 and older; and people with disabilities age 18 and older. The income limit is $35,000 for homeowners. The maximum rebate for both homeowners and renters is $650. Applicants can exclude one-half (1/2) of their Social Security income, so people who make substantially more than $35,000 may still qualify for a rebate. Individuals must apply annually for the rebate.
Wellness policy
Shikellamy School Board established a district wellness policy in 2006 - Policy 246.[367] The policy deals with nutritious meals served at school, the control of access to some foods and beverages during school hours, age appropriate nutrition education for all students, and physical education for students K-12. The policy is in response to state mandates and federal legislation (P.L. 108 - 265). The law dictates that each school district participating in a program authorized by the Richard B. Russell National School Lunch Act (42 U.S.C. 1751 et seq) or the Child Nutrition Act of 1966 (42 U.S.C. 1771 et seq) "shall establish a local school wellness policy by School Year 2006."
The legislation placed the responsibility of developing a wellness policy at the local level so the individual needs of each district can be addressed. According to the requirements for the Local Wellness Policy, school districts must set goals for nutrition education, physical activity hat are aligned with the Pennsylvania State Academic Standards for Health, Safety and Physical Education, campus food provision, and other school-based activities designed to promote student wellness. Additionally, districts were required to involve a broad group of individuals in policy development and to have a plan for measuring policy implementation. Districts were offered a choice of levels of implementation for limiting or prohibiting low nutrition foods on the school campus. In final implementation these regulations prohibit some foods and beverages on the school campus.[368] The Pennsylvania Department of Education required the district to submit a copy of the policy for its approval.
The Shikellamy School District offers a free school breakfast and free or reduced-price lunch to children in low income families. All students attending the school can eat breakfast and lunch. Children from families with incomes at or below 130 percent of the federal poverty level are provided a breakfast and lunch at no cost to the family. Children from families with incomes between 130 and 185 percent of the federal poverty level can be charged no more than 30 cents per breakfast. A foster child whose care and placement is the responsibility of the State or who is placed by a court with a caretaker household is eligible for both a free breakfast and a free lunch. Runaway, homeless and Migrant Youth are also automatically eligible for free meals.[369] The meals are partially funded with federal dollars through the United States Department of Agriculture.[370]
In 2013, the USDA issued new restrictions to foods in public schools. The rules apply to foods and beverages sold on all public school district campuses during the day. They limit vending machine snacks to a maximum of 200 calories per item. Additionally, all snack foods sold at school must meet competitive nutrient standards, meaning they must have fruits, vegetables, dairy or protein in them or contain at least 10 percent of the daily value of fiber, calcium, potassium, and Vitamin D.[371] In order to comply with the Healthy, Hunger-Free Kids Act of 2010 all US public school districts are required to raise the price of their school lunches to $2.60 regardless of the actual cost of the lunch.[372]
Shikellamy School District provides health services as mandated by the Commonwealth and the federal government. Nurses are available in each building to conduct annual health screenings (data reported to the PDE and state Department of Health) and to dispense prescribed medications to students during the school day. Students can be excluded from school unless they comply with all the State Department of Health’s extensive immunization mandates. School nurses monitor each pupil for this compliance.[373] Nurses also monitor each child's weight.
Highmark Healthy High 5 grant
In 2009, the Shikellamy School District received funding through a Highmark Healthy High 5 grant. Grace S. Beck School received $3,818 which was used to implement nutrition education and a character development program.[374] Beginning in 2006, Highmark Foundation engaged in a 5-year, $100 million program to promote lifelong healthy behaviors in children and adolescents through local nonprofits and schools.[375]
The District also participated in Highmark Healthy High 5 Health eTools for Schools which enabled mobile data collection of pertinent health and physical fitness screening data on students K-12 in a database held by InnerLink, Inc. in Lancaster, Pennsylvania. Health eTools for Schools also provided interdisciplinary research-based curriculum in nutrition, physical education and physical activity to participating districts. The program was discontinued in 2013.[376]
Bullying Policy
In 2009, Shikellamy School District reported zero incidents of bullying in the previous school year.[377]
The school board prohibits bullying by district students and employees. A policy approved in December 2008 defines bullying and cyberbullying - Policy 249. The Board directs that complaints of bullying shall be investigated promptly, and corrective action shall be taken when allegations are verified. No reprisals or retaliation shall occur as a result of good faith reports of bullying.[378] All Pennsylvania schools are required to have an anti-bullying policy incorporated into their Code of Student Conduct. The policy must identify disciplinary actions for bullying and designate a school staff person to receive complaints of bullying. The policy must be available on the school's website and posted in every classroom. All Pennsylvania public schools must provide a copy of its anti-bullying policy to the Office for Safe Schools every year, and shall review their policy every three years. Additionally, the district must conduct an annual review of that policy with students.[379] District administration are required to annually provide the following information with the district's Safe School Report: the board’s bullying policy, a report of bullying incidents in the school district, and information on the development and implementation of any bullying prevention, intervention or education programs. The Center for Schools and Communities works in partnership with the Pennsylvania Commission on Crime & Delinquency and the Pennsylvania Department of Education to assist schools and communities as they research, select and implement bullying prevention programs and initiatives.[380][381]
Education standards relating to student safety and antiharassment programs are described in the 10.3. Safety and Injury Prevention in the Pennsylvania Academic Standards for Health, Safety and Physical Education.[382]
Closed schools
C. W. Rice Middle School
In May 2011, the school board voted to close the school due to district wide overstaffing and a large budget shortfall coupled with the building needing costly repairs. Beginning with the 2011-12 school year, sixth graders will remain at their elementary schools, while 7th and 8th grade will be provided at the high school.[383]
In 2011, the school's attendance rate was 94%.[384] In 2009-10, the attendance rate was rose to 95%. In 2009, it was 93%.[385][386]
- 8th Grade Reading:
- 2011 - 90% on grade level (3% below basic). In Pennsylvania, 81.8% of 8th graders on grade level.
- 2010 - 89%, State - 81%, Ranked 4th out of 18 eighth grades in the CSIU16 region.[387]
- 2009 - 86%, State - 80% [388]
- 2008 - 86%, State - 78% [389]
- 2007 - 82%, (10% below basic), State - 75% [390]
- 2006 - 70%, (14% below basic), State - 70% [391]
- 8th Grade Math:
- 2011 - 85% on grade level (6% below basic). State - 76.9%[392]
- 2010 - 83%, State - 75%, Ranked 8th out of 18 eighth grades in the CSIU16 region.[393]
- 2009 - 72%, State - 71%. Ranked 12th out of 18 eighth grades in the CSIU16 region.[388]
- 2008 - 76%, State - 70%
- 2007 - 79%, State - 68% [390]
- 2006 - 55%, State - 62%
- 8th Grade Science:
- 2011 - 90% on grade level (4% below basic). State – 58.3% of 8th graders were on grade level.
- 2010 - 84.9%, State - 57%. Ranked 1st among Central Pennsylvania CSIU16 region middle schools in Science. Ranked 18th in all of Pennsylvania School District 8th grades.[393]
- 2009 - 78%, State - 55%
- 2008 - 73%, State - 52%.
|
|
|
|
Sunbury Middle School
In May 2011, the school board voted to close the school due to overstaffing in the district coupled with the building needing costly repairs. Beginning with the 2011-12 school year, sixth graders will remain at their elementary schools, while 7th and 8th grade will be provided at the high school.[397]
In 2011, the attendance rate was 93%.[398] In 2009-10, the attendance rate was rose to 94%. In 2009, it was 93%.[399]
- 8th Grade Reading:
- 2011 - 81% on grade level (7% below basic). In Pennsylvania, 81.8% of 8th graders on grade level.
- 2010 - 83%, State - 81%. Ranked 14th out of 18 eighth grades in the CSIU16 region.
- 2009 - 73%, State - 80%.[400]
- 2008 - 69%, State - 78%
- 2007 - 72%, State - 75% [401]
- 2006 - 61%, State - 70% [402]
- 8th Grade Math:
- 2011 - 86% on grade level (4% below basic). In Pennsylvania, 76.9% of 8th graders are on grade level
- 2010 - 75%, State - 75%. Ranked 15th out of 18 eighth grades in the CSIU16 region.
- 2009 - 65%, State - 71%. Ranked 17th out of 18 eighth grades in the CSIU16 region.
- 2008 - 58%, State - 70% [403]
- 2007 - 72%, State - 68% [401]
- 2006 - 54%, State - 62% [402]
- 8th Grade Science:
- 2011 - 69% on grade level (14% below basic). State – 58.3%
- 2010 - 49%, State - 57%. Ranked 18th in Central Pennsylvania IU16 region middle schools.
- 2009 - 44%, State - 55%
- 2008 - 50%, State - 52% [404]
|
|
|
|
Extracurriculars
Shikellamy School District offers a wide variety of clubs, activities and an extensive, costly sports program. Eligibility for participation is determined by school board policy and in compliance with standards set by the Pennsylvania Interscholastic Athletic Association (PIAA). The sports programs are through the Pennsylvania Heartland Athletic Conference.[405] The Pennsylvania Heartland Athletic Conference is a voluntary association of 25 PIAA High Schools within the central Pennsylvania region.
By Pennsylvania law, all K-12 students residing in the district, including those who attend a private nonpublic school, cyber charter school, charter school and those homeschooled, are eligible to participate in the extracurricular programs including all athletics. They must meet the same eligibility rules as the students enrolled in the district's schools.[406]
According to PA Child Abuse Recognition and Reporting Act 126 of 2014, all volunteer coaches and all those who assist in student activities, must have criminal background checks. Like all school district employees, they must also attend an anti child abuse training once every three years.[407][408][409]
Sports
According to Pennsylvania’s Safety in Youth Sports Act, all sports coaches, paid and volunteer, are required to annually complete the Concussion Management Certification Training and present the certification before coaching.[410][411]
Coaches receive compensation as outlined in the teachers' union contract. When athletic competition exceeds the regular season, additional compensation is paid.[412] Coaching compensation increases employees state pension benefits.
The District funds:
|
|
- Junior High School Sports
|
|
According to PIAA directory July 2015 [413]
References
- ↑ PDE, ED Names and Addresses, September 2016
- ↑ Francis Scarcella and Rick Dandes, Pat Kelley calls it quits, The Daily Item, March 7, 2015
- ↑ Pennsylvania Department of Education - Ed Names and Addresses (2014). "Shikellamy School District LEA Administration".
- ↑ OpenPaGov.org, Shikellamy School District Payroll Report 2013, 2014
- ↑ Francis Scarcella., Shikellamy Superintendent Robin Musto retires, The Daily Item, March 23, 2012
- ↑ Anne Pickering., Great Valley schools chief inks 5-year deal, Main LineLife, November 25, 2009
- ↑ Rick Dandes (July 12, 2015). "It's a homecoming for two new Shikellamy principals". The Daily Item.
- ↑ Amanda August (July 10, 2015). "Todd Vankirk, Chief Shikellamy Elementary School Principal". The Daily Item.
- ↑ Justin Strawser, New Principal is welcomed at Shik, The Daily Item, August 16, 2014
- ↑ NCES, Common Core of Data Shikellamy School District, 2015
- ↑ National Center for Education Statistics (2011). "Common Core of Data - Shikellamy School District".
- ↑ Pennsylvania Department of Education (December 4, 2015). "Shikellamy School District Fast Facts 2015".
- ↑ Pennsylvania Department of Education, Shikellamy School District Fast Facts 2014, November 6, 2014
- ↑ Pennsylvania Department of Education, Shikellamy School District District Fast Facts 2012, October 4, 2013
- ↑ NCES, Common Core of Data - Shikellamy School District, 2010
- ↑ PDE, Enrollment and Projections by LEA and School, July 20, 2010
- ↑ Rick Dandes, For some, tears flow, The Daily Item, August 19, 2014
- ↑ Pennsylvania Department of Education, Enrollment by LEA and School, 2013
- ↑ PDE, Enrollment BY LEA 2014-15, 2014
- ↑ Pennsylvania Department of Education (2010). "Enrollment Projections".
- ↑ Rick Dandes., Shik School Board calls for tax hike, June 15, 2016
- ↑ Rick Dandes (January 9, 2016). "Shikellamy school board reveals early $46.1M budget". The Daily Item.
- ↑ Rick Dandes, Directors apporve $41.6 million budget, The Daily Item, May 9, 2014
- ↑ Francis Scarcella., Shik residents face tax hike, The Daily Item, June 21, 2013
- ↑ Shikellamy School Board Secretary (May 9, 2013). "Budget Resolution" (PDF).
- ↑ Shikellamy School Board Secretary (May 2012). "Budget Resolution 2012-13" (PDF).
- ↑ Francis Scarcella (June 29, 2011). "Rage rampant at Shikellamy School Board meeting". The Daily Item.
- ↑ Pennsylvania Department of Education, Finances Selected Data 2008, 2010
- ↑ Pennsylvania Department of Education, Finances Selected Data 2010, 2012
- ↑ American Fact Finder, US Census Bureau, 2009
- ↑ US Census Bureau, 2010 Census Poverty Data by Local Educational Agency, 2011
- ↑ proximityone (2014). "School District Comparative Analysis Profiles".
- ↑ Pennsylvania Budget and Policy Center, Education Facts Student Poverty Concentration by LEA, 2012
- ↑ Collin Deppen (January 2015). "How many children are homeless in your school district?" (PDF). Pennsylvania Department of Education.
- ↑ US Census Bureau, American Fact Finder, 2009
- ↑ US Census Bureau (2010). "American Fact Finder, State and County quick facts".
- ↑ US Census Bureau (September 2011). "Income, Poverty, and Health Insurance Coverage in the United States: 2010" (PDF).
- ↑ US Census Bureau (2014). "Pennsylvania Median household income, 2006-2010 by County".
- ↑ Michael Sauter & Alexander E.M. Hess, (August 31, 2013). "America's most popular six-figure jobs". USA Today.
- ↑ Jeff Guo (September 15, 2015). "Lower wages for whites, higher wages for immigrants, and inequality for all". Washington Post.
- ↑ New York Times. "Diversity in the classroom". The New York Times. Retrieved June 5, 2011.
- ↑ NCES - Common Core of Data (2010). "Shikellamy School District - District Information".
- ↑ Pennsylvania Public School Code Governance 2010
- ↑ US Department of Education (2015). "Every Student Succeeds Act".
- ↑ Pennsylvania General Assembly (2012). "Act of Jul. 12, 2012, P.L. 1142, No. 141 Section 921-A".
- ↑ Pennsylvania General Assembly, Pennsylvania School Code, 2013
- ↑ Pennsylvania General Assembly (2012). "Act of Jul. 12, 2012, P.L. 1142, No. 141".
- ↑ The Commonwealth Foundation for Public Policy Alternatives. "The Pennsylvania Project". Retrieved May 20, 2010.
- ↑ Francis Scarcella (April 27, 2011). "Close schools, cut jobs". The Daily Item.
- ↑ Codie Jade (November 3, 2013). "Sunbury Middle School goes to only bidder". WKOK Radio 1070.
- ↑ Chris O'Rourke (Sep 16, 2013). "Shik Middle School Plans". CCN News 8.
- ↑ Ali Stevens (September 17, 2013). "Designing a new Shikellamy Middle School". WKOK Radio 1070.
- ↑ Rick Dandes (August 25, 2016). "New Shikellamy middle school unveiled at ceremony". The Daily Item.
- ↑ NCES, Common Core of Data - Grace Beck Elementary School, 2010
- ↑ NCES, Common Core of Data - Chief Shikellamy Elementary School, 2010
- ↑ NCES, Common Core of Data - Oaklyn Elementary School, 2010
- ↑ NCES, Common Core of Data - Priestley Elementary School, 2010
- ↑ Justin Strawser, Six offer their own online classes, The Daily item, January 31, 2016
- ↑ PDE, Charter Schools and Cyber Charter schools 2015-16, 2015
- ↑ Pittsburgh Business Times (April 12, 2016). "Chester County district leads statewide Honor Roll 2016".
- ↑ Pittsburgh Business Times (April 11, 2014). "What makes up a district's School Performance Profile score?".
- ↑ Pittsburgh Business Times (April 10, 2015). "Guide to Pennsylvania Schools Statewide School District Ranking 2015".
- ↑ Pittsburgh Business Times, Pennsylvania Schools Guide 2014 - Statewide District rankings, April 11, 2014
- ↑ Pittsburgh Business Times, Pennsylvania Schools Guide 2013 - Statewide District rankings, April 5, 2013
- ↑ Pittsburgh Business Times, Statewide Honor Roll Rankings 2012, April 4, 2012
- ↑ Pittsburgh Business Times, Statewide Honor Roll Rankings 2011, April 4, 2011
- ↑ Pittsburgh Business Times, Statewide Honor Roll Rankings 2010, April 30, 2010
- ↑ Pittsburgh Business Times, Statewide Honor Roll Rankings 2009, May 2009
- ↑ "Three of top school districts in state hail from Allegheny County,". Pittsburgh Business Times,. May 23, 2007.
- ↑ Pittsburgh Business Times, Overachiever statewide ranking, May 6, 2010
- ↑ Pennsylvania Department of Education (2014). "Opportunity Scholarship Tax Credit Program".
- ↑ Pennsylvania Department of Education (July 2012). "Opportunity Scholarship Tax Credit Program".
- ↑ Olsen, Laura, State list of failing schools has 53 in county, Pittsburgh Post Gazette, July 26, 2012
- ↑ Department of Community and Economic Development (April 15, 2014). "Opportunity Scholarship Tax Credit Program".
- ↑ PDE, Opportunity Scholarship Tax Credit Program 2015, June 2014
- ↑ Pennsylvania Department of Education, (September 21, 2012). "Shikellamy School District AYP Overview 2012".
- ↑ Pennsylvania Department of Education, Shikellamy School District AYP Overview 2011, September 29, 2011
- ↑ Pennsylvania Department of Education, AYP History by LEA and School, 2013
- ↑ Pennsylvania Department of Education (September 21, 2012). "About Adequate Yearly Progress (AYP) in Pennsylvania".
- ↑ The Morning Call, 2009 PSSA RESULTS Shikellamy School District, June 2009
- ↑ Pennsylvania Department of Education (November 4, 2015). "Shikellamy High School Academic Performance 2015".
- ↑ Pennsylvania Department of Education (November 6, 2014). "Shikellamy High School Academic Performance 2014".
- ↑ Pennsylvania Department of Education (October 4, 2013). "Shikellamy High School Academic Performance".
- ↑ Pennsylvania Department of Education (September 21, 2012). "SHIKELLAMY School District AYP Data Table 2012".
- ↑ Pennsylvania Department of Education, SHIKELLAMY School District AYP Data Table 2011, September 29, 2011
- ↑ Pennsylvania Department of Education (March 15, 2011). "New 4-year Cohort Graduation Rate Calculation Now Being Implemented".
- ↑ Pennsylvania Department of Education (2009). "Shikellamy High School Academic Achievement Report Card 2009".
- ↑ Pennsylvania Department of Education (2008). "Shikellamy High School Report Card 2008".
- ↑ Pennsylvania Department of Education (2007). "Shikellamy High School Academic Achievement Report Card 2007".
- ↑ Pennsylvania Department of Education (2006). "Shikellamy High School Academic Achievement Report Card 2006".
- ↑ "Shikellamy School District Academic Achievement Report Card 2005". Pennsylvania Department of Education. 2005.
- ↑ WKOK radio 1070, Leaders and Lawmakers interview, December 20, 2007
- ↑ Amanda O’Rourke (October 21, 2009). "Shikellamy superintendent to take another post". The Daily Item.
- ↑ Shikellamy School District Administration, Shikellamy Student Handbook, August 2010
- ↑ Pennsylvania State Board of Education (2014). "Pennsylvania Academic Standards".
- ↑ Scott, Rob (June 15, 2007). "District to spend $55,000 on textbooks". The Daily Item.
- ↑ Pennsylvania Department of Education (September 29, 2011). "Shikellamy School District Academic Achievement Report Card 2011" (PDF).
- ↑ Pennsylvania Department of Education, State Report: Status of Pennsylvania's Public Schools, 2009
- ↑ US News and World Report, Best High Schools, 2013
- ↑ National Center for Education Statistics (2011). "Common Core Data - Shikellamy High School".
- ↑ Pennsylvania Department of Education, Professional Qualifications of Teachers High School 2012, September 21, 2012
- ↑ Pennsylvania Department of Education (November 4, 2015). "High School School Performance Profile 2015".
- ↑ Jan Murphy (November 4, 2015). "Report card for state's high schools show overall decline". Pennlive.com.
- ↑ Pennsylvania Department of Education (November 4, 2015). "2015 Keystone Exam School Level Data".
- ↑ Pennsylvania Department of Education (November 6, 2014). "Shikellamy High School Academic Performance Data 2014".
- ↑ Evamarie Socha (November 6, 2014). "Half of Valley districts see state test scores decline". The Daily Item.
- ↑ Acting Secretary of Education Carolyn Dumaresq, Acting Secretary of Education Announces Results of 2013-14 School Performance Profile; Strong Performance in 72 Percent of Schools, November 6, 2014
- ↑ Kathy Boccella; Dylan Purcell & Kristen A. Graham (November 6, 2014). "Pa. school rankings: Downingtown STEM No. 1; Phila. falters". Philadelphia Inquirer.
- ↑ Jan Murphy (November 6, 2014). "More Pa. school scores decline than improve, state report card shows". Pennlive.com.
- ↑ Pennsylvania Department of Education (October 4, 2013). "Shikellamy High School Academic Performance Data 2013".
- ↑ Robert Hayes Postupac, Ed.D. University of Pittsburgh (2011). "PROJECT 720: A CASE STUDY OF HIGH SCHOOL REFORM" (PDF).
- ↑ Pennsylvania Department of Education (2012). "Shikellamy High School AYP status Overview 2012".
- ↑ Scores fall below mark - Shikellamy High behind for the 5th straight year, Francis Scarcella, The Daily Item, September 28, 2011
- ↑ Pennsylvania Department of Education (2011). "Pennsylvania State Report Cards".
- ↑ Pennsylvania Department of Education (March 2011). "SHIKELLAMY HIGH SCHOOL - School AYP Overview".
- ↑ Eleventh grade ranking in Pennsylvania, SchoolDigger.com. Retrieved April 2010.
- ↑ Pennsylvania Department of Education Shikellamy High School Report Card 2009, 2009
- ↑ Pennsylvania Department of Education Shikellamy High School Report Card 2008, 2008
- ↑ PDE, Shikellamy High School AYP Overview 2007, 2007
- ↑ PDE, Shikellamy High School AYP Overview 2006, 2006
- ↑ PDE, Shikellamy High School AYP Overview 2005, 2005
- ↑ SchoolDigger.com, Pennsylvania High School ranking, 2006
- ↑ High School rankings based on 2006 PSSA Math and reading scores combined Schooldigger.com.
- 1 2 Pennsylvania Department of Education (2014). "State Academic Standards".
- ↑ Pennsylvania Department of Education (2014). "State Assessment System".
- ↑ Pennsylvania Department of Education (September 29, 2012). "2011-2012 PSSA and AYP Results".
- ↑ Pennsylvania Department of Education (September 29, 2011). "2010-2011 PSSA and AYP Results".
- 1 2 Pittsburgh Post Gazette (October 15, 2012). "How is your school doing?".
- ↑ Pennsylvania Department of Education, Shikellamy High School Academic Achievement Report Card 2011, September 29, 2011
- ↑ Pennsylvania Department of Education (September 21, 2012). "Shikellamy High School Academic Achievement Report Card 2012" (PDF).
- ↑ Pennsylvania Department of Education (September 29, 2011). "2010-2011 PSSA results in Science".
- ↑ Bloomsburg University Administration (2013). "High School Students (ACE)".
- ↑ Commonwealth of Pennsylvania (March 2010). "Pennsylvania Transfer and Articulation Agreement".
- ↑ Pennsylvania Department of Education (November 6, 2014). "Shikellamy Middle School Fast Facts 2014".
- ↑ Pennsylvania Department of Education (October 1, 2015). "2015 PSSA School Level Data".
- ↑ Pennsylvania Department of Education (October 1, 2015). "2015 PSSA State Level Data".
- ↑ Pennsylvania Department of Education (November 6, 2014). "Shikellamy Middle School Academic Performance Data 2014".
- ↑ PDE, Shikellamy Middle School Academic Performance Data 2013, October 4, 2013
- ↑ Pennsylvania Department of Education (September 21, 2012). "Shikellamy Middle School AYP overview 2012".
- ↑ Pennsylvania Department of Education. "IU16-PSSA 95-96 Results by School". Retrieved May 11, 2014.
- ↑ Pennsylvania Department of Education (2014). "Standards Aligned Systems".
- ↑ Pennsylvania Department of Education (2014). "State Academic Standards Mathematics".
- ↑ Pennsylvania Department of Education (September 21, 2012). "Shikellamy Middle School Academic Achievement Report Card 2012" (PDF).
- ↑ The Times-Tribune (2012). "Grading Our Schools database, 2011-12 Science PSSA results".
- ↑ Office of First Lady (September 2, 2014). "Pennsylvania First Lady and Acting Secretary of Education Announce 35 Schools Statewide Implementing Dropout Program".
- ↑ Pennsylvania Department of Education (2014). "The Early Warning System".
- ↑ Pennsylvania Department of Education (November 6, 2014). "Grace S. Beck School Fast Facts 2014".
- ↑ Pennsylvania Department of Education, School Performance Profile, Grace S. Beck School Fast Facts, 2014
- ↑ National Center for Education Statistics, Common Core Data – Grace S. Beck School, 2011
- ↑ Pennsylvania Department of Education, Professional Qualifications of Teachers Grace S. Beck School, September 21, 2012
- 1 2 3 Pennsylvania Partnership for Children, Full Day Kindergarten report, 2011
- ↑ Pennsylvania Department of Education (October 1, 2015). "2015 PSSA School Level Data".
- ↑ Pennsylvania Department of Education (October 1, 2015). "2015 PSSA State Level Data".
- ↑ Pennsylvania Department of Education (November 6, 2014). "Grace S. Beck School Academic Performance Data 2014".
- ↑ Pennsylvania Department of Education (October 4, 2013). "Grace S. Beck School Academic Performance Data 2013,".
- ↑ Pennsylvania Department of Education (2012). "GRACE S BECK SCHOOL - School AYP Overview 2012".
- ↑ Pennsylvania Department of Education, GRACE S BECK SCHOOL - School AYP Overview 2011, September 29, 2011
- ↑ Pennsylvania Department of Education, GRACE S BECK SCHOOL - School AYP Overview 2010, October 20, 2010
- ↑ Pennsylvania Department of Education, GRACE S BECK SCHOOL - School AYP Overview 2009, September 14, 2009
- ↑ Pennsylvania Department of Education, GRACE S BECK SCHOOL - School AYP Data Table 2011, September 29, 2011
- ↑ Pennsylvania Department of Education, Grace S Beck Elementary School Academic Report Card 2012, September 21, 2012
- ↑ Pennsylvania Department of Education (September 29, 2011). "2010-2011 PSSA and AYP Results".
- 1 2 3 4 5 6 7 Pennsylvania Department of Education (2010). "Pennsylvania Reading, Math, Science and Writing PSSA Results by School and Grade 2010".
- ↑ Pennsylvania Department of Education, Grace S. Beck School Academic Achievement Report Card 2009, 2009
- 1 2 3 4 Pennsylvania Department of Education (August 2008). "Pennsylvania Reading, Math, Science and Writing PSSA Results 2008".
- ↑ Pennsylvania Department of Education (September 29, 2011). "Grace S Beck School Academic Achievement Report Card 2011" (PDF).
- ↑ Pennsylvania Department of Education, 2008-09 School Level Math and Reading PSSA Results 2009, 2009
- 1 2 Pennsylvania Department of Education (2007). "Pennsylvania Reading, Math, Science and Writing PSSA Results 2007".
- ↑ Pennsylvania Department of Education (2006). "2005-06 School Level Math and Reading PSSA Results 2006,".
- 1 2 3 4 Pennsylvania Department of Education (2009). "Pennsylvania Reading, Math, Science and Writing PSSA Results by School and Grade 2009".
- ↑ Pennsylvania Department of Education, 2007-08 School Level Math and Reading PSSA Results 2008, 2008
- ↑ Pennsylvania Department of Education (2007). "Pennsylvania Reading, Math, Science and Writing PSSA Results by School and Grade 2007".
- ↑ Pennsylvania Department of Education (2006). "Pennsylvania Reading, Math, Science and Writing PSSA Results by School and Grade 2006".
- ↑ Pennsylvania Department of Education (2010). "2009-2010 PSSA and AYP Results".
- ↑ Pennsylvania Department of Education (November 6, 2014). "Chief Shikellamy School Fast Facts 2014".
- ↑ Pennsylvania Department of Education, School Performance Profile, Chief Shikellamy School Fast Facts 2014, November 6, 2014
- ↑ National Center for Education Statistics, Common Core Data – Chief Shikellamy School, 2011
- ↑ Pennsylvania Department of Education, Professional Qualifications of Teachers Chief Shikellamy School, September 21, 2012
- ↑ Pennsylvania Department of Education (October 1, 2015). "2015 PSSA School Level Data".
- ↑ Pennsylvania Department of Education (November 6, 2014). "Chief Shikellamy School Academic Performance Data 2014".
- ↑ Pennsylvania Department of Education (October 4, 2013). "Chief Shikellamy School Academic Performance Data 2013,".
- ↑ Pennsylvania Department of Education (September 21, 2012). "CHIEF SHIKELLAMY SCHOOL - School AYP Overview 2012".
- ↑ Pennsylvania Department of Education, CHIEF SHIKELLAMY SCHOOL - School AYP Overview 2011, September 29, 2011
- ↑ Pennsylvania Department of Education, AYP History 2003-2012, 2013
- ↑ Pennsylvania Department of Education, CHIEF SHIKELLAMY SCHOOL - School AYP Data Table 2010, September 29, 2011
- ↑ Pennsylvania Department of Education (September 21, 2012). "Chief Shikellamy School Academic Report Card 2012" (PDF).
- ↑ Pennsylvania Department of Education (September 29, 2011). "Chief Shikellamy School Academic Achievement Report Card 2011" (PDF).
- ↑ Pennsylvania Department of Education, Chief Shikellamy School Academic Achievement Report Card 2009, 2009
- ↑ Pennsylvania Department of Education, Chief Shikellamy School Academic Achievement Report Card 2008, 2008
- ↑ Pennsylvania Department of Education, Chief Shikellamy School Academic Achievement Report Card 2007, 2007
- ↑ Pennsylvania Department of Education, Chief Shikellamy School Academic Achievement Report Card 2006, 2006
- ↑ Pennsylvania Department of Education (October 4, 2013). "Oaklyn Elementary School Fast Facts 2013".
- ↑ Pennsylvania Department of Education, School Performance Profile, Oaklyn School Fast Facts, 2013
- ↑ National Center for Education Statistics, Common Core Data – Oaklyn School, 2011
- ↑ Pennsylvania Department of Education, Enrollment by school 2012-11, 2012
- ↑ Pennsylvania Department of Education (October 1, 2015). "2015 PSSA School Level Data".
- ↑ Pennsylvania Department of Education (November 6, 2014). "Oaklyn School Academic Performance Data 2014".
- ↑ Pennsylvania Department of Education (October 4, 2013). "Oaklyn Elementary School Academic Performance Data 2013".
- ↑ Pennsylvania Department of Education, AYP School History 2003-2012, 2013
- ↑ Pennsylvania Department of Education (September 21, 2012). "Oaklyn Elementary School Academic Achievement Report Card 2012" (PDF).
- ↑ Pennsylvania Department of Education, Oaklyn Elementary School Academic Achievement Report Card 2011, September 29, 2011
- ↑ Pennsylvania Department of Education (October 4, 2013). "Priestley Elementary School Fast Facts 2013".
- ↑ NCES, Common Core of Data Priestley Elementary School, 2010
- ↑ Pennsylvania Department of Education (October 1, 2015). "2015 PSSA School Level Data".
- ↑ Pennsylvania Department of Education (November 6, 2014). "Priestley School Academic Performance Data 2014".
- ↑ Pennsylvania Department of Education (October 4, 2013). "Priestley Elementary School Academic Performance Data 2013".
- ↑ Pennsylvania Department of Education (September 21, 2012). "Priestley Elementary School AYP Overview 2012".
- ↑ Pennsylvania Department of Education (September 21, 2012). "Priestley Elementary School Academic Achievement Report Card 2012" (PDF).
- ↑ Pennsylvania Department of Education, Priestley Elementary School Academic Achievement Report Card 2012, September 21, 2012
- ↑ Pittsburgh Post Gazette (October 15, 2012). "How is your school doing? Priestley Elementary School".
- ↑ Pennsylvania Bureau of Special Education Services (2013). "Shikellamy School District Special Education Data Report LEA Performance on State Performance Plan (SPP) Targets".
- ↑ Pennsylvania Bureau of Special Education Services (2010–2011). "Shikellamy School District Special Education Data Report LEA Performance on State Performance Plan (SPP) Targets".
- ↑ Pennsylvania Department of Education, Testimony Hearing on Special Education Senate Republican Policy Committee, January 2013
- ↑ Gerald L. Zahorchak, D. Ed. (May 30, 2007). "House Education Committee Hearing on Governor's Proposed Increase for Accountability Block Grants Testimony for Gerald L. Zahorchak, D. Ed. Secretary, Pennsylvania Department of Education" (PDF).
- ↑ Pennsylvania Bureau of Special Education (2008). "Pennsylvania Parent Guide to Special Education Services".
- ↑ Pennsylvania Department of Education - School District Administration (January 6, 2011). "Procedural Safeguards Notice".
- ↑ Pennsylvania Department of Education, Bureau of Special Education (September 2005). "Gaskin Settlement Agreement Overview Facts Sheet" (PDF).
- ↑ Pennsylvania Department of Education (2010). "Pennsylvania Special Education Funding".
- ↑ Browne, Patrick., Senate Education Committee Hearing on Special Education Funding & Accountability testimony, November 1, 2011
- ↑ Kintisch, Baruch., Public Hearing: Special Education Funding & Accountability Testimony, Education Law Center, November 11, 2011
- ↑ Amy Morton, Executive Deputy Secretary, Public Hearing: Special Education Funding & Accountability Testimony, Pennsylvania Department of Education, November 11, 2011
- ↑ US Department of Education, U.S. Department of Education Clarifies Schools' Obligation to Provide Equal Opportunity to Students with Disabilities to Participate in Extracurricular Athletics, January 25, 2013
- ↑ Pennsylvania Department of Education (July 2010). "Special Education Funding from Pennsylvania State_2010-2011".
- ↑ Pennsylvania Department of Education (2011). "Special Education Funding 2011-2012 Fiscal Year".
- ↑ Pennsylvania Department of Education (April 2012). "Investing in PA kids".
- ↑ Pennsylvania Department of Education, Special Education funding report by LEA, July 2014
- ↑ Pennsylvania Department of Education (July 2010). "Gifted Students as Percentage of Total Enrollment by School District/Charter School" (PDF).
- ↑ Pennsylvania Department of Education and Pennsylvania School Board. "CHAPTER 16. Special Education For Gifted Students". Retrieved February 4, 2011.
- ↑ Pennsylvania Department of Education (March 26, 2010). "Special Education for Gifted Students Notice of Parental rights" (PDF).
- ↑ Pennsylvania General Assembly, Taxpayer Relief Act, Act 1 of the Special Session of 2006, June 27, 2006
- ↑ Francis Scarcella (June 29, 2011). "Two middle schools closed; principal resigns". The Daily Item.
- ↑ Francis Scarcella (May 24, 2011). "Shik OKs plan: Initial vote shutters 2 schools". The Daily Item.
- ↑ Francis Scarcella (May 21, 2011). "23 Shikellamy High School teachers earn $14G to plan". The Daily Item.
- ↑ "Shikellamy school board adopts $34.6M budget,". The Daily Item. June 20, 2007.
- ↑ "Shikellamy budget approved". The Daily Item,. May 19, 2007.
- ↑ Rick Dandes., Shik pact has 3% pay hikes, benefits revisions, The Daily Item, October 10, 215
- ↑ Shikellamy School Board (June 28, 2015). "Shikellamy School District's Final and Best Offer" (PDF).
- ↑ Pennsylvania School Employees Retirement System (2014). "Your PSERS Benefits & Leaving Employment".
- ↑ American Enterprise Institute, (2011). "Assessing the Compensation of Public School Teachers".
- ↑ Pennsylvania Department of Education (2014). "Investing in Pennsylvania Students".
- ↑ Marcia Moore., Teachers' pay soars past rises in prices, The Daily Item, June 29, 2014
- ↑ Pennsylvania School Board Association (February 27, 2015). "Pension, PSERS Background Basics".
- ↑ Pennsylvania Department of Education, Investing in Pennsylvania Students, 2013
- ↑ "Shikellamy School District Payroll report 2012". OpenPA Gov.org. 2013.
- ↑ "Shikellamy School District Payroll report 2011". OpenPA Gov.org. 2013.
- ↑ Diane Petryk (March 1, 2010). "Shikellamy teachers ratify 5-year contract". The Daily Item.
- ↑ Fenton, Jacob, Average classroom teacher salary in Northumberland County, 2006-07, The Morning Call, March 2010
- ↑ The Asbury Park Press (2009). "PA School District Salaries 2009,".
- ↑ Shikellamy School Board. "Shikellamy School District Teacher Union Employment Contract 2010".
- ↑ Pennsylvania School Board Association (2009). "Pennsylvania School Salaries 2009-10, PSBA Issues Report".
- ↑ Fenton, Jacob. (Feb 2009). "Pennsylvania School District Data: Will School Consolidation Save Money?,". The Morning Call.
- ↑ Petryk, Diane, (June 11, 2010). "Shikellamy chooses superintendent.". The Daily Item.
- ↑ Scarcella, Francis., Shikellamy Superintendent Robin Musto retires, The Daily Item, March 23, 2011
- ↑ Pennsylvania Department of Education (2011). "Summaries of Annual Financial Report Data Actual Instruction Expense: 1994-95 to 2009-10".
- ↑ Pennsylvania Department of Education (2010). "2009-10 Selected Data - 2009-10 Total Expenditures per ADM".
- ↑ US Census Bureau, States Ranked According to Per Pupil Public Elementary-Secondary School System Finance Amounts: Fiscal Year 2011, May 2013
- 1 2 US Census Bureau (2009). "Total and current expenditures per pupil in fall enrollment in public elementary and secondary education, by function and state or jurisdiction: 2006-07".
- ↑ US Census Bureau (March 2003). "Public Education Finances 2000-01 Annual Survey of Local Government Finances" (PDF).
- ↑ United States Census Bureau (2009). "States Ranked According to Per Pupil Elementary-Secondary Public School System Finance Amounts: 2008-09" (PDF).
- ↑ US Census Bureau (May 2013). "States Ranked According to Per Pupil Public Elementary-Secondary School System Finance Amounts: Fiscal Year 2011" (PDF).
- ↑ Pennsylvania Department of Education (2010). "Summaries of Annual Financial Report Data Details General Fund Balance: 1996-97 to 2009-10".
- ↑ Murphy, Jan., Pennsylvania's public schools boost reserves, CentreDaily Times, September 22, 2010
- ↑ Melissa Daniels (June 1, 2013). "PA school districts look to cash stash to balance budgets". PA Independent.
- ↑ PDE (July 2014). "Investing in Pennsylvania Students".
- ↑ Pennsylvania Department of Education (2011). "Summaries of Annual Financial Report Data Short- and Long-Term Debt: 1996-97 to 2009-10".
- ↑ The Daily Item (May 19, 2007). "Tax reform proposal falls in all Valley school districts".
- ↑ Pennsylvania Auditor General (December 2010). "SHIKELLAMY SCHOOL DISTRICT NORTHUMBERLAND COUNTY, PENNSYLVANIA PERFORMANCE AUDIT REPORT" (PDF).
- ↑ Pennsylvania Auditor General (June 2014). "SHIKELLAMY SCHOOL DISTRICT NORTHUMBERLAND COUNTY, PENNSYLVANIA PERFORMANCE AUDIT REPORT" (PDF).
- ↑ Pennsylvania Department of Education (May 2012). "Pennsylvania Public School District Tuition Rates".
- ↑ Justin Strawser (June 18, 2014). "Reassessment to cost $22,000 in lost revenue". The Daily Item.
- ↑ Pennsylvania Department of Revenue (April 2010). "Personal Income Taxation Guidelines".
- ↑ John Finnerty (2013). "PA teachers pensions". CNHI Harrisburg Bureau.
- ↑ Pennsylvania Representative Todd Stephens (January 23, 2014). "LEEF Funding Chart 2014".
- ↑ Pennsylvania Department of Eductaion, Education Budget 2016-17, July 2016
- ↑ PDE, Special Education Funding fiscal year 2016-17, July 2017
- ↑ PA Office of Budget, Commonwealth 2016-17 Enacted Budget Line-Item Appropriations, July 2016
- ↑ Jan Murphey (January 4, 2016). "Here's the payout your school district gets from the partial 2015-16 state budget". Pennlive.com.
- ↑ Jennifer Wakeman (January 4, 2016). "Harrisburg releases $3.3 billion in delayed funds".
- ↑ Pennsylvania General Assembly (June 26, 2015). "Basic Education Funding Commission".
- ↑ Jan Murphy (January 6, 2016). "School funding distribution gives rise to new battle between Wolf, GOP lawmakers". PennLive.com.
- ↑ Pennsylvania Department of Education (January 2016). "Summary of State Appropriations for Education 2015-2016 Fiscal Year Education Budget".
- ↑ Pennsylvania Department of Education, EdBudget 2015-16 BEF, April 6, 2016
- ↑ PDE (July 7, 2014). "Enacted Education Budget 2014-2015".
- ↑ Pennsylvania Department of Education, 2014-15 Enacted Education Budget Fast Facts, July 14, 2014
- ↑ Democrat Appropriations Committee, Report on Education funding by LEA, July 2, 2013
- ↑ Pennsylvania Office of the Budget, 2013-14 State Budget Highlights, 2013
- ↑ Senator Jake Corman (June 28, 2012). "Pennsylvania Education funding by Local School District" (PDF).
- ↑ Pennsylvania General Assembly Sen Jake Corman (June 29, 2012). "SB1466 of 2012 General Fund Appropriation".
- ↑ Pennsylvania Department of Education, Basic Education Funding 2011-2012 Fiscal Year, July 2011
- ↑ Pennsylvania Senate Appropriations Committee (June 2011). "Senate Budget Hearings 2011-2012 School District funding for 2011-2012".
- ↑ Pennsylvania Department of Education (June 30, 2011). "Basic Education Funding 2011-2012 Fiscal Year".
- ↑ Pennsylvania Department of Education (2010). "2010-11 Enacted Education Budget".
- ↑ Office of the Budget, (February 2010). "Pennsylvania Budget Proposal 2010".
- ↑ Office of the Budget (February 2010). "Pennsylvania Budget Proposal 2010".
- ↑ Pennsylvania Department of Education, Summaries of Annual Financial Report Data State Revenue:2003-04 to 2009-10, 2011
- ↑ Pennsylvania Budget Proposal 2010, Office of Budget. February 2010
- ↑ Pennsylvania Department of Education, Education Funding Report 2009. October 2009.
- ↑ Scott, Rob (August 10, 2007). "School District gets grant". The Daily Item,.
- ↑ Pennsylvania Department of Education (2007). "Transforming Pennsylvania High Schools".
- ↑ Robert Hayes Postupac, PROJECT 720: A CASE STUDY OF HIGH SCHOOL REFORM, University of Pittsburgh, 2011
- ↑ PA Office of the Budget, 2011-12 Budget General Fund - State Appropriations, June 28, 2011
- ↑ Pennsylvania Department of Education (2010). "Accountability Block Grant report 2010, Grantee list 2010".
- ↑ Pennsylvania Department of Education (2013). "Passport for Learning Block Grant".
- ↑ "Educational Assistance Program Funding 2010-2011 Fiscal Year". Pennsylvania Department of Education. Retrieved January 2011. Check date values in:
|access-date=(help) - ↑ Scott, Rob (September 7, 2007). "New Software enhances Core Subject". The Daily Item,.
- ↑ Pennsylvania Auditor General (2008-12-22). "Classrooms For the Future grants audit" (PDF).
- ↑ Race, Michael (August 30, 2007). "Classrooms for the Future Schools". Pennsylvania Department of Education.
- ↑ Pennsylvania Awards $29.9 Million to Support 21st Century Community Learning Centers, Pennsylvania Department of Education Press Release, April 7, 2010
- ↑ Learning Point Associates (2010). "Grantee Details - Shikellamy".
- ↑ Stevens, Ali., $400,000 state grant for Shikellamy, WKOK.Info, July 11, 2012
- ↑ Department of Environmental Protection (2014). "Environmental Education Grants".
- ↑ Pennsylvania Department of Education, Science: It’s Elementary Grantees Students in 143 Schools Benefit from Intensive Science Curriculum, July 22, 2008
- ↑ Pennsylvania Department of Education (May 23, 2012). "Pennsylvania Awards $36.1 Million to Strengthen Literacy Programs".
- ↑ Pennsylvania Department of Education Press Office (October 17, 2013). "Acting Secretary of Education Says Hybrid Learning Benefits Students; Highlights Success of First-Year Pilot Program".
- ↑ Commonwealth of Pennsylvania (2009). "Northumberland County Report ARRA".
- ↑ ProPublica (2009). "Recovery Tracker Eye on the stimulus".
- ↑ "School stimulus money". Pittsburgh Post-Gazette. March 12, 2009.
- ↑ Pennsylvania Department of Education (January 20, 2010). "Race to the Top for Pennsylvania Schools".
- ↑ Pennsylvania Department of Education (January 2010). "Pennsylvania's 'Race to the Top' Fueled by Effective Reforms, Strong Local Support".
- ↑ U.S. Department of Education, (March 29, 2010). "Race to the Top Fund,".
- ↑ Pennsylvania Department of Education. "Common Cents program - Making Every Dollar Count".
- ↑ Rick Dandes., Shik School board calls for tax hike, June 15, 2016
- ↑ Katie Colaneri (June 11, 2015). "New pipeline could mean tax bonanza for NJ towns, but for Pa.? Not so much". State Impact NPR.org.
- ↑ Penn State Extension (2012). "Marcellus Shale Gas Development: What Does It Mean for Pennsylvania Schools?".
- ↑ The Nature Conservancy – Pennsylvania Chapter, Natural Gas Pipelines Pennsylvania Energy Impacts Assessment, December 16, 2011
- ↑ TIMOTHY PUKO (December 11, 2011). "Shale gas pipelines pose challenges to state's forests, wildlife". TribLive.com.
- ↑ Google (2016). "Atlantic Sunrise Natural Gas Pipeline: Whole Route".
- ↑ Pennsylvania Department of Education (2004). "Act 511 Tax Report".
- ↑ State Tax Equalization Board (2011). "State Tax Equalization Board About US".
- ↑ Pennsylvania Auditor General office - Bureau of Audits (February 2011). "A Special Performance Audit of the Pennsylvania State Tax Equalization Boards" (PDF).
- ↑ WKOK Staff (June 15, 2015). "Shikellamy adopts big budget for next year". WKOK 1070 AM.
- ↑ Justin Strawser (June 18, 2014). "Shikellamy board OKs 2.25-mill tax increase". The Daily Item.
- ↑ Scarcella, Frank, No tax hike in $37 million Shik district budget, The Daily Item, June 20, 2012
- ↑ Pennsylvania Department of Education (2011). "Finances_Real Estate Tax Rates 2011-12".
- ↑ Pennsylvania Department of Education (2011). "Financial Elements Reports 2010-11 Real Estate Mills".
- ↑ Pennsylvania Department of Education (2010). "Financial Elements Reports".
- ↑ Pennsylvania Department of Education (2009). "Financial Elements Reports 2008-09 Real Estate Mills".
- ↑ Pennsylvania Department of Education (2008). "Real Estate Tax Millage by School District,".
- ↑ Pennsylvania Department of Education, Real Estate Tax Millage by School District, 2006
- ↑ Pennsylvania Department of Education, Real Estate Tax Millage by School District, 2005
- ↑ Tax-rates.org., The 2013 Tax Resource County Property Taxes 2012, 2012
- ↑ Pennsylvania Department of Education, Pennsylvania School Finances - Summaries of Annual Financial Report Data 2010-11, 2011
- ↑ New Census Data on Property Taxes on Homeowners, Tax Foundation, September 22, 2009.
- ↑ Pennsylvania Department of Education, Referendum Exceptions Taxpayer Relief Act, 2011
- ↑ Pennsylvania Department of Education (2011). "Property Tax Reduction Allocations".
- ↑ Pennsylvania Department of Education (2010). "Index Calculation Required by the Taxpayer Relief Act Sept 18,".
- ↑ Pennsylvania Department of Education (May 2012). "Financial Data Elements".
- ↑ Pennsylvania Department of Education (May 2011). "The Index Special Session Act 1 of 2006".
- ↑ Pennsylvania Department of Education, 2013-2014 School District Adjusted Index, September 2012
- ↑ Pennsylvania Department of Education, 2014-2015 School District Adjusted Index, September 2013
- ↑ Pennsylvania Department of Education, 2015-2016 School District Adjusted Index, September 2014
- ↑ Pennsylvania Department of Education. "2016-2017 School District Adjusted Index, September 5, 2015".
- ↑ Pennsylvania Department of Education (205). "Property Tax Relief".
- ↑ Pennsylvania Department of Education (April 2016). "Report on Referendum Exceptions For School Year 2016-2017" (PDF).
- ↑ Pennsylvania Department of Education (April 2015). "Taxpayer Relief Act Special Session Act 1 of 2006 Report on Referendum Exceptions For School Year 2015-2016" (PDF).
- ↑ Pennsylvania Department of Education, Report on Referendum Exceptions For School Year 2013-2014, April 2013
- ↑ Pennsylvania Department of Education, Report on Referendum Exceptions For School Year 2012-2013, March 30, 2012
- ↑ Pennsylvania Department of Education (May 2011). "Adjusted Index History".
- ↑ Pennsylvania Department of Education (April 2011). "Report on Exceptions".
- ↑ Pennsylvania Department of Education (May 2010). "Report on Referendum Exceptions for 2010-2011".
- ↑ WKOK.com, Five-year contract approved for Shikellamy teachers, March 2, 2010
- ↑ Pennsylvania Department of Education (2011). "Special Session Act 1 of 2006 the Taxpayer Relief Act information".
- ↑ Pennsylvania Department of Education (May 2009). "Report on Referendum Exceptions for 2009-2010".
- ↑ Scarcella, Frank & Pursell, Tricia, (May 25, 2010). "Local school tax assessments exceed state averages". The Daily Item.
- ↑ Tax Relief per Homestead, Pennsylvania Department of Education Report, May 1, 2010
- ↑ Tax Relief per Homestead 2009, Pennsylvania Department of Education Report May 1, 2009
- ↑ Shikellamy School Board Policy Manual Policy 246
- ↑ Pennsylvania Department of Education Division of Food and Nutrition, Nutrition Standards for Competitive Foods in Pennsylvania Schools for the School Nutrition Incentive, July 2008
- ↑ USDA, Child Nutrition Programs - Eligibility Manual for School Meals, 2012
- ↑ Pennsylvania Hunger Action Center, The Pennsylvania School Breakfast Report Card, 2009
- ↑ USDA, Child Nutrition Programs, June 27, 2013
- ↑ United States Department of Agriculture (2011). "Food and Nutrition Service Equity in School Lunch Pricing Fact Sheet" (PDF).
- ↑ Pennsylvania State Department of Health (2010). "Pennsylvania Bulletin Doc. No. 10-984 School Immunizations; Communicable and Noncommunicable Diseases".
- ↑ Highmark Foundation, 2009 School Challenge Grants, 2009
- ↑ Highmark Foundation (2009). "Highmark Healthy High 5 School Challenge grant program enables Pennsylvania schools to implement or enhance healthy lifestyle programs for students".
- ↑ PR Newswire, Highmark Healthy High 5 Health eTools for Schools Available Free Through 2009, 2007
- ↑ Pennsylvania Safe Schools Online - School Safety Reports
- ↑ Shikellamy School Board Policy 249
- ↑ Regular Session 2007-2008 House Bill 1067, Act 61 Section 6 page 8
- ↑ Center for Safe Schools of Pennsylvania (2006). "Bullying Prevention advisory".
- ↑ Pennsylvania Department of Education (2012). "Bullying, Hazing, and Harassment Resources".
- ↑ Pennsylvania State Board of Education (January 11, 2003). "Pennsylvania Academic Standards Health, Safety and Physical Education".
- ↑ Francis Scarcella (March 30, 2011). "Schools or teachers?".
- ↑ Pennsylvania Department of Education (September 29, 2011). "RICE MS - School AYP Data Table".
- ↑ Pennsylvania Department of Education (2010). "RICE MIDDLE SCHOOL School AYP Data Table".
- ↑ Pennsylvania Department of Education (2010). "RICE MIDDLE SCHOOL Academic Achievement Report Card 2010" (PDF).
- ↑ Pennsylvania Department of Education (2011). "Rice Middle School Academic Achievement Report Card" (PDF).
- 1 2 3 Pennsylvania Department of Education, Rice Middle School Academic Achievement Report Card 2009, 2009
- ↑ Pennsylvania Department of Education, Rice Middle School Academic Achievement Report Card 2008, 2008
- 1 2 Pennsylvania Department of Education, Rice Middle School Academic Achievement Report Card 2007, 2007
- ↑ Pennsylvania Department of Education, Rice Middle School Academic Achievement Report Card 2006, 2006
- ↑ Pennsylvania Department of Education, Rice Middle School Academic Achievement Report Card 2011, September 29, 2011
- 1 2 3 Pennsylvania Department of Education, Rice Middle School Academic Achievement Report Card 2010, 2010
- ↑ Pennsylvania Department of Education, 2009-2010 School Level PSSA and AYP Results, September 29, 2011
- ↑ Pennsylvania Department of Education (2009). "PSSA Results Math and Reading School 2009".
- ↑ Pennsylvania Department of Education (2008). "PSSA Results Math and Reading School 2007-2008".
- ↑ Shikellamy School Board Secretary (June 28, 2011). "Shikellamy School Board Meeting minutes Special Board Meeting" (PDF).
- ↑ Pennsylvania Department of Education, SUNBURY Middle School AYP Data Table 2011, September 29, 2011
- ↑ Pennsylvania Department of Education, SUNBURY MIDDLE School AYP Data Table 2010, October 20, 2010
- ↑ Pennsylvania Department of Education, Sunbury Middle School Academic Achievement Report Card 2009, September 14, 2009
- 1 2 Pennsylvania Department of Education, Sunbury Middle School Academic Achievement Report Card 2007, 2007
- 1 2 Pennsylvania Department of Education, Sunbury Middle School Academic Achievement Report Card 2006, 2006
- ↑ Pennsylvania Department of Education, Sunbury School Academic Achievement Report Card 2008, 2008
- ↑ Pennsylvania Department of Education (August 2008). "Pennsylvania Science PSSA Results 2008".
- ↑ "Pennsylvania Heartland Athletic Conference School list". 2012.
- ↑ Pennsylvania Office of the Governor Press Release (November 10, 2005). "Home-Schooled, Charter School Children Can Participate in School District Extracurricular Activities".
- ↑ Eleanor Chute., New Pa. law expands clearance requirements for school volunteers, employees, Pittsburgh Post-Gazette, December 15, 2014
- ↑ Pennsylvania General Assembly (2014). "ACT 126 – Child Abuse Recognition and Reporting Act".
- ↑ Ali Stevens., Child Protective Services Law impacts schools, WKOK.com 1070AM, January 6, 2015
- ↑ PA General Assembly (July 1, 2012). "Senate Bill 200 of Session 2011 Safety in Youth Sports Act".
- ↑ UMPC Sports Medicine (2014). "Managing Concussions in Student Athletes: The Safety in Youth Sports Act".
- ↑ Shikellamy School Board, Shikellamy School District Teacher Union Contract, 2015
- ↑ Pennsylvania Interscholastic Athletics Association (2015). "PIAA School Directory".
External links
Northumberland County, Pennsylvania Schools | |||||||||||||||||||||||||||||||||||||||
|---|---|---|---|---|---|---|---|---|---|---|---|---|---|---|---|---|---|---|---|---|---|---|---|---|---|---|---|---|---|---|---|---|---|---|---|---|---|---|---|
| |||||||||||||||||||||||||||||||||||||||
| |||||||||||||||||||||||||||||||||||||||