Tuscarora School District
| Tuscarora School District | |
|---|---|
|
"Where every child is known by name" | |
| Address | |
|
100 West Seminary Street Mercersburg, Pennsylvania, Franklin County 17236-1606 United States | |
| Information | |
| Type | Public |
| School board | 9 elected members |
| Superintendent | Dr. Nadine E. Sanders |
| Administrator |
Anne Miller, Business Manager |
| Principal | Mr. Rodney Benedick, HS |
| Principal | Mr. James Carbaugh, MS |
| Principal | Mr Ryan Kaczmark, Mercersburg & Montgomery ES |
| Principal | Mr Brett Kagarise, MVES |
| Principal | Mr Andrew Kyle, STES |
| Staff | 122 non teaching staff members |
| Faculty | 168 teachers (2011)[1] |
| Grades | K-12 |
| Age | 5 years old to 21 years old special education |
| Enrollment | 2,587 pupils (2013);[2] 2,593 pupils (2012); 2,573 pupils (2010)[3] |
| • Kindergarten | 192 (2012), 177 (2010) |
| • Grade 1 | 194 (2012), 164 |
| • Grade 2 | 207 (2012), 179 |
| • Grade 3 | 187 (2012), 193 |
| • Grade 4 | 187 (2012), 195 |
| • Grade 5 | 175 (2012), 251 |
| • Grade 6 | 209 (2012), 199 |
| • Grade 7 | 197 (2012), 216 |
| • Grade 8 | 252 (2012), 232 |
| • Grade 9 | 201 (2012), 195 |
| • Grade 10 | 204 (2012), 194 |
| • Grade 11 | 210 (2012), 201 |
| • Grade 12 | 172 (2012), 177 (2010) |
| Language | English |
| Budget |
$36,942,229 (2016-17) $33,051,620 (2010-11) |
| Per pupil spending | $11,242 (2008) |
| Per pupil spending | $12,189.32 (2010) |
| Website | http://www.tus.k12.pa.us/pages/Tuscarora_School_District |
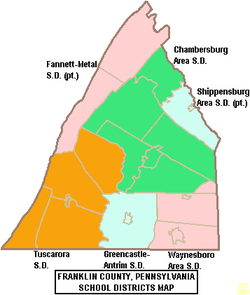
The Tuscarora School District is a misdized, rural, public school district located in Franklin County, Pennsylvania. It serves: the borough of Mercersburg, as well as St. Thomas Township, Peters Township, Montgomery Township, and Warren Township. The District is one of the 500 public school districts of Pennsylvania. Tuscarora School District covers an area of 201 square miles (520 km2), stretching north-south from just south of 40 degrees north latitude to the Maryland border and from east of the 78 degree west longitude line to just west of Chambersburg, Pennsylvania. The District is primarily a rural agricultural area with a total population of approximately 17,000 people.[4] Tuscarora, the name of the mountain on the western boundary, is derived from the Tuscarora Tribe of the Iroquois Confederation. The Tribe came north from the Carolinas about 1713 and settled for a time along the mountains. The name Tuscarora comes from the Indian name Skaruron or hemp gatherers. Conococheague, the name of the creek that flows through the District on its way from the Path Valley south to the Potomac River, is an Indian name from the Delaware Tribe meaning clear water.
According to 2000 federal census data, Tuscarora School District had a resident population of 17,547. By 2010, the District's population was 18,407 people.[5] The educational attainment levels for the School District population (25 years old and over) were 83.9% high school graduates and 14.3% college graduates.[6] In 2009, the District residents’ per capita income was $18,384, while the median family income was $46,926.[7] In the Commonwealth, the median family income was $49,501 [8] and the United States median family income was $49,445, in 2010.[9] In Franklin County, the median household income was $51,035.[10] By 2013, the median household income in the United States rose to $52,100.[11]
According to District officials, in school year 2013-14, Tuscarora School District provided basic educational services to 2,550 pupils. In 2007-08, the District reported employing: 196 teachers, 140 full-time and part-time support personnel, and 13 administrators. Tuscarora School District received more than $12.4 million in state funding in school year 2007-08. School district administrative officials reported that, during the 2005-06 school year, the District provided basic educational services to 2,804 pupils. That year it employed: 10 administrators, 190 teachers, and 116 full-time and part-time support personnel.
The Tuscarora School District operates: four K-5 schools (Saint Thomas Elementary School, Mountain View Elementary School, Mercersburg Elementary School, Montgomery Elementary School), James Buchanan Middle School (6th-8th) and James Buchanan Senior High School (grades 9-12). High school students may choose to attend Franklin County Career and Technology Center for training in the construction and mechanical trades. The Lincoln Intermediate Unit IU12 provides the District with a wide variety of services like specialized education for disabled students and hearing, speech and visual disability services and professional development for staff and faculty.
Governance
Tuscarora School District is governed by 9 individually elected board members (serve four-year terms), the Pennsylvania State Board of Education, the Pennsylvania Department of Education and the Pennsylvania General Assembly.[12] The federal government, through the US Department of Education, controls programs it funds like Title I funding for low-income children in the Elementary and Secondary Education Act and the No Child Left Behind Act, which mandates the district focus federal resources on student success in acquiring adequate reading and math skills. The Superintendent and Business Manager are appointed by the school board. The Superintendent is the chief administrative officer with overall responsibility for all aspects of operations, including education and finance. The Business Manager is responsible for budget and financial operations. Neither of these officials are voting members of the School Board. The School Board enters into individual employment contracts for these positions. In Pennsylvania, public school districts are required to give 150 days notice to the Superintendent regarding renewal of the employment contract.[13]
The Commonwealth Foundation for Public Policy Alternatives Sunshine Review gave the school board and district administration a "D" for transparency based on a review of "What information can people find on their school district's website". It examined the school district's website for information regarding; taxes, the current budget, meetings, school board members names and terms, contracts, audits, public records information and more.[14]
Board of Education
|
|
Academic achievement
Tuscarora School District was ranked 325th out of the 498 ranked Pennsylvania school districts in 2014, by the Pittsburgh Business Times. The ranking is based on the last 3 years of student academic achievement as demonstrated by PSSAs results in: reading, writing, math and science and the three Keystone Exams (literature, Algebra 1, Biology I) in high school.[15] Three school districts were excluded because they do not operate high schools (Saint Clair Area School District, Midland Borough School District, Duquesne City School District). The PSSAs are given to all children in grades 3rd through 8th. Adapted PSSA examinations are given to children in the special education programs. Writing exams were given to children in 5th and 8th grades.
- 2013 - 328th [16]
- 2012 - 365th
- 2011 - 388th[17]
- 2010 - 393rd [18]
- 2009 - 411th
- 2008 - 413th
- 2007 - 374th out of 501 Pennsylvania school districts in 2007.[19]
- Overachiever statewide ranking
In 2013, the Pittsburgh Business Times also reported an Overachievers Ranking for 498 Pennsylvania school districts. Tuscarora School District ranked 465th. In 2012, the Tuscarora School District was 469th. [20] The editor describes the ranking as: "a ranking answers the question - which school districts do better than expectations based upon economics? This rank takes the Honor Roll rank and adds the percentage of students in the district eligible for free and reduced-price lunch into the formula. A district finishing high on this rank is smashing expectations, and any district above the median point is exceeding expectations."[21]
Lowest achieving schools list
In July 2012, the Pennsylvania Department of Education (PDE) released a second report identifying 2 Tuscarora School District schools as among the lowest-achieving schools for reading and mathematics in 2011. St Thomas Elementary School and Mercersburg Elementary School were listed among the 15% lowest-achieving schools in the Commonwealth. St Thomas Elementary School and Mercersburg Elementary School were also on the 2011 list. Parents and students may be eligible for scholarships to transfer to another public or nonpublic school through the state's Opportunity Scholarship Tax Credit Program passed in June 2012.[22] The scholarships are limited to those students whose family's income is less than $60,000 annually, with another $12,000 allowed per dependent. Maximum scholarship award is $8,500, with special education students receiving up to $15,000 for a year's tuition. Parents pay any difference between the scholarship amount and the receiving school's tuition rate. Students may seek admission to neighboring public school districts. Each year the PDE publishes the tuition rate for each individual public school district.[23] Fifty three public schools in Allegheny County are among the lowest-achieving schools in 2011. According to the report, parents in 414 public schools (74 school districts) were offered access to these scholarships. For the 2012-13 school year, eight public school districts in Pennsylvania had all of their schools placed on the list, including: Sto-Rox School District, Chester Upland School District, Clairton City School District, Duquesne City School District, Farrell Area School District, Wilkinsburg Borough School District, William Penn School District and Steelton-Highspire School District.[24] Funding for the scholarships comes from donations by businesses which receive a state tax credit for donating.
In 2013, Mercersburg Elementary School was removed from the lowest achieving school list.[25]
District AYP status history
In 2012, Tuscarora School District achieved AYP status.[26] In 2011, Tuscarora School District achieved Adequate Yearly Progress (AYP). In 2011, 94 percent of the 500 Pennsylvania public school districts achieved the No Child Left Behind Act progress level of 72% of students reading on grade level and 67% of students demonstrating on grade level math. In 2011, 46.9 percent of Pennsylvania school districts achieved Adequate Yearly Progress (AYP) based on student performance. An additional 37.8 percent of Pennsylvania public school districts made AYP based on a calculated method called safe harbor, 8.2 percent on the growth model and 0.8 percent on a two-year average performance.[27] Tuscarora School District achieved AYP status each year from 2005 to 2010, while in 2004 the District was in Warning status due to lagging student achievement.[28] In 2003, the District achieved AYP status.
Tuscarora School District student achievement is in the bottom 11th percentile of Pennsylvania's 500 school district. Scale (0-99; 100 is state best)[29]
Graduation rate
In 2013, Tuscarora School District's graduation rate was 87%.[30] In 2012, Tuscarora School District's graduation rate was 87%.[31] In 2011, the District's graduation rate was 81%.[32] In 2010, the Pennsylvania Department of Education issued a new, 4-year cohort graduation rate. Tuscarora School District's rate was 81% for 2010.[33]
- Former calculation graduation rate
James Buchanan Senior High School
James Buchanan Senior High School is located at 4773 Fort Loudon Road, Mercersburg. In 2013, enrollment was reported as 785 pupils in 9th through 12th grades, with 27% of pupils eligible for a free lunch due to family poverty. Additionally, 15% of pupils received special education services, while 1% of pupils were identified as gifted. The school employed 48 teachers.[38] Per the PA Department of Education 100% of the teachers were rated "Highly Qualified" under the federal No Child Left Behind Act.
According to the National Center for Education Statistics, in 2011, the school reported an enrollment of 788 pupils in grades 9th through 12th, with 215 pupils eligible for a federal free or reduced-price lunch due to the family meeting the federal poverty level. The school is not a federally designated Title I school. The high school employed 53 teachers, yielding a student–teacher ratio of 14:1.[39] According to a report by the Pennsylvania Department of Education, 1 teacher was rated "Non‐Highly Qualified" under No Child Left Behind.[40] (Principal: Rodney Benedick, Assistant Principal: Samuel Dickey)
- 2013 School Performance Profile
James Buchanan High School achieved 67.5 out of 100. Reflects on grade level reading, mathematics and science achievement. In reading/literature - 70% were on grade level. In Algebra 1, only 51% showed on grade level math skills. In Biology, 51% showed on grade level science understanding.[41] According to the Pennsylvania Department of Education, 2,181 public schools (less than 73 percent of Pennsylvania public schools), achieved an academic score of 70 or higher. Pennsylvania 11th grade students no longer take the PSSAs. Instead, beginning in 2012, they take the Keystone Exams at the end of the associated course.[42]
- AYP history
In 2012, James Buchanan Senior High School achieved AYP status, even though math and reading scores remained low. In 2011, James Buchanan Senior High School is in Making Progress: in School Improvement II status due to lagging student achievement in reading and mathematics.[43]
- 2010 - declined to School Improvement II due to chronically low student achievement.[44] Under the federal No Child Left Behind Act, the school administration was required to notify parents of the school's poor achievement outcomes and to offer the parent the opportunity to transfer to a successful school within the District. Additionally the school administration was required by the Pennsylvania Department of Education, to develop a School Improvement Plan to address the school's low student achievement. Under the Pennsylvania Accountability System, the school district must pay for additional tutoring for struggling students.[45] The High School was eligible for special, extra funding under School Improvement Grants which the school must apply for each year.[46]
- 2009 - Making Progress School Improvement I
- 2008 - declined to School Improvement I, due to low student achievement
- 2007 - declined to Warning AYP status
- 2003 - 2006 - achieved Adequate Yearly Progress status
PSSA results: Pennsylvania System of School Assessments, commonly called PSSAs are No Child Left Behind Act related examinations which were administered from 2003 through 2012, in all Pennsylvania public high schools. The exams were administered in the Spring of each school year. The goal was for 100% of students to be on grade level or better in reading and mathematics, by the Spring of 2014. The tests focused on the state's Academic Standards for reading, writing, mathematics and science. The Science exam included content in science, technology, ecology and the environmental studies. The mathematics exam included content from: Algebra I, Algebra II, geometry and trigonometry. The standards were first published in 1998 and are mandated by the Pennsylvania State Board of Education.[47]
In 2013, the Commonwealth of Pennsylvania changed its high school assessments to the Keystone Exams in Algebra 1, Reading/literature and Biology1. The exams are given at the end of the course, rather than all in the spring of the student's 11th grade year.[48]
- 11th Grade Reading
- 2012 - 70% on grade level (18% below basic). State - 67% of 11th graders are on grade level.[49]
- 2011 - 71% (14% below basic). State - 69%[50]
- 2010 - 63% (21% below basic). State - 66% [51]
- 2009 - 59% (23% below basic), State - 65% [52]
- 2008 - 43% (31% below basic), State - 65% [53]
- 2007 - 51% (24% below basic), State - 65% [54]
- 11th Grade Math
- 2012 - 58% on grade level (23% below basic). In Pennsylvania, 59% of 11th graders are on grade level.[55]
- 2011 - 55% (23% below basic). State - 60.3% [56]
- 2010 - 50%, (30% below basic). State - 59%[57]
- 2009 - 55% (24% below basic). State - 56%[58]
- 2008 - 52% (24% below basic). State - 56%[59]
- 2007 - 41% (32% below basic). State - 53%[60]
- 11th Grade Science
- 2012 - 34% on grade level (14% below basic). State - 42%[61]
- 2011 - 36% (14% below basic). State - 40%[62]
- 2010 - 34% (18% below basic). State - 39%
- 2009 - 35% (20% below basic). State - 40% [63]
- 2008 - 22% (26% below basic), State - 39%
Science in Motion James Buchanan Senior High School did not take advantage of a state program called Science in Motion which brought college professors and sophisticated science equipment to the school to raise science awareness and to provide inquiry-based experiences for the students. The Science in Motion program was funded by a state appropriation and cost the school nothing to participate.[64]Gettysburg College provides the experiences to schools in the region.
College Remediation
According to a Pennsylvania Department of Education study released in January 2009, 11% of Tuscarora School District graduates required remediation in mathematics and or reading before they were prepared to take college level courses in the Pennsylvania State System of Higher Education or community colleges.[65] Less than 66% of Pennsylvania high school graduates, who enroll in a four-year college in Pennsylvania, will earn a bachelor's degree within six years. Among Pennsylvania high school graduates pursuing an associate degree, only one in three graduate in three years.[66] Per the Pennsylvania Department of Education, one in three recent high school graduates who attend Pennsylvania's public universities and community colleges takes at least one remedial course in math, reading or English.[67][68]
Dual enrollment
James Buchanan Senior High School offers a dual enrollment program. This state program permits high school students to take courses, at local higher education institutions, to earn college credits. Students remain enrolled at their high school, including the graduation ceremony. The courses count towards high school graduation requirements and towards earning a college degree. The students continue to have full access to activities and programs at their high school. The college credits are offered at a deeply discounted rate. The state offered a small grant to assist students in costs for tuition, fees and books.[69] Under the Pennsylvania Transfer and Articulation Agreement, many Pennsylvania colleges and universities accept these credits for students who transfer to their institutions.[70] The Pennsylvania College Credit Transfer System reported in 2009, that students saved nearly $35.4 million by having their transferred credits count towards a degree under the new system.[71] In 2010, Governor Edward Rendell eliminated the grants to students, from the Commonwealth, due to a state budget crisis.
For the 2009-10 funding year, the Tuscarora School District received a state grant of $7,968 for the program.[72]
Graduation requirements
The Tuscarora School Board has determined that, in order to graduate, a student must earn 23.5 credits, including: 4 Credits of English; 3 Credits of Math; 3.5 Credits of Social Science; 3 Credits of Science; 2 Credits of Physical Education; Tech Exploration 0.5 credits;; 0.5 Credit Units of Driver’s Education; 0.5 Credits Of Family Economics and Development.[73]
By law, all Pennsylvania secondary school students must complete a project as a part of their eligibility to graduate from high school. The type of project, its rigor and its expectations are set by the individual school district.[74] Effective with the graduating class of 2017, the Pennsylvania Board of Education eliminated the state mandate that students complete a culminating project in order to graduate.[75]
By Pennsylvania School Board regulations, beginning with the class of 2017, public school students must demonstrate successful completion of secondary level course work in Algebra I, Biology, and English Literature by passing the Keystone Exams.[76][77][78] For the class of 2019, a composition exam will be added. For the class of 2020, passing a civics and government exam will be added to the graduation requirements.[79] In 2011, Pennsylvania high school students field tested the Algebra 1, Biology and English Lit exams. The statewide results were: Algebra 1 38% on grade level, Biology 35% on grade level and English Lit - 49% on grade level.[80] Individual student, school or district reports were not made public, although they were reported to district officials by the Pennsylvania Department of Education. Students identified as having special needs and qualifying for an Individual Educational Program (IEP) may graduate by meeting the requirements of their IEP.
SAT scores
In 2013, Tuscarora School District students took the SAT exams. The District's Verbal Average Score was 469. The Math average score was 482. The Writing average score was 467. The College Board reported that statewide scores were: 494 in reading, 504 in math and 482 in writing. The nationwide SAT results were the same as in 2012.[81]
In 2012, 81 Tuscarora School District students took the SAT exams. The District's Verbal Average Score was 484. The Math average score was 499. The Writing average score was 468. The statewide Verbal SAT exams results were: Verbal 491, Math 501, Writing 480. In the USA, 1.65 million students took the exams achieving scores: Verbal 496, Math 514, Writing 488. According to the College Board the maximum score on each section was 800, and 360 students nationwide scored a perfect 2,400.
In 2011, 86 Tuscarora School District students took the SAT exams. The District's Verbal Average Score was 472. The Math average score was 485. The Writing average score was 454.[82] Pennsylvania ranked 40th among states with SAT scores: Verbal - 493, Math - 501, Writing - 479.[83] In the United States, 1.65 million students took the exam in 2011. They averaged 497 (out of 800) verbal, 514 math and 489 in writing.[84]
The Pennsylvania Department of Education compared the SAT data of students in rural areas of Pennsylvania to students in urban areas. From 2003 to 2005, the average total SAT score for students in rural Pennsylvania was 992, while urban students averaged 1,006. During the same period, 28 percent of 11th and 12th graders in rural school districts took the exam, compared to 32 percent of urban students in the same grades. The average math and verbal scores were 495 and 497, respectively, for rural students, while urban test-takers averaged 499 and 507, respectively. Pennsylvania’s SAT composite score ranked low on the national scale in 2004. The composite SAT score of 1,003 left Pennsylvania ranking 44 out of the 50 states and Washington, DC.[85]
The Pennsylvania Department of Education reported that 71 percent of students in rural areas of Pennsylvania chose to continue their education after high school in 2003, whereas 79 percent of urban high school graduates opted to continue their education.
AP Courses
In 2013, James Buchanan High School offered 10 Advanced Placement (AP) courses at a higher cost than regular courses. The student pays the fee for the exam which was $89 per test per pupil in 2012. Students have the option of taking College Board approved courses and then taking the College Board's examination in the Spring. Students, who achieve a 3 or better on the exam, may be awarded college credits at US universities and colleges. Each higher education institution sets its own standards about what level of credits are awarded to a student based on their AP exam score. Most higher education give credits for scores of 4 or 5. Some schools also give credits for scores of 3. High schools give credits towards graduation to students who take the school's AP class. At James Buchanan High School just 23.44% of students who took an AP course earned a 3 or better on the exam.[86]
James Buchanan Middle School
James Buchanan Middle School is located at 5191 Fort Loudon Road, Mercersburg. In 2013, enrollment was 662 pupils, in grades 6th through 8th, with 32% of pupils eligible for a free lunch due to family poverty. Additionally, 12% of pupils received special education services, while less than 1% of pupils were identified as gifted.[87] According to a 2013 report by the Pennsylvania Department of Education, 100% of its teachers were rated "Highly Qualified" under No Child Left Behind.[88]
According to the National Center for Education Statistics, in 2011, the school reported an enrollment of 657 pupils in grades 6th through 8th, with 208 pupils receiving a federal free or reduced-price lunch due to family poverty. The school employed 43.5 teachers, yielding a student–teacher ratio of 15:1.[89] According to a report by the Pennsylvania Department of Education, 100% of its teachers were rated "Highly Qualified" under No Child Left Behind.[90] (Principal: James Carbaugh, Assistant Principal: Zachary Kump)
- 2013 School Performance Profile
James Buchanan Middle School achieved 85.3 out of 100. Reflects on grade level reading, writing, mathematics and science achievement. In reading, just 71% of the students were on grade level. In Mathematics/Algebra 1, 70.7% of the students showed on grade level skills. In Science, only 66% of the 8th graders demonstrated on grade level understanding. In writing, 79% of the 8th grade students demonstrated on grade level writing skills.[91]
- AYP history
In 2012, James Buchanan Middle School declined to Warning AYP status due, to low student achievement in reading and mathematics.[92] In 2010 and 2011, James Buchanan Middle School achieved AYP status.[93] In 2012 the attendance rate was 95%. For the 2010 and 2011 school years, the attendance rate at the school was also reported at 94%.[94]
- PSSA Results
Sixth and seventh grades have been tested in reading and mathematics since 2006. Eighth graders are tested in: reading, writing, mathematics and Science. Beginning in the Spring of 2013, eighth graders, who are enrolled in Algebra I take the Keystone Exam for Algebra I at the end of the course. The testing of 8th grade in reading and mathematics began in 1999, as a state initiative.[95] Testing in science began in 2007. The goal is for 100% of students to be on grade level or better in reading and mathematics, by the Spring of 2014. The tests focus on the state's Academic Standards for reading, writing, mathematics and science.[96] The standards were published in 1998 and are mandated by the Pennsylvania State Board of Education.[97] In 2014, the Commonwealth adopted the Pennsylvania Core Standards - Mathematics.[98]
|
|
- 8th Grade Science
- 2012 - 70% on grade level (14% below basic). State - 59%
- 2011 - 61% (18% below basic). State – 58.3%
- 2010 - 56% (26% below basic). State - 57 [107]
- 2009 - 56% (17% below basic). State - 55% [108]
- 2008 - 55% (15% below basic). State - 52% [109]
|
|
|
|
Elementary schools
St Thomas Elementary School and Mercersburg Elementary School were listed among the 15% lowest-achieving schools in the Commonwealth. St Thomas Elementary School and Mercersburg Elementary School were also on the lowest-achieving schools list in 2011.
Each year, in the Spring, the 3rd graders take the PSSAs in math and reading. The fourth grade is tested in reading, math and science. The fifth grade is evaluated in reading, mathematics and writing. The Pennsylvania System of School Assessments have been administered beginning 2003 to all Pennsylvania public school students in grades 3rd-8th.[110] The goal was for 100% of students to be on grade level or better in reading and mathematics, by the Spring of 2014.[111][112][113] The tests focused on the state's Academic Standards for reading, writing, mathematics and science. The Science exam is given to 4th grades and includes content in science, technology, ecology and the environmental studies.[114]
Mercersburg Elementary School is located at 30 South Park Avenue, Mercersburg. In 2013, the School's enrollment was 277 pupils in grades kindergarten through 5th, with 32% of pupils receiving a federal free or reduced price meals due to family poverty. Additionally, 10% of the pupils receive special education services, while less than 1% are identified as gifted.[115] According to a report by the Pennsylvania Department of Education, 100% of the teachers were rated highly qualified under No Child Left Behind. The Mercersburg Elementary School continues to provide full day kindergarten.[116] The School is not a federally designated Title I school.
According to the National Center for Education Statistics, in 2011, Mercersburg Elementary School reported an enrollment of 304 pupils in grades kindergarten through 5th, with 116 pupils receiving a federal free or reduced-price lunch due to family poverty. The school is a federally designated Title I school. The school employed 19 teachers, yielding a student–teacher ratio of 16:1.[117] According to a report by the Pennsylvania Department of Education, 100% of its teachers were rated "Highly Qualified" under No Child Left Behind.[118] The school has provided all-day kindergarten since 2006.
- 2013 School Performance Profile
Mercersburg Elementary School achieved a score of 86 out of 100. The score reflects on grade level: reading, science, writing and mathematics achievement. In 2012-13, only 75% of the students were reading on grade level in grades 3rd through 5th. In 3rd grade, 90% of the pupils were reading on grade level. In math, 84% were on grade level (3rd-5th grades). In 4th grade science, 81% of the pupils demonstrated on grade level understanding. In writing, only 47% of 5th grade pupils demonstrated on grade level writing skills.[119]
- AYP history
In 2012, Mercersburg Elementary School declined to Warning AYP status due to lagging academic achievement. In 2011, Mercersburg Elementary School achieved AYP status.[120] Mercersburg Elementary School achieved AYP status each school year 2003-2010.[121]
In 2012, only 66% of the students were reading on grade level in grades 3rd through 5th, with 20% below basic.. In math, 66% of the students in 3rd through 5th grades were on grade level and 12% scored below basic. In 4th grade science, 83% of the pupils were on grade level.[122] Principal: Ryan Kaczmark
|
5th Grade Reading: |
5th Grade Math:
|
|
|
- 4th Grade Science
- 2012 - 83%, (5% below basic). State - 82%
- 2011 - 84%, (4% below basic). State - 82.9%
|
|
Saint Thomas Elementary School is located at 70 School House Road, Saint Thomas. In 2013, the Saint Thomas Elementary School's enrollment was 305 pupils in grades kindergarten through 5th, with 47% of pupils receiving a federal free or reduced price meals due to family poverty. Additionally, 9% of the pupils receive special education services, while none are identified as gifted.[126] According to a report by the Pennsylvania Department of Education, 100% of the teachers were rated highly qualified under No Child Left Behind Act. The School provides full day kindergarten.[127] The school is a federally designated Title I school.
According to the National Center for Education Statistics, in 2011, the school reported an enrollment of 374 pupils in grades kindergarten through 5th, with 178 pupils receiving a federal free or reduced-price lunch due to family poverty. The school is a federally designated Title I school. The school employed 22 teachers, yielding a student–teacher ratio of 16:1.[128] According to a report by the Pennsylvania Department of Education, 100% of its teachers were rated "Highly Qualified" under No Child Left Behind.[129] The School has provided all-day kindergarten since 2006. Additionally, Saint Thomas provides two, taxpayer funded pre-school classrooms for ages 3–5.
- 2013 School Performance Profile
Saint Thomas Elementary School achieved a score of 80 out of 100. The score reflects on grade level: reading, science, writing and mathematics achievement. In 2012-13, only 60% of the students were reading on grade level in grades 3rd through 5th. In 3rd grade, 70% of the pupils were reading on grade level. In math, 72% were on grade level (3rd-5th grades). In 4th grade science, just 65% of the pupils demonstrated on grade level understanding. In writing, only 70% of 5th grade pupils demonstrated on grade level skills.[130]
- AYP history
In 2012, Saint Thomas Elementary School declined to Warning Adequate Yearly Progress (AYP) status. In 2011, Saint Thomas Elementary School achieved AYP status.[131] In both 2009 and 2010, Saint Thomas Elementary School achieved AYP status. In 2008, the School declined to Warning AYP status due to lagging reading achievement. From 2003 through 2007, the School achieved AYP each year.
In 2012, only 59% of the students were reading on grade level (with 26% below basic) in grades 3rd through 5th. In math, just 63% of the students in 3rd through 5th grades were on grade level and 15% were below basic. In 4th grade science, 87% of the pupils were on grade level.[132] Principal: Andrew Kyle
|
5th Grade Reading: |
5th Grade Math:
|
|
|
- 4th Grade Science
- 2012 - 87%, (8% below basic). State - 82%
- 2011 - 70%, (8% below basic). State - 82.9%
|
|
Montgomery Elementary School is located at 9138 Fort Loudon Road, Mercersburg. In 2013, the school's enrollment was 264 pupils in grades kindergarten through 5th, with 31% of pupils receiving a federal free or reduced price meals due to family poverty. Additionally, 6% of the pupils receive special education services, while none of the children are identified as gifted.[136] According to a report by the Pennsylvania Department of Education, 100% of the teachers were rated highly qualified under No Child Left Behind. The school provides full day kindergarten.[137] The school is a federally designated Title I school.
According to the National Center for Education Statistics, in 2011, the school reported an enrollment of 238 pupils in grades kindergarten through 5th, with 58 pupils receiving a federal free or reduced-price lunch due to family poverty. The school is not a federally designated Title I school. The school employed 14 teachers, yielding a student–teacher ratio of 16.6:1.[138] According to a report by the Pennsylvania Department of Education, 100% of its teachers were rated "Highly Qualified" under No Child Left Behind.[139] The school has provided all-day kindergarten since 2006. A Head Start class is provided by Head Start of Franklin County and is funded by state and federal dollars.
- 2013 School Performance Profile
Montgomery Elementary School achieved a score of 80.9 out of 100. The score reflects on grade level: reading, science, writing and mathematics achievement. In 2012-13, only 74% of the students were reading on grade level in grades 3rd through 5th. In 3rd grade, 83% of the pupils were reading on grade level. In math, 86.8% were on grade level (3rd-5th grades). In 4th grade science, 91% of the pupils demonstrated on grade level understanding. In writing, only 51% of 5th grade pupils demonstrated on grade level skills.[140]
- AYP history
In 2011 and 2012, Montgomery Elementary School achieved AYP status.[141] In 2003 through 2010, Montgomery Elementary School achieved Adequate Yearly progress each school year.
- PSSA results
|
5th Grade Reading: |
5th Grade Math:
|
|
|
- 4th Grade Science
- 2012 - 89%, 54% advanced (5% below basic). State - 82%
- 2011 - 93%, 65% advanced (0% below basic). State - 82.9%
|
|
Mountain View Elementary School is located at 2311 Lemar Road, Mercersburg. In 2013, the School's enrollment was 294 pupils in grades kindergarten through 5th, with 40.4% of pupils receiving a federal free or reduced price meals due to family poverty. Additionally, 4% of the pupils receive special education services, while less than 1% are identified as gifted.[145] According to a report by the Pennsylvania Department of Education, 100% of the teachers were rated highly qualified under No Child Left Behind. The school continues to provide full day kindergarten.[146] Mountain View Elementary School is a federally designated Title I school.
According to the National Center for Education Statistics, in 2011, Mountain View Elementary School reported an enrollment of 232 pupils in grades kindergarten through 5th, with 72 pupils receiving a federal free or reduced-price lunch due to family poverty. The school is a federally designated Title I school. The school employed 16 teachers, yielding a student–teacher ratio of 14:1.[147] According to a report by the Pennsylvania Department of Education, 100% of Mountain View Elementary School teachers were rated "Highly Qualified" under No Child Left Behind.[148] Mountain View Elementary School has provided all-day kindergarten since 2006.
- 2013 School Performance Profile
Mountain View Elementary School achieved a score of 88.2 out of 100. The score reflects on grade level: reading, science, writing and mathematics achievement. In 2012-13, only 77.6% of the students were reading on grade level in grades 3rd through 5th. In 3rd grade, 78% of the pupils were reading on grade level. In math, 88.8% were on grade level (3rd-5th grades). In 4th grade science, 85% of the pupils demonstrated on grade level understanding. In writing, only 70% of 5th grade pupils demonstrated on grade level writing skills.[149]
- AYP history
In 2011 and 2012, Mountain View Elementary School achieved AYP status.[150] From 2003 through 2010, Mountain View Elementary School achieved Adequate Yearly PRogress each school year.[151]
In 2012, only 66% of the students were reading on grade level in grades 3rd through 5th, with 17% below basic. In math, 77% of the students in 3rd through 5th grades were on grade level and 40% scored advanced. In 4th grade science, 89% of the pupils were on grade level.[152] Principal: Brett Kagarise
|
5th Grade Reading: |
5th Grade Math:
|
|
|
- 4th Grade Science
- 2012 - 89%, (4% below basic). State - 82%
- 2011 - 81%, (2% below basic). State - 82.9%
|
|
Special education
In December 2013, Tuscarora School District administration reported that 304 pupils or 11.7% of the district's pupils received Special Education services, 42.8% of the identified students having a specific learning disability. In December 2012, Tuscarora School District administration reported that 323 pupils or 12.4% of the district's pupils received Special Education services, 40% of the identified students having a specific learning disability. In December 2009, the district administration reported that 387 pupils or 14.9% of the district's pupils received Special Education services.[156]
In order to comply with state and federal laws, the school district engages in identification procedures to ensure that eligible students receive an appropriate educational program consisting of special education and related services, individualized to meet student needs. At no cost to the parents, these services are provided in compliance with state and federal law; and are reasonably calculated to yield meaningful educational benefit and student progress.[157] To identify students who may be eligible for special education, various screening activities are conducted on an ongoing basis. These screening activities include: review of group-based data (cumulative records, enrollment records, health records, report cards, ability and achievement test scores); hearing, vision, motor, and speech/language screening; and review by the Special Education administration. When screening results suggest that the student may be eligible, the District seeks parental consent to conduct a multidisciplinary evaluation. Parents who suspect their child is eligible may verbally request a multidisciplinary evaluation from a professional employee of the District or contact the Special Education Department.[158][159]
In 2010, the state of Pennsylvania provided $1,026,815,000 for special education services. This funding is in addition to the state's basic education per pupil funding, as well as, all other state and federal funding.[160] The Pennsylvania Special Education funding formula assumes that 16% of the district’s students receive special education services. It also assumes that each student’s needs accrue the same level of costs.[161] Over identification of students, in order to increase state funding, has been an issue in the Commonwealth. Some districts have more than 20% of its students receiving special education services while others have 10% supported through special education.[162] The state requires each public school district and charter school to have a three-year special education plan to meet the unique needs of its special education students.[163] In 2012, the Obama Administration's US Department of Education issued a directive that schools include students with disabilities in extracurricular activities, including sports.[164]
Tuscarora School District received a $1,590,739 supplement for special education services in 2010.[165] For the 2011-12, 2012–13 and 2013-14 school years, all Pennsylvania public school districts received the same level of funding for special education that they received in 2010. This level funding is provided regardless of changes in the number of pupils who need special education services and regardless of the level of services the respective students required.[166]
Gifted education
The District Administration reported that 31 or 1.14% of its students were gifted in 2009.[167] By law, the district must provide mentally gifted programs at all grade levels. The referral process for a gifted evaluation can be initiated by teachers or parents by contacting the student’s building principal and requesting an evaluation. All requests must be made in writing. To be eligible for mentally gifted programs in Pennsylvania, a student must have a cognitive ability of at least 130 as measured on a standardized ability test by a certified school psychologist. Other factors that indicate giftedness will also be considered for eligibility.[168]
Wellness policy
Tuscarora School Board established a district wellness policy in 2007.[169] The policy deals with nutritious meals served at school, the control of access to some foods and beverages during school hours, age appropriate nutrition education for all students, and physical education for students K-12. The policy is in response to state mandates and federal legislation (P.L. 108 – 265). The law dictates that each school district participating in a program authorized by the Richard B. Russell National School Lunch Act (42 U.S.C. 1751 et seq) or the Child Nutrition Act of 1966 (42 U.S.C. 1771 et seq) "shall establish a local school wellness policy by School Year 2006." Most districts identified the superintendent and school foodservice director as responsible for ensuring local wellness policy implementation.[170]
The legislation placed the responsibility of developing a wellness policy at the local level so the individual needs of each district can be addressed. According to the requirements for the Local Wellness Policy, school districts must set goals for nutrition education, physical activity, campus food provision, and other school-based activities designed to promote student wellness. Additionally, UA public school districts were required to involve a broad group of individuals in policy development and to have a plan for measuring policy implementation. Districts were offered a choice of levels of implementation for limiting or prohibiting low nutrition foods on the school campus. In final implementation these regulations prohibit some foods and beverages on the school campus.[171] The Pennsylvania Department of Education required the district to submit a copy of the policy for approval. The Board chose to establish a Wellness Committee to oversee the District's efforts.
Tuscarora School District offers both a free school breakfast and free or reduced-price lunch to children in low income families. All students attending the school can eat breakfast and lunch. Children from families with incomes at or below 130 percent of the federal poverty level are provided a breakfast and lunch at no cost to the family. Children from families with incomes between 130 and 185 percent of the federal poverty level can be charged no more than 30 cents per breakfast. A foster child whose care and placement is the responsibility of the State or who is placed by a court with a caretaker household is eligible for both a free breakfast and a free lunch. Runaway, homeless and Migrant Youth are also automatically eligible for free meals.[172] The meals are partially funded with federal dollars through the United States Department of Agriculture.[173] In the summer of 2013, the District is providing free lunches to children to age 18 year at St. Thomas and Mercersburg Elementary Schools. This is the second year the District provided free lunches in the summer. The Healthy Hunger-Free Kids Act of 2010 mandates that Districts raise their full pay lunch prices every year until the price of non-subsidized lunches equals the amount the federal government reimburses schools for free meals. That subsidy in 2013-2014 was $2.93.
In 2013, the USDA issued new restrictions to foods in public schools. The rules apply to foods and beverages sold on all public school district campuses during the day. They limit vending machine snacks to a maximum of 200 calories per item. Additionally, all snack foods sold at school must meet competitive nutrient standards, meaning they must have fruits, vegetables, dairy or protein in them or contain at least 10 percent of the daily value of fiber, calcium, potassium, and Vitamin D.[174] In 2014, President Obama ordered a prohibition of advertisements for unhealthy foods on public school campuses during the school day.[175] The Food and Drug Administration requires that students take milk as their beverage at lunch. In accordance with this law, any student requesting water in place of milk with their lunch must present a written request, signed by a doctor, documenting the need for water instead of milk.[176][177]
Tuscarora School District provides health services as mandated by the Commonwealth and the federal government. Nurses are available in the buildings to conduct annual health screenings (data reported to the PDE and state Department of Health) and to dispense prescribed medications to students during the school day. Students can be excluded from school unless they comply with all the State Department of Health’s extensive immunization mandates. School nurses monitor each pupil for this compliance.[178][179] Nurses also monitor each child's weight.[180]
Highmark Healthy High 5 grant
In 2011, Tuscarora School District received funding through a Highmark Healthy High 5 grant. Saint Thomas Elementary School received $10,000 which was used to install a walking trail and implement a walking program for all students in grades 3 - 5.[181] Beginning in 2006, Highmark Foundation engaged in a 5-year, $100 million program to promote lifelong healthy behaviors in children and adolescents through local nonprofits and schools. The School also receive a Healthy High 5 grant in 2008.[182]
Budget
Pennsylvania public school districts budget and expend funds according to procedures mandated by the General Assembly and the Pennsylvania Department of Education (PDE). An annual operating budget is prepared by school district administrative officials. A uniform form is furnished by the PDE and submitted to the board of school directors for approval prior to the beginning of each fiscal year on July 1.
Under Pennsylvania’s Taxpayer Relief Act, Act 1 of the Special Session of 2006, all school districts of the first class A, second class, third class and fourth class must adopt a preliminary budget proposal. The proposal must include estimated revenues and expenditures and the proposed tax rates. This proposed budget must be considered by the Board no later than 90 days prior to the date of the election immediately preceding the fiscal year. The preliminary budget proposal must also be printed and made available for public inspection at least 20 days prior to its adoption. The board of school directors may hold a public hearing on the budget, but are not required to do so. The board must give at least 10 days’ public notice of its intent to adopt the final budget according to Act 1 of 2006.[183]
In 2013, the average teacher salary in Tuscarora School District was $61,176 a year, while the cost of the benefits teachers received was $23,915 per employee, for a total annual average teacher compensation of $85,092.[184] The District employed 261 teachers and administrators with a top salary of $123,604.[185]
In 2011, the average teacher salary in Tuscarora School District was $61,234 a year, while the cost of the benefits teachers received was $19,652 per employee, for a total annual average teacher compensation of $80,887.[186] In addition to their salaries the teachers receive a defined benefit pension (PSERS), health insurance, professional development reimbursement, paid personal days, 10 paid sick days which accumulate, life insurance, retirement bonus and other benefits. Two union representatives receive paid days to attend the teacher union convention each year. The Union President is allotted one paid day per month to conduct union business during the school day.[187] According to Rep. Glen Grell, a trustee of the state teacher retirement fund, a 40-year Pennsylvania public school educator can retire with a pension equal to 100 percent of their final salary.[188]
In 2009, Tuscarora School District reported employing 197 teachers and administrators with a median salary of $56,439 and a top salary of $114,005.[189][190]
In 2007, Tuscarora School District employed 180 teachers. The average teacher salary in the district was $50,704 for 187 days worked (180 pupil days).[191] As of 2007, Pennsylvania ranked in the top 10 states in average teacher salaries. When adjusted for cost of living Pennsylvania ranked fourth in the nation for teacher compensation.[192]
Administrative costs Tuscarora School District administrative costs per pupil was $537.71 in 2008. The lowest administrative cost per pupil in Pennsylvania was $398 per pupil.[193] In 2008, the district reported spending $11,242 per pupil which ranked 372nd in the Commonwealth.[194] In June 2013, the School Board approved a new Act 93 Contract Agreement with its administrators effective July 1, 2013 – June 30, 2016.
In 2012, the Tuscarora School Board sold the district office building on East Seminary Street to Twine Construction for $175,000.[195]
Per pupil spending In 2008, the Tuscarora School District administration reported that per pupil spending was $11,242 which ranked 372nd among Pennsylvania's then 501 public school districts. In 2010, the District’s per pupil spending had increased to $12,189.32.[196] In 2011, Pennsylvania’s per pupil spending was $13,467, ranking 6th in the United States.[197] In 2007, the Pennsylvania per pupil total expenditures was reported as $12,759.[198] The U.S. Census Bureau reported that Pennsylvania spent $8,191 per pupil in school year 2000-01.[199]
Among the fifty states, Pennsylvania’s total per pupil revenue (including all sources) ranked 11th at $15,023 per student, in 2008-09.[200] Pennsylvania’s total revenue per pupil rose to $16,186 ranking 9th in the nation in 2011.[201]
Reserves In 2008, the Tuscarora School District reported a balance of $2,104,471, in its unreserved-designated fund. The unreserved-undesignated fund balance was reported as $500,000.00.[202] In 2010, Tuscarora School District Administration reported an increase to $2,614,993 in the unreserved-undesignated fund balance. The District also reported $1,846,064 in its unreserved-designated fund in 2010. By 2012, the District's reserves had increased to $5,791,122.[203] In Pennsylvania public school districts, reserve funds are divided into two categories – designated and undesignated. The undesignated funds are not committed to any planned project. Designated funds and any other funds, such as capital reserves, are allocated to specific projects. School districts are required by state law to keep 5 percent of their annual spending in the undesignated reserve funds to preserve bond ratings. According to the Pennsylvania Department of Education, from 2003 to 2010, as a whole, Pennsylvania school districts amassed nearly $3 billion in reserved funds.[204] By 2013, reserves held by Pennsylvania public school districts, as a whole, had increased to over $3.8 billion.[205]
Referendum In 2008, voters in the Tuscarora School District voted down a referendum to borrow $35 million to renovate the James Buchanan High School. Over 50% of the District's registered voters participated in the referendum vote, with 72.43 percent voting against the plan to 27.57% voting to approve.[206] A $17 million renovation was completed in 2011. Changes included: new furnishings throughout the building, a new auditorium, a remodeled library, new lockers spread through the school and a brand new band room. The Board went on to renovate the elementary school, too.
Audit In June 2011, the Pennsylvania Auditor General conducted a performance audit of the Tuscarora School District. The findings were reported to the School Board and the District’s administration.[207]
Tuition Students who live in the Tuscarora School District's attendance area may choose to attend one of Pennsylvania's 157 public charter schools. A student living in a neighboring public school district or a foreign exchange student may seek admission to Tuscarora School District. For these cases, the Pennsylvania Department of Education sets an annual tuition rate for each school district. It is the amount the public school district pays to a charter school for each resident student that attends the charter and it is the amount a nonresident student's parents must pay to attend the Tuscarora School District's schools. The 2012 tuition rates are Elementary School - $6,803.28, High School - $10,000.17.[208]
Tuscarora School District is funded by a combination of: a local earned income tax 1%, a local real property tax, a real estate transfer tax 0.5%, and a per capita tax, coupled with substantial funding from the Commonwealth of Pennsylvania and the federal government.[209] While the School Board has an Amusements Tax on its books, it does not levy the tax. Grants provide an opportunity to supplement school funding without raising local taxes. In the Commonwealth of Pennsylvania, pension income and Social Security income are exempted from state personal income tax and local earned income tax, regardless of the level of the individual’s personal wealth.[210] The average Pennsylvania public school teacher pension in 2011 exceeds $60,000 a year plus they receive federal Social Security benefits: both are free of Pennsylvania state income tax and local income tax which funds local public schools.[211]
State basic education funding
According to a report from Representative Todd Stephens office, Tuscarora School District receives 31.9% of its annual revenue from the state.[212]
For the 2014-15 school year, Tuscarora School District will receive $7,857,740 in State Basic Education funding. The District will also receive $282,600 in new Ready To Learn Block grant. The State’s enacted Education Budget includes $5,526,129,000 for the 2014-2015 Basic Education Funding.[213] The Education budget also includes Accountability Block Grant funding at $100 million and $241 million in new Ready to Learn funding for public schools that focus on student achievement and academic success. The State is paying $500.8 million to Social Security on the school employees behalf and another $1.16 billion to the state teachers pension system (PSERS). In total, Pennsylvania’s Education budget for K-12 public schools is $10 billion. This was a $305 million increase over 2013-2014 state spending and the greatest amount ever allotted by the Commonwealth for its public schools.[214]
For the 2013-14 school year, Tuscarora School District received a 1.9% increase or $7,855,349 in Pennsylvania Basic Education Funding. This is $149,600 more than its 2012-13 state BEF to the District. Additionally, Tuscarora School District will receive $138,331 in Accountability Block Grant funding to focus on academic achievement and level funding for special education services. Among the public school districts in Franklin County, Chambersburg Area School District received the highest percentage increase at 2.6%. The District has the option of applying for several other state and federal grants to increase revenues. The Commonwealth’s budget increased Basic Education Funding statewide by $123 million to over $5.5 billion. Most of Pennsylvania’s 500 public school districts received an increase of Basic Education Funding in a range of 0.9% to 4%. Eight public school districts received exceptionally high funding increases of 10% to 16%. The highest increase in state funding was awarded to Austin Area School District which received a 22.5% increase in Basic Education Funding.[215] The state funded the PSERS (Pennsylvania school employee pension fund) with $1,017,000,000 and Social Security payments for school employees of $495 million.[216]
For the 2012-13 school year, the Tuscarora School District received $7,705,749 in state Basic Education funding.[217] The Governor's Executive Budget for 2012-2013 included $9.34 billion for kindergarten through 12th grade public education, including $5.4 billion in basic education funding, which was an increase of $49 million over the 2011-12 budget. In addition, the Commonwealth provided $100 million for the Accountability Block Grant (ABG) program. Tuscarora School District received $139,331 in ABG funds for 2012-13. The state also provided a $544.4 million payment for School Employees’ Social Security and $856 million for School Employees’ Retirement fund called PSERS.[218] This amount was a $21,823,000 increase (0.34%) over the 2011-2012 appropriations for Basic Education Funding, School Employees' Social Security, Pupil Transportation, Nonpublic and Charter School Pupil Transportation. Since taking office, Corbett’s first two budgets have restored more than $918 million in support of public schools, compensating for the $1 billion in federal stimulus dollars lost at the end of the 2010-11 school year.
In 2011-12 school year, Tuscarora School District received a $7,705,749 allocation, of state Basic Education Funding.[219] Additionally, the district will receive $138,330 in Accountability Block Grant funding. The enacted Pennsylvania state Education budget includes $5,354,629,000 for the 2011-2012 Basic Education Funding appropriation. This amount is a $233,290,000 increase (4.6%) over the enacted State appropriation for 2010-2011.[220] The highest increase in state basic education funding was awarded to Duquesne City School District, which got a 49% increase in state funding for 2011-12.[221] In 2010, the district reported that 782 students received free or reduced-price lunches, due to the family meeting the federal poverty level.[222]
For the 2010-11 budget year, Tucarora School District was allotted a 4.25% increase in Basic Education Funding for a total of $8,129,373. The highest increase, in Franklin County, was provided to Chambersburg Area School District which received a 7.08% increase. One hundred fifty Pennsylvania school districts received the base 2% increase. The highest increase in 2010-11 went to Kennett Consolidated School District in Chester County which received a 23.65% increase in state funding.[223] Fifteen (15) Pennsylvania public school districts received a BEF increase of greater than 10%. The state's hold harmless policy regarding state basic education funding continued where each district received at least the same amount as it received the prior school year, even when enrollment had significantly declined. The amount of increase each school district receives is set by the Governor and the Secretary of Education as a part of the state budget proposal given each February.[224]
In 2009–10 school budget year, Tuscarora School District received an 5.5% increase in Basic Education Funding for a total of $8,129,374. The highest increase in among Franklin County public school districts, went to Tuscarora School District. In Pennsylvania, over 15 school districts received Basic Education Funding increases in excess of 10% in 2009. Muhlenberg School District in Berks County received the highest with a 22.31% increase in funding. The state's Basic Education Funding to Tuscarora School District in 2008–09 was $7,705,748.90.[225] The amount of increase each school district received was determined by the Governor and the Secretary of Education through the allocation set in the state budget proposal made in February each year.[226]
The state Basic Education Funding to Tuscarora School District in 2008-09 was $7,705,748.90. In 2008, the District reported that 776 students received free or reduced-price lunches due to low family income.[227]
Accountability Block Grants
Beginning in 2004-2005, the state launched the Accountability Block Grant school funding. This program has provided $1.5 billion to Pennsylvania’s school districts. The Accountability Block Grant program requires that its taxpayer dollars are focused on specific interventions that are most likely to increase student academic achievement. These interventions include: teacher training, all-day kindergarten, lower class size K-3rd grade, literacy and math coaching programs that provide teachers with individualized job-embedded professional development to improve their instruction, before or after school tutoring assistance to struggling students. For 2010-11, the district applied for and received $375,464 in addition to all other state and federal funding. Tuscarora School District used the funding to provide all-day kindergarten; to provide teachers with training to improve instruction and to make research based changes in the curriculum and instruction.[228][229]
Classrooms for the Future grant
The Classroom for the Future state program provided districts with hundreds of thousands of extra state funding to buy laptop computers for each core curriculum high school class (English, Science, History, Math) and paid for teacher training to optimize the computers use. The program was funded from 2006-2009. Tuscarora School District Administration did not apply for funding in any of the three years of the program.[230] The highest award in Franklin County was given to Greencastle-Antrim School District which received $165,458. The highest funding statewide was awarded to Philadelphia City School District in Philadelphia County - $9,409,073. The grant program was discontinued by Governor Edward Rendell as part of the 2009-10 state budget.
Education Assistance Program
The EAP initiative provides extended learning opportunities and is designed to boost student achievement and help all students succeed by utilizing evidenced-based instructional models. The funding provides tutoring in Math and Reading for students in grades 7-12. Tutoring is provided during the school day, during study halls and after school. In 2010-11, the Tuscarora School District received $61,355.[231]
PreK Counts grant
Tuscarora School District receives state funding to provide taxpayer funded preschool at one of its elementary schools.[232][233] Enrollment for Pennsylvania Pre-K Counts is targeted to children living in families earning up to 300 percent of the federal poverty level (such as a family of four earning $67,050). In 2013, the state’s PreK Counts program received $87,284,000. In 2010, the PreK Counts program received $83.6 million statewide in Governor Corbett’s education budget. In 2007-08, the state funded Pre-K Counts at $75 million.
Other grants
Tuscarora School District did not participate in: Pennsylvania Department of Environmental Protection's Environmental Education annual grants;[234][235] PA Science Its Elementary grants (discontinued effective with 2009-10 budget by Governor Rendell),[236] 2012 Striving Readers Comprehensive Literacy grant;[237] 2012 and 2013 Pennsylvania Hybrid Learning Grants;[238] nor the federal 21st Century Learning grants.
Federal Stimulus grant
Tuscarora School District received an extra $2,672,668 in ARRA – Federal Stimulus money to be used in specific programs like special education and meeting the academic needs of low-income students. This was in addition to all regular state and federal funding.[239] This funding is for 2009-10 and 2010–2011 school years.[240] Due to the temporary nature of the funding, schools were repeatedly advised by the Pennsylvania Department of Education, the Pennsylvania Senate Education Committee, the Governor and the Pennsylvania School Board Association, to use the funds for one-time expenditures like acquiring equipment, making repairs to buildings, training teachers to provide more effective instruction or purchasing books and software.
Race to the Top grant
Tuscarora School District officials did not apply for the Race to the Top federal grant which would have brought the district millions of additional federal dollars for improving student academic achievement. Participation required the administration, the school board and the local teachers' union to sign an agreement to prioritize improving student academic success.[241] In Pennsylvania, 120 public school districts and 56 charter schools agreed to participate.[242] Pennsylvania was not approved for the grant. The failure of school districts to agree to participate was cited as one reason that Pennsylvania was not approved.[243]
Real estate taxes
Property tax rates in 2013-14 were set at 113.6500 mills by the Tuscarora School Board. A mill is $1 of tax for every $1,000 of a property's assessed value. Irregular property reassessments have become a serious issue in the commonwealth as it creates a significant disparity in taxation within a community and across a region. Property taxes, in the Commonwealth of Pennsylvania, apply only to real estate - land and buildings. The property tax is not levied on cars, business inventory, or other personal property. Certain types of property are exempt from property taxes, including: places of worship, places of burial, private social clubs, charitable and educational institutions and government property. Additionally, service related, disabled US military veterans may seek an exemption from paying property taxes. Pennsylvania school district revenues are dominated by two main sources: 1) Property tax collections, which account for the vast majority (between 75-85%) of local revenues; and 2) Act 511 tax collections, which are around 15% of revenues for school districts.[244] When a Pennsylvania public school district includes municipalities in two counties, each of which has different rates of property tax assessment, a state board equalizes the tax rates between the counties.[245] In 2010, miscalculations by the State Tax Equalization Board (STEB) were widespread in the Commonwealth and adversely impacted funding for many school districts, including those that did not cross county borders.[246]
- 2013-14 - 110.6600 mills[247]
- 2012-13 - 109.9100 mills
- 2011-12 - 107.9100 mills
- 2010-11 - 107.9100 mills.[248]
- 2009-10 - 106.3200 mills.[249]
- 2008-09 - 103.4200 mills.[250]
- 2007-08 - 99.4200 mills.[251]
According to a report prepared by the Pennsylvania Department of Education, the total real estate taxes collected by all school districts in Pennsylvania rose from $6,474,133,936 in 1999-00 to $10,438,463,356 in 2008-09.[252] The average yearly property tax paid by Franklin County residents amounts to about 2.94% of their yearly income. Franklin County is ranked 631st of the 3143 United States counties for property taxes as a percentage of median income.[253] The average yearly property tax paid by Perry County residents amounts to about 3.11% of their yearly income. Perry County is ranked 538th of the 3143 United States counties for property taxes as a percentage of median income.[254]
Act 1 Adjusted index
The Act 1 of 2006 Index regulates the rates at which each school district can raise property taxes in Pennsylvania. Districts are not permitted to raise taxes above that index, unless they allow voters to vote by referendum, or they seek an exception from the Pennsylvania Department of Education. The base index for the 2011-2012 school year is 1.4 percent, but the Act 1 Index can be adjusted higher, depending on a number of factors, such as property values and the personal income of district residents. Act 1 included 10 exceptions, including: increasing pension costs, increases in special education costs, a catastrophe like a fire or flood, increase in health insurance costs for contracts in effect in 2006 or dwindling tax bases. The base index is the average of the percentage increase in the statewide average weekly wage, as determined by the PA Department of Labor and Industry, for the preceding calendar year and the percentage increase in the Employment Cost Index for Elementary and Secondary Schools, as determined by the Bureau of Labor Statistics in the U.S. Department of Labor, for the previous 12-month period ending June 30. For a school district with a market value/personal income aid ratio (MV/PI AR) greater than 0.4000, its index equals the base index multiplied by the sum of .75 and its MV/PI AR for the current year.[255] With the 2011 state education budget, the General Assembly voted to end most of the Act 1 exceptions leaving only special education costs and pension costs. The cost of construction projects will go to the voters for approval via ballot referendum.[256]
The School District Adjusted Index for Tuscarora School District 2006-2007 through 2011-2012.[257]
|
For the 2014-2015 budget year, Tuscarora School Board applied for two exceptions to exceed their Act 1 Index limit: teacher pension costs and special education costs. In 2014-15, all Pennsylvania school districts were required to make a 21.4% of payroll payment to the teacher’s pension fund (PSERS).[261] For the school budget 2014-15, 316 Pennsylvania public school districts adopted a resolution certifying that tax rates would not be increased above its Act 1 Index limit. Another 181 school districts adopted a preliminary budget leaving open the option of exceeding the Index limit. Districts may apply for multiple exceptions each year. For the pension costs exception, 163 school districts received approval to exceed the Index in full, while others received a partial approval of their request. For special education costs, 104 districts received approval to exceed their tax limit. Seven Pennsylvania public school districts received an approval for the grandfathered construction debts exception.[262]
For the 2013-2014 budget year, Tuscarora School Board did not apply for exceptions to exceed their Act 1 Index limit. For the school budget year 2013-14, 311 Pennsylvania public school districts adopted a resolution certifying that tax rates would not be increased above their index. Another 171 school districts adopted a preliminary budget leaving open the option of exceeded the Index limit. For the exception for pension costs, 89 school districts received approval to exceed the Index in full while others received a partial approval of their request. For special education costs, 75 districts received approval to exceed their tax limit. For the pension costs exception, 169 school districts received approval to exceed the Index. Eleven Pennsylvania public school districts received an approval for grandfathered construction debts.[263]
For the 2012-2013 budget year, Tuscarora School Board did not apply for exceptions to exceed the Act 1 Index. For 2012-2013, 274 school districts adopted a resolution certifying that tax rates would not be increased above their index; 223 school districts adopted a preliminary budget leaving open the option of exceeded the Index limit. For the exception for pension costs, 194 school districts received approval to exceed the Index. For special education costs, 129 districts received approval to exceed the tax limit.[264]
For the 2011-2012 school year, Tuscarora School Board did not apply for an exception to exceed the Act 1 Index. Each year, Tuscarora School Board has the option of adopting either 1) a resolution in January certifying they will not increase taxes above their index or 2) a preliminary budget in February. A school district adopting the resolution may not apply for referendum exceptions or ask voters for a tax increase above the inflation index. A specific timeline for these decisions is published annually, by the Pennsylvania Department of Education.[265]
According to a state report, for the 2011-2012 school year budgets, 247 school districts adopted a resolution certifying that tax rates would not be increased above their index; 250 school districts adopted a preliminary budget. Of the 250 school districts that adopted a preliminary budget, 231 adopted real estate tax rates that exceeded their index. Tax rate increases in the other 19 school districts that adopted a preliminary budget did not exceed the school district’s index. Of the districts who sought exceptions: 221 used the pension costs exemption and 171 sought a Special Education costs exemption. Only 1 school district sought an exemption for Nonacademic School Construction Project, while 1 sought an exception for Electoral debt for school construction.[266]
Tuscarora School Board did not apply for any exceptions to exceed the Act 1 index for the budget in 2010-11.[267] For 2009-10, the board did not apply for exceptions.[268] In the Spring of 2010, 135 Pennsylvania school boards asked to exceed their adjusted index. Approval was granted to 133 of them and 128 sought an exception for pension costs increases.[269]
Property tax relief
In 2012, the Homestead/Farmstead Property Tax Relief from gambling for the Tuscarora School District was $126 per approved permanent primary residence and farmstead.[270] In 2009, the Homestead/Farmstead Property Tax Relief from gambling for the Tuscarora School District was $130 per approved permanent primary residence and farmstead. The relief was subtracted from the total annual school property tax bill. Property owners apply for the relief through the county Treasurer's office. Farmers can qualify for a farmstead exemption on building used for agricultural purposes. The farm must be at least 10 contiguous acres and must be the primary residence of the owner. Farmers can qualify for both the homestead exemption and the farmstead exemption.
Additionally, the Pennsylvania Property Tax/Rent Rebate program is provided for low income Pennsylvanians aged 65 and older; widows and widowers aged 50 and older; and people with disabilities age 18 and older. The income limit is $35,000 for homeowners. The maximum rebate for both homeowners and renters is $650. Applicants can exclude one-half (1/2) of their Social Security income, consequently people who have an income of substantially more than $35,000 still qualify for a rebate. Individuals must apply annually for the rebate. This tax rebate can be taken in addition to Homestead/Farmstead Property Tax Relief. In 2012, the Pennsylvania Secretary of the Treasury reported issuing more than half a million property tax rebates totaling $238 million.[271] The Property tax/rent rebate program is funded by revenues from the Pennsylvania Lottery. In 2012, these property tax rebates were increased by an additional 50 percent for senior households in the state, so long as those households have incomes under $30,000 and pay more than 15% of their income in property taxes.[272]
Extracurriculars
The District offers a wide variety of clubs, activities and an extensive, costly sports program.[273] Eligibility for participation is determined by school board policy and in compliance with standards set by the Pennsylvania interscholastic Athletics Association (PIAA). The District operates a costly indoor pool system with staffing. In 2014, the District is conducting a capital donation campaign with the goal to spend $1.9 million on sports facilities. The District is noncompliant with state law, due to failing to post its Interscholastic Athletic Opportunities Disclosure Form on its website.
By Pennsylvania law, all K-12 students residing in the district, including those who attend a private nonpublic school, cyber charter school, charter school and those homeschooled, are eligible to participate in the extracurricular programs, including all athletics. They must meet the same eligibility rules as the students enrolled in the district's schools.[274]
Sports
Athletic Director: Larry Strawoet Coaches receive compensation as outlined in the teachers' union contract. When athletic competition exceeds the regular season, additional compensation is paid.[275]
According to Pennsylvania’s Safety in Youth Sports Act, all sports coaches, paid and volunteer, are required to annually complete the Concussion Management Certification Training and present the certification before coaching.[276][277]
The District funds:
|
|
- Middle School Sports
|
|
According to PIAA directory July 2013 [278]
References
- ↑ National Center for Education Statistics, Common Core of Data - Tuscarora School District, 2013
- ↑ Pennsylvania Department of Education (October 4, 2013). "Tuscarora School District Fact Facts 2013".
- ↑ Pennsylvania Department of Education Enrollment by School District, January 2009
- ↑ US Census Bureau, American Fact Finder, 2010
- ↑ US Census Bureau, 2010 Census Poverty Data by Local Education Agency, 2011
- ↑ proximityone (2014). "School District Comparative Analysis Profiles".
- ↑ US Census Bureau, American Fact Finder, 2009
- ↑ US Census Bureau (2010). "American Fact Finder, State and County quick facts".
- ↑ US Census Bureau (September 2011). "Income, Poverty, and Health Insurance Coverage in the United States: 2010" (PDF).
- ↑ US Census Bureau (2014). "Pennsylvania Median household income, 2006-2010 by County".
- ↑ Michael Sauter & Alexander E.M. Hess, (August 31, 2013). "America's most popular six-figure jobs". USA Today.
- ↑ Pennsylvania School Code 2009
- ↑ Pennsylvania General Assembly, Pennsylvania School Code, 2013
- ↑ The Commonwealth Foundation for Public Policy Alternatives. "The Pennsylvania Project". Retrieved May 20, 2010.
- ↑ Pittsburgh Business Times (April 11, 2014). "What makes up a district's School Performance Profile score?".
- ↑ Pittsburgh Business Times, Guide to Western Pennsylvania Schools Statewide Honor Roll Rankings 2013, April 6, 2013
- ↑ Pittsburgh Business Times (April 4, 2011). "Statewide Honor Roll Ranking 2011".
- ↑ Pittsburgh Business Times (May 6, 2010). "Statewide Honor Roll Ranking 2010".
- ↑ Pittsburgh Business Times (May 23, 2007). "Three of top school districts in state hail from Allegheny County,".
- ↑ Pittsburgh Business Times, Statewide Overachivers Ranking Information, April 4, 2013
- ↑ "Overachiever statewide ranking". Pittsburgh Business Times. May 6, 2010.
- ↑ Pennsylvania Department of Education (July 2012). "Opportunity Scholarship Tax Credit Program".
- ↑ Pennsylvania Department of Education (May 2012). "Tuition rate Fiscal Year 2011-2012".
- ↑ Olsen, Laura, State list of failing schools has 53 in county, Pittsburgh Post Gazette, July 26, 2012
- ↑ Pennsylvania Department of Community and Economic Development (April 2014). "Opportunity Scholarship Tax Credit Program FAQ".
- ↑ Pennsylvania Department of Education (September 21, 2012). "Tuscarora School District AYP Overview 2012".
- ↑ Pennsylvania Department of Education, Pennsylvania Public School District AYP History, 2011
- ↑ Pennsylvania Department of Education, Pennsylvania District AYP History 2003-2010, 2011
- ↑ "2009 PSSA RESULTS Tuscarora School District". The Morning Call. 2009.
- ↑ PDE, James Buchanan High School Fast Facts 2013, October 4, 2013
- ↑ Pennsylvania Department of Education (2012). "Tuscarora School District - School AYP Data Table 2012".
- ↑ Pennsylvania Department of Education, Tuscarora School District AYP Data Table 2011, 2011
- ↑ Pennsylvania Department of Education (March 15, 2011). "New 4-year Cohort Graduation Rate Calculation Now Being Implemented".
- ↑ Pennsylvania Department of Education (February 2011). "James Buchanan Senior High School Academic Achievement Report Card 2010 data table".
- ↑ Pennsylvania Department of Education, Tuscarora Academic Achievement Report Card Report Card 2009, 2009
- ↑ The Times Tribune (June 25, 2009). "Franklin County School District Graduation rates".
- ↑ Pennsylvania Partnerships for Children. "High School Graduation rate 2007". Retrieved January 31, 2011.
- ↑ US News & World Report, (2014). "Best High Schools,".
- ↑ National Center for Education Statistics, Common Care Data -James Buchanan Senior High School, 2010
- ↑ Pennsylvania Department of Education, Professional Qualifications of Teachers James Buchanan High School 2012, September 21, 2012
- ↑ Pennsylvania Department of Education (October 4, 2013). "James Buchanan High School Academic Performance Data 2013".
- ↑ Eleanor Chute & Mary Niederberger (December 11, 2013). "New assessment shows fuller picture of Pa. schools". Pittsburgh Post-Gazette.
- ↑ Pennsylvania Department of Education (September 29, 2011). "James Buchanan Area Senior High School AYP Overview 2011".
- ↑ Pennsylvania Department of Education, James Buchanan Senior High School District Academic Achievement Report 2010, September 29, 2011
- ↑ US Department of Education (2003). "NCLB Parental Notices".
- ↑ Pennsylvania Department of Education (September 21, 2012). "School Improvement Grant".
- ↑ Pennsylvania Department of Education (2014). "State Academic Standards".
- ↑ Pennsylvania Department of Education (2014). "State Assessment System".
- ↑ Pennsylvania Department of Education (September 29, 2012). "2011-2012 PSSA and AYP Results".
- ↑ Pennsylvania Department of Education (September 29, 2011). "2010-2011 PSSA and AYP Results".
- ↑ Pennsylvania Department of Education (2010). "2009-2010 PSSA and AYP Results".
- ↑ The Times-Tribune. (September 2009). "Grading Our Schools database, 2009 PSSA results,".
- ↑ Pennsylvania Department of Education (August 15, 2008). "2007-2008 PSSA and AYP Results".
- ↑ Pennsylvania Department of Education (2007). "PSSA Math and Reading results".
- ↑ Pittsburgh Post Gazette (October 15, 2012). "How is your school doing?".
- ↑ Pennsylvania Department of Education (September 29, 2011). "James Buchanan Senior High School Academic Achievement Report Card 2011" (PDF).
- ↑ Pennsylvania Department of Education, James Buchanan Senior High School Academic Achievement Report Card 2010, October 20, 2010
- ↑ Pennsylvania Department of Education, James Buchanan Senior High School Academic Achievement Report Card 2009, September 14, 2009
- ↑ Pennsylvania Department of Education, James Buchanan Senior High School Academic Achievement Report Card 2008, August 15, 2008
- ↑ Pennsylvania Department of Education, James Buchanan Senior High School Academic Achievement Report Card 2007, 2007
- ↑ Pennsylvania Department of Education (September 21, 2012). "James Buchanan Senior High School Academic Achievement Report Card 2012" (PDF).
- ↑ Pennsylvania Department of Education (September 29, 2011). "2010-2011 PSSA results in Science".
- ↑ The Times-Tribune. (2009). "Grading Our Schools database, 2009 Science PSSA results,".
- ↑ The Pennsylvania Basic Education/Higher Education Science and Technology Partnership, Science in Motion annual report, 2012
- ↑ Pennsylvania Department of Education, (January 2009). "Pennsylvania College Remediation Report".
- ↑ National Center for Education Statistics - IPEDs
- ↑ Pennsylvania Governor's Conference on Higher Education (March 16, 2008). "Stepping It Up: Building Pathways to College Success In Pennsylvania and Nationwide" (PDF).
- ↑ US Department of Education (2009). "College and Career Ready Students" (PDF).
- ↑ Pennsylvania Department of Education (2011). "Pennsylvania Department of Education - Dual Enrollment Guidelines.".
- ↑ "Pennsylvania Transfer and Articulation Agreement.". March 2010.
- ↑ Pennsylvania Department of Education. (April 29, 2010). "Report: PA College Credit Transfer System Makes Higher Education More Affordable, Accessible,".
- ↑ Pennsylvania Department of Education (August 2009). "Dual Enrollment Fall Grants 2009-10".
- ↑ Jbhscounselingweebly.com (2009). "Profile 2008-09" (PDF).
- ↑ "Pennsylvania Code §4.24 (a) High school graduation requirements".
- ↑ Pennsylvania State Board of Education, Proposed changes to Chapter 4, May 10, 2012
- ↑ Pennsylvania Department of Education (2010). "Keystone Exam Overview" (PDF).
- ↑ Pennsylvania Department of Education (September 2011). "Pennsylvania Keystone Exams Overview".
- ↑ Pennsylvania State Board of Education (2010). "Rules and Regulation Title 22 PA School Code CH. 4".
- ↑ Pennsylvania Department of Education, State Board of Education Finalizes Adoption of Pennsylvania Common Core State Academic Standards and High School Graduation Requirements, March 14, 2013
- ↑ Pennsylvania Department of Education (2011). "Keystone Exams".
- ↑ College Board (2013). "The 2013 SAT Report on College & Career Readiness".
- ↑ Pennsylvania Department of Education (2011). "Public School SAT Scores 2011".
- ↑ College Board (September 2011). "SAT Scores State By State - Pennsylvania".
- ↑ "While U.S. SAT scores dip across the board, N.J. test-takers hold steady". NJ.com. September 2011.
- ↑ The Center for Rural Pennsylvania (August 2006). "SAT Scores and Other School Data".
- ↑ PDE, Academic Performance Data - James Buchanan High School, December 2013
- ↑ Pennsylvania Department of Education (October 4, 2013). "James Buchanan Middle School Fast Facts 2013".
- ↑ Pennsylvania Department of Education, Professional Qualifications of Teachers Middle School, October 4, 2013
- ↑ National Center for Education Statistics, Common Care Data – James Buchanan Middle School, 2011
- ↑ Pennsylvania Department of Education, Professional Qualifications of Teachers James Buchanan Middle School, September 21, 2012
- ↑ Pennsylvania Department of Education (October 4, 2013). "James Buchanan Middle School Academic Performance Data 2013,".
- ↑ Pennsylvania Department of Education (September 21, 2012). "JAMES BUCHANAN Middle School AYP Overview 2012".
- ↑ Pennsylvania Department of Education, JAMES BUCHANAN Middle School AYP Overview 2010, October 20, 2010
- ↑ Pennsylvania Department of Education (September 29, 2011). "JAMES BUCHANAN Middle School AYP Data Table".
- ↑ Pennsylvania Department of Education. "IU16-PSSA 95-96 Results by School". Retrieved May 11, 2014.
- ↑ Pennsylvania Department of Education (2014). "Standards Aligned Systems".
- ↑ Pennsylvania Department of Education (2014). "State Academic Standards".
- ↑ Pennsylvania Department of Education (2014). "State Academic Standards Mathematics".
- ↑ Pittsburgh Post Gazette (October 15, 2012). "How is your school doing?".
- ↑ Pennsylvania Department of Education, James Buchanan Middle School Academic Achievement Report Card 2009. 2009
- ↑ Pennsylvania Department of Education (August 2008). "Reading and Math PSSA 2008 by Schools".
- ↑ Pennsylvania Department of Education (September 21, 2012). "James Buchanan Middle School Academic Achievement Report Card 2012" (PDF).
- ↑ Pennsylvania Department of Education, James Buchanan Middle School Academic Achievement Report Card 2011, September 29, 2011
- ↑ Pennsylvania Department of Education Report (September 14, 2010). "2010 PSSAs: Reading, Math, Writing Results".
- ↑ Pennsylvania Department of Education. "2009 PSSAs: Reading, Math, Writing and Science Results".
- ↑ Pennsylvania Department of Education, James Buchanan Middle School Academic Achievement Report Card 2008, August 15, 2008
- ↑ Pennsylvania Department of Education Report (August 2010). "Science PSSA 2010 by Schools".
- ↑ Pennsylvania Department of Education Report (August 2009). "Science PSSA 2009 by Schools".
- ↑ Pennsylvania Department of Education Report (August 2008). "Science PSSA 2008 by Schools".
- ↑ Pennsylvania State Board of Education (2003). "PSSA results 2003".
- ↑ New America Foundation (2003). "No Child Left Behind Overview".
- ↑ The Goals of No Child Left Behind (Jul 20, 2010). "The Goals of No Child Left Behind".
- ↑ Learning Point Associates (220). "Understanding the No Child Left Behind Act" (PDF).
- ↑ Pennsylvania State Board of Education (January 11, 2003). "Pennsylvania Academic Standards Science and Technology, Ecology and Environment".
- ↑ Pennsylvania Department of Education (October 4, 2013). "Mercersburg Elementary School Fast Facts 2013".
- ↑ Pennsylvania Department of Education, School Performance Profile, Mercersburg Elementary School Fast Facts, 2013
- ↑ National Center for Education Statistics, Common Care Data – Mercersburg Elementary School, 2011
- ↑ Pennsylvania Department of Education, Professional Qualifications of Teachers Mercersburg Elementary School, September 21, 2012
- ↑ Pennsylvania Department of Education (October 4, 2013). "Mercersburg Elementary School Academic Performance Data 2013".
- ↑ Pennsylvania Department of Education, Mercersburg Elementary School AYP Overview 2012, September 21, 2012
- ↑ PDE, Mercersburg Elementary School AYP History 2003 through 2012, 2012
- ↑ Pennsylvania Department of Education (September 21, 2012). "Mercersburg Elementary School Report Card 2012" (PDF).
- ↑ Pennsylvania Department of Education (September 21, 2012). "Mercersburg Elementary School Report Card 2012" (PDF).
- ↑ Pennsylvania Department of Education, Mercersburg Elementary School Academic Report Card 2011, September 29, 2011
- ↑ Pittsburgh Post Gazette (October 15, 2012). "How is your school doing?".
- ↑ Pennsylvania Department of Education (October 4, 2013). "Saint Thomas Elementary School Fast Facts 2013".
- ↑ Pennsylvania Department of Education, School Performance Profile, Saint Thomas Elementary School Fast Facts 2013, 2013
- ↑ National Center for Education Statistics, Common Care Data – Saint Thomas Elementary School, 2011
- ↑ Pennsylvania Department of Education, Professional Qualifications of Teachers Saint Thomas Elementary School, September 21, 2012
- ↑ Pennsylvania Department of Education (October 4, 2013). "Saint Thomas Elementary School Academic Performance Data 2013".
- ↑ Pennsylvania Department of Education, Saint Thomas Elementary School AYP Overview 2012, September 21, 2012
- ↑ Pennsylvania Department of Education (September 21, 2012). "Saint Thomas Elementary School Report Card 2012" (PDF).
- ↑ Pennsylvania Department of Education (September 21, 2012). "Saint Thomas Elementary School Academic Report Card 2012" (PDF).
- ↑ Pennsylvania Department of Education, Saint Thomas Elementary School Academic Report Card 2011, September 29, 2011
- ↑ Pittsburgh Post Gazette (October 15, 2012). "How is your school doing?".
- ↑ Pennsylvania Department of Education (October 4, 2013). "Montgomery Elementary School Fast Facts 2013".
- ↑ Pennsylvania Department of Education, School Performance Profile, Elementary School Fast Facts, 2013
- ↑ National Center for Education Statistics, Common Care Data – Montgomery Elementary School, 2011
- ↑ Pennsylvania Department of Education, Professional Qualifications of Teachers Montgomery Elementary School, September 21, 2012
- ↑ Pennsylvania Department of Education (October 4, 2013). "Montgomery Elementary School Academic Performance Data 2013".
- ↑ Pennsylvania Department of Education, Montgomery Elementary School AYP Overview 2012, September 21, 2012
- ↑ Pennsylvania Department of Education (September 21, 2012). "Montgomery Elementary School Report Card 2012" (PDF).
- ↑ Pennsylvania Department of Education, Montgomery Elementary School Academic Report Card 2012, September 29, 2011
- ↑ Pittsburgh Post Gazette (October 15, 2012). "How is your school doing?".
- ↑ Pennsylvania Department of Education (October 4, 2013). "Mountain View Elementary School Fast Facts".
- ↑ Pennsylvania Department of Education, School Performance Profile, Mountain View Elementary School Fast Facts, 2013
- ↑ National Center for Education Statistics, Common Care Data – Mountain View Elementary School, 2011
- ↑ Pennsylvania Department of Education, Professional Qualifications of Teachers Mountain View Elementary School, September 21, 2012
- ↑ Pennsylvania Department of Education (October 4, 2013). "Mountain View Elementary School Academic Performance Data 2013".
- ↑ Pennsylvania Department of Education, Mountain View Elementary School AYP Overview, September 21, 2012
- ↑ Pennsylvania Department of Education, PA Public School AYP Overview 2003-2012, 2013
- ↑ Pennsylvania Department of Education (September 21, 2012). "Mountain View Elementary School Report Card 2012" (PDF).
- ↑ Pennsylvania Department of Education (September 21, 2012). "Mountain View Elementary School Report Card 2012" (PDF).
- ↑ Pennsylvania Department of Education, Mountain View Elementary School Report Card 2011, September 29, 2011
- ↑ Pittsburgh Post Gazette (October 15, 2012). "How is your school doing?".
- ↑ Pennsylvania Bureau of Special Education Services (2010). "Tuscarora School District Special Education Data Report LEA Performance on State Performance Plan (SPP) Targets".
- ↑ Pennsylvania Bureau of Special Education (2008). "Pennsylvania Parent Guide to Special Education Services".
- ↑ Tuscarora School District Administration (2011). "Special Education Department".
- ↑ Lincoln Intermediate Unit 12 (2011). "Notice of Special Education Services and Programs, Services for Gifted Students, and Services for Protected Handicapped Students".
- ↑ Pennsylvania Department of Education. "Pennsylvania Special Education Funding".
- ↑ Browne, Patrick., Senate Education Committee Hearing on Special Education Funding & Accountability testimony, November 1, 2011
- ↑ Kintisch, Baruch., Public Hearing: Special Education Funding & Accountability Testimony, Education Law Center, November 11, 2011
- ↑ Amy Morton, Executive Deputy Secretary, Public Hearing: Special Education Funding & Accountability Testimony, Pennsylvania Department of Education, November 11, 2011
- ↑ US Department of Education, U.S. Department of Education Clarifies Schools' Obligation to Provide Equal Opportunity to Students with Disabilities to Participate in Extracurricular Athletics, January 25, 2013
- ↑ Pennsylvania Department of Education (July 2010). "Special Education Funding from Pennsylvania State_2010-2011".
- ↑ Pennsylvania Department of Education (2011). "Special Education Funding 2011-2012 Fiscal Year".
- ↑ Pennsylvania Department of Education (Revised December 1, 2009 Child Count (Collected July 2010)). "Gifted Students as Percentage of Total Enrollment by School District/Charter School" (PDF). Check date values in:
|date=(help) - ↑ Pennsylvania Department of Education and Pennsylvania School Board. "CHAPTER 16. Special Education For Gifted Students". Retrieved February 4, 2011.
- ↑ Tuscarora School Board Policy Manual, Student Wellness Policy 246, February 12, 2007
- ↑ Probart C, McDonnell E, Weirich JE, Schilling L, Fekete V (September 2008). "Statewide assessment of local wellness policies in Pennsylvania public school districts.". J Am Diet Assoc. 108 (9): 1497–502. doi:10.1016/j.jada.2008.06.429. PMID 18755322.
- ↑ Pennsylvania Department of Education – Division of Food and Nutrition (July 2008). "Nutrition Standards for Competitive Foods in Pennsylvania Schools for the School Nutrition Incentive".
- ↑ USDA, Child Nutrition Programs - Eligibility Manual for School Meals, 2012
- ↑ Pennsylvania Hunger Action Center, The Pennsylvania School Breakfast Report Card, 2009
- ↑ USDA, Child Nutrition Programs, June 27, 2013
- ↑ Denver Nicks (February 25, 2014). "White House Sets New Limits on Junk Food Ads in Schools". Time Magazine.
- ↑ USDA Food and Nutrition Service (2014). "School Meals FAQ".
- ↑ Monica Eng (November 26, 2012). "Lactose intolerance: When drinking school milk makes students feel sick". Chicago Tribune.
- ↑ Pennsylvania State Department of Health (2010). "Pennsylvania Bulletin Doc. No. 10-984 School Immunizations; Communicable and Noncommunicable Diseases".
- ↑ Pennsylvania Department of Health (2014). "School Immunization Requirements".
- ↑ Pennsylvania Department of Health (2014). "MANDATED SCHOOL HEALTH SCREENINGS".
- ↑ Highmark Foundation, 2011 School Challenge Grants, 2011
- ↑ Highmark Foundation (2009). "Highmark Healthy High 5 School Challenge grant program enables Pennsylvania schools to implement or enhance healthy lifestyle programs for students".
- ↑ Pennsylvania General Assembly, Taxpayer Relief Act, Act 1 of the Special Session of 2006, June 27, 2006
- ↑ Pennsylvania Department of Education (2014). "Investing in Pennsylvania Students 2014".
- ↑ "Tuscarora School District Payroll report 2013". OpenPA Gov.org. 2014.
- ↑ Pennsylvania Department of Education (2012). "Investing in Pennsylvania Students".
- ↑ Tuscarora School Board (2008). "Tuscarora School District Teacher Employment Contract 2008- June 30, 2012" (PDF).
- ↑ Grell, Glen, Legislature must act on educators' pension hole. The Patriot News. February 21, 2010
- ↑ Asbury Park Press (2009). "PA. Public School Salaries".
- ↑ Commonwealth Foundation (2009). "Payroll Report Tuscarora School District".
- ↑ Fenton, Jacob, Average classroom teacher salary in Franklin County, 2006–07. The Morning Call. Accessed May 7, 2010.
- ↑ Teachers need to know enough is enough, PaDelcoTimes, April 20, 2010.
- ↑ Fenton, Jacob. (February 2009). "Pennsylvania School District Data: Will School Consolidation Save Money?,". The Morning Call.
- ↑ Pennsylvania Department of Education, Per pupil spending by LEA for 2007-08, 2009
- ↑ Fitch, Jennifer., Tuscarora School Board budget includes property tax hike, Herald-Mail, June 11, 2012
- ↑ Pennsylvania Department of Education (2010). "2009-10 Selected Data - 2009-10 Total Expenditures per ADM".
- ↑ US Census Bureau, States Ranked According to Per Pupil Public Elementary-Secondary School System Finance Amounts: Fiscal Year 2011, May 2013
- ↑ US Census Bureau (2009). "Total and current expenditures per pupil in fall enrollment in public elementary and secondary education, by function and state or jurisdiction: 2006-07".
- ↑ US Census Bureau (March 2003). "Public Education Finances 2000-01 Annual Survey of Local Government Finances" (PDF).
- ↑ United States Census Bureau (2009). "States Ranked According to Per Pupil Elementary-Secondary Public School System Finance Amounts: 2008-09" (PDF).
- ↑ US Census Bureau (May 2013). "States Ranked According to Per Pupil Public Elementary-Secondary School System Finance Amounts: Fiscal Year 2011" (PDF).
- ↑ Pennsylvania Department of Education. "Fund Balances by Local Education Agency 1997 to 2008".
- ↑ Pennsylvania Department of Education, Investing in Pennsylvania's Students, July 2013
- ↑ Murphy, Jan., Pennsylvania's public schools boost reserves, CentreDaily Times, September 22, 2010
- ↑ Melissa Daniels (June 1, 2013). "PA school districts look to cash stash to balance budgets". PA Independent.
- ↑ Paradise, Keith., Voters say 'No' to Tuscarora referendum, Chambersburg Public Opinion, September 9, 2008
- ↑ Pennsylvania Auditor General (June 2011). "Tuscarora School District Franklin County, Pennsylvania Performance Audit Report".
- ↑ Pennsylvania Department of Education (May 2012). "Pennsylvania Public School District Tuition Rates".
- ↑ What are the Local Taxes in Pennsylvania?, Local Tax Reform Education Project, Penn State Cooperative Extension web site. Retrieved 2010.
- ↑ Pennsylvania Department of Revenue (April 2010). "Personal Income Taxation Guidelines".
- ↑ John Finnerty (2013). "PA teachers pensions". CNHI Harrisburg Bureau.
- ↑ Pennsylvania Representative Todd Stephens (January 23, 2014). "LEEF Funding Chart 2014".
- ↑ PDE (July 7, 2014). "Enacted Education Budget 2014-2015".
- ↑ Pennsylvania Department of Education, 2014-15 Enacted Education Budget Fast Facts, July 14, 2014
- ↑ Democrat Appropriations Committee, Report on Education funding by LEA, July 2, 2013
- ↑ Pennsylvania Office of the Budget, 2013-14 State Budget Highlights, 2013
- ↑ Senator Jake Corman (June 28, 2012). "Pennsylvania Education funding by Local School District" (PDF).
- ↑ Pennsylvania General Assembly Sen Jake Corman (June 29, 2012). "SB1466 of 2012 General Fund Appropriation".
- ↑ PA Senate Appropriations Committee (June 28, 2011). "School District 2011-12 Funding Report".
- ↑ Pennsylvania Department of Education (June 30, 2011). "Basic Education Funding".
- ↑ Pennsylvania Department of Education (June 30, 2011). "Basic Education Funding 2011-2012 Fiscal Year".
- ↑ Pennsylvania Department of Education, District Allocations Report 2009, 2009-10
- ↑ PA Basic Education Funding-Printout2 2010-2011 Pennsylvania House Appropriations Committee Education Budget information, October 2010
- ↑ Office of Budget (February 2010). "Governor's Budget Proposal 2009, The Pennsylvania Department of Education Budget Proposal 2010".
- ↑ Pennsylvania Department of Education, Report on Funding by School District, October 30, 2009
- ↑ Governor's Budget Proposal 2010. released February 2010.
- ↑ Pennsylvania Department of Education, District Allocations Report 2009, 2009-10
- ↑ Pennsylvania Department of Education. "Accountability Block Grant report 2010, Grantee list 2010".
- ↑ Pennsylvania Department of Education. "Accountability Block Grant Mid Year report".
- ↑ Pennsylvania Auditor General (December 12, 2008). "Classrooms For the Future grants audit" (PDF).
- ↑ Pennsylvania Department of Education (2011). "Educational Assistance Program Funding 2010-2011 Fiscal Year".
- ↑ Office of Child Development and Early Learning (2013). "Pre-K Counts Grantees".
- ↑ Pennsylvania Department of Education - Office of Child Development and Early Learning (2013). "Applicants of PA Pre-K Counts for FY 2013" (PDF).
- ↑ Department of Environmental Protection (2014). "Environmental Education Grants".
- ↑ Pennsylvania Department of Environmental Protection (April 22, 2013). "Governor Corbett Awards 92 Grants for Environmental Education and Stewardship".
- ↑ Pennsylvania Department of Education, Science: It’s Elementary Grantees Students in 143 Schools Benefit from Intensive Science Curriculum, July 22, 2008
- ↑ Pennsylvania Department of Education (May 23, 2012). "Pennsylvania Awards $36.1 Million to Strengthen Literacy Programs".
- ↑ Pennsylvania Department of Education Press Office (October 17, 2013). "Acting Secretary of Education Says Hybrid Learning Benefits Students; Highlights Success of First-Year Pilot Program".
- ↑ Commonwealth of Pennsylvania. "Franklin County ARRA FUNDING Report". Retrieved May 11, 2010.
- ↑ "School stimulus money". Pittsburgh Post-Gazette. March 12, 2009.
- ↑ Gerald Zahorchak; Pennsylvania Secretary of Education (December 2009). "Race to the Top letter".
- ↑ Pennsylvania's 'Race to the Top' Fueled by Effective Reforms, Strong Local Support, Governor's Press Office release, January 20, 2010.
- ↑ U.S. Department of Education (March 29, 2010). "Race to the Top Fund,".
- ↑ Pennsylvania Department of Education (2004). "Act 511 Tax Report".
- ↑ State Tax Equalization Board (2011). "State Tax Equalization Board About US".
- ↑ Pennsylvania Auditor General office - Bureau of Audits (February 2011). "A Special Performance Audit of the Pennsylvania State Tax Equalization Boards" (PDF).
- ↑ Pennsylvania Department of Education (2014). "Real Estate Tax Rates by School District 2013-14 Real Estate Mills".
- ↑ Pennsylvania Department of Education (2010). "Real Estate Tax Millage by School District,".
- ↑ Pennsylvania Department of Education (2010). "Financial Elements Reports".
- ↑ Pennsylvania Department of Education (2009). "Financial Elements Reports 2008-09 Real Estate Mills".
- ↑ Pennsylvania Department of Education (2008). "Real Estate Tax Millage by School District,".
- ↑ Pennsylvania Department of Education (2009). "Pennsylvania School Finances - Summaries of Annual Financial Report Data 2008-09".
- ↑ Franklin County Property Taxes 2012, Tax-rates.org, 2012
- ↑ Perry County Property Taxes 2012, Tax-rates.org, 2012
- ↑ Pennsylvania Department of Education 2010-11 Act 1 of 2006 Referendum Exception Guidelines.
- ↑ Pittsburgh Post Gazette (July 28, 2011). "Law could restrict school construction projects". Pittsburgh Post-Gazette.
- ↑ Pennsylvania Department of Education (May 2010). "Special Session Act 1 of 2006 School District Adjusted Index for 2006-2007 through 2011-2012,".
- ↑ Pennsylvania Department of Education (May 2011). "The Index Special Session Act 1 of 2006".
- ↑ Pennsylvania Department of Education, 2013-2014 School District Adjusted Index, September 2012
- ↑ Pennsylvania Department of Education, 2014-2015 School District Adjusted Index, September 2013
- ↑ Pennsylvania School Employees, Retirement System, PSERS Chart showing payment mandates 2007-2020, 2014
- ↑ Pennsylvania Department of Education (April 30, 2014). "Report on Referendum Exceptions For School Year 2014-2015".
- ↑ Pennsylvania Department of Education, Report on Referendum Exceptions For School Year 2013-2014, April 2013
- ↑ Pennsylvania Department of Education, Report on Referendum Exceptions For School Year 2012-2013, March 30, 2012
- ↑ Pennsylvania Department of Education (2011). "Special Session Act 1 of 2006 the Taxpayer Relief Act information".
- ↑ Pennsylvania Department of Education (April 2011). "Report on Exceptions".
- ↑ Pennsylvania Department of Education (May 2010). "Report on Referendum Exceptions for 2010-2011".
- ↑ Pennsylvania Department of Education (May 2009). "Report on Referendum Exceptions for 2009-2010".
- ↑ Scarcella, Frank & Pursell, Tricia, (May 25, 2010). "Local school tax assessments exceed state averages". The Daily Item.
- ↑ Pennsylvania Department of Education (May 1, 2013). "2013-2014 Estimated State Property Tax Relief per Homestead".
- ↑ Elias, Joe., Pennsylvania Treasury Department to issue $238 million in property tax rebates, The Harrisburg Patriot-News, |June 30, 2012
- ↑ Pennsylvania Department of Revenue., Property Tax/Rent Rebate Program, June 2012
- ↑ Pennsylvania Department of Education (2013). "Disclosure of Interscholastic Athletic Opportunities".
- ↑ Pennsylvania Office of the Governor Press Release (November 10, 2005). "Home-Schooled, Charter School Children Can Participate in School District Extracurricular Activities".
- ↑ Tuscarora School Board, Tuscarora School District Teacher Union Contract, 2014
- ↑ PA General Assembly (July 1, 2012). "Senate Bill 200 of Session 2011 Safety in Youth Sports Act".
- ↑ UMPC Sports Medicine (2014). "Managing Concussions in Student Athletes: The Safety in Youth Sports Act".
- ↑ Pennsylvania Interscholastic Athletics Association (2013). "PIAA School Directory".
Franklin County, Pennsylvania Schools | |||||||||||||||||||||||
|---|---|---|---|---|---|---|---|---|---|---|---|---|---|---|---|---|---|---|---|---|---|---|---|
| |||||||||||||||||||||||
| |||||||||||||||||||||||