Recession shapes
Recession shapes are used by economists to describe different types of recessions. There is no specific academic theory or classification system for recession shapes; rather the terminology is used as an informal shorthand to characterize recessions and their recoveries.[1]
The most commonly used terms are V-shaped, U-shaped, W-shaped, and L-shaped recessions. The shapes take their names from the approximate shape economic data make in graphs during recessions. The letters can also be applied referring to the recoveries (ie "V-shaped recovery").
V-shaped recession
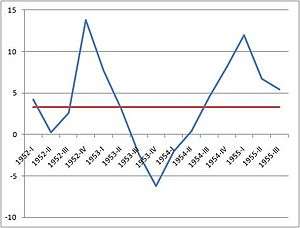
Percent Change From Preceding Period in Real Gross Domestic Product (annualized; seasonally adjusted); Average GDP growth 1947–2009
Source: Bureau of Economic Analysis
In a V-shaped recession, the economy suffers a sharp but brief period of economic decline with a clearly defined trough, followed by a strong recovery. V-shapes are the normal shape for recession: "There is a strong historical “snap back” relationship between the strength of economic recovery and the severity of the preceding recession. Thus, recessions and their recoveries have a tendency to trace out a “V” shape."[2]
A clear example of a v-shaped recession is the Recession of 1953 in the United States. In the early 1950s the economy in the United States was booming, but because the Federal Reserve expected inflation it raised interest rates, tipping the economy into recession. In 1953 growth began to slow, in the third quarter, the economy shrank by 2.4 percent. In the fourth quarter the economy shrank by 6.2 percent, and in the first quarter of 1954 it shrank by 2 percent before returning to growth. By the fourth quarter of 1954, the economy was growing at an 8 percent pace, well above the trend. Thus GDP growth for this recession forms a classic v-shape. More importantly, the GDP graph itself has a V shape.
U-shaped recession
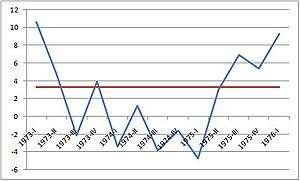
Percent Change From Preceding Period in Real Gross Domestic Product (annualized; seasonally adjusted); Average GDP growth 1947–2009
Source: Bureau of Economic Analysis
A U-shaped recession is longer than a V-shaped recession, and has a less-clearly defined trough. GDP may shrink for several quarters, and only slowly return to trend growth. Simon Johnson, former chief economist for the International Monetary Fund, says a U-shaped recession is like a bathtub: "You go in. You stay in. The sides are slippery. You know, maybe there's some bumpy stuff in the bottom, but you don't come out of the bathtub for a long time."[3]
The 1973–75 recession in the United States can be considered a U-shaped recession. In early 1973 the economy began to shrink and continued to decline or have very low growth for nearly two years. After bumping along the bottom, the economy climbed back to recovery in 1975.[1]
W-shaped recession

Percent Change From Preceding Period in Real Gross Domestic Product (annualized; seasonally adjusted); Average GDP growth 1947–2009
Source: Bureau of Economic Analysis
In a W-shaped recession, (also known as a double-dip recession), the economy falls into recession, recovers with a short period of growth, then falls back into recession before finally recovering, giving a "down up down up" pattern resembling the letter W.
The early 1980s recession in the United States is cited as an example of a W-shaped recession. The National Bureau of Economic Research considers two recessions to have occurred in the early 1980s.[4] The economy fell into recession from January 1980 to July 1980, shrinking at an 8 percent annual rate from April to June 1980. The economy then entered a quick period of growth, and in the first three months of 1981 grew at an 8.4 percent annual rate. As the Federal Reserve under Paul Volcker raised interest rates to fight inflation, the economy dipped back into recession (hence, the "double dip") from July 1981 to November 1982. The economy then entered a period of mostly robust growth for the rest of the decade.
L-shaped recession
An L-shaped recession or depression occurs when an economy has a severe recession and does not return to trend line growth [5] for many years, if ever. The steep drop or degrowth, is followed by a flat line makes the shape of an L. This is the most severe of the different shapes of recession. Alternative terms for long periods of underperformance include "depression" and lost decade; compare also "malaise".

Percent Change From Preceding Year in Real Gross Domestic Product;
Average GDP growth 1950–2000
Source: Penn World Tables
A classic example of an L-shaped recession occurred in Japan following the bursting of the Japanese asset price bubble in 1990. From the end of World War II throughout the 1980s, Japan's economy was growing robustly. In the late 1980s a massive asset-price bubble developed in Japan. After the bubble burst the economy suffered from deflation, and experienced years of sluggish growth; never returning to the higher growth Japan experienced from 1950-1990. Because the late-2000s recession in the United States followed a similar economic bubble (the United States housing bubble) some economists fear the U.S. economy could enter a prolonged period of low growth even after recovering from the recession.[6]
Other shapes
Since the terms are informal, commentators will sprinkle in other descriptions. Financial blogger Mike Shedlock describes a WW-shaped recession with the country "slipping in and out of recession for a prolonged period of time, perhaps 3-4 years or more."[7] Financier George Soros has said the current recession may be an "inverted square root sign"-shaped recession. Soros explained to Reuters that this meant: "You hit bottom and you automatically rebound some, but then you don't come out of it in a V-shape recovery or anything like that. You settle down -- step down."[8] During the 2001 recession, a trader named Thierry Martin writing for Jim Cramer's TheStreet.com proposed a J-shaped recovery, which he says was "strictly for optimists" and could be caused by "a new high-tech product category, or even a series of improving earnings reports, [that] could send us sky-high without looking back."[9] Note that the J-shaped economic recovery is unrelated to the J-curve phenomenon.
See also
References
- 1 2 3 Martha C. White (January 12, 2009). "This Recession Was Brought to You by the Letters U, V and L". The Big Money. DEAD? "This Recession Was Brought to You by the Letters U, V and L".
- ↑ James Morley (April 27, 2009). "The Shape of Things to Come" (PDF). Macro Focus. 4 (6).
- ↑ "Deciphering the Shape of Economic Recovery". PBS. June 23, 2009. (U,V,W,L)
- ↑ "NBER Business Cycle Expansions and Contractions". NBER.
- ↑ Rampell, Catherine (31 Oct 2009), The Shape of a Recession, New York Times, retrieved 8 March 2013
- ↑ Nouriel Roubini (April 7, 2008). "The US Recession: V or U or W or L-Shaped?". RGE Monitor.
- ↑ Mike Shedlock (April 8, 2008). "Case for an "L" Shaped Recession". Mish's Global Economic Trend Analysis.
- ↑ Jennifer Ablan and Daniel Burns (April 6, 2009). "Soros says U.S. faces "lasting slowdown"". Reuters.
- ↑ Marty Klinkenberg (June 16, 2001). "The Best of RealMoney Mulls the Recovery". TheStreet.com.
Further reading
- "U, V or W for recovery". The Economist. August 22, 2009. pp. 10–11. Retrieved 2009-08-30.