Very-long-baseline interferometry

Very-long-baseline interferometry (VLBI) is a type of astronomical interferometry used in radio astronomy. In VLBI a signal from an astronomical radio source, such as a quasar, is collected at multiple radio telescopes on Earth. The distance between the radio telescopes is then calculated using the time difference between the arrivals of the radio signal at different telescopes. This allows observations of an object that are made simultaneously by many radio telescopes to be combined, emulating a telescope with a size equal to the maximum separation between the telescopes.
Data received at each antenna in the array include arrival times from a local atomic clock, such as a hydrogen maser. At a later time, the data are correlated with data from other antennas that recorded the same radio signal, to produce the resulting image. The resolution achievable using interferometry is proportional to the observing frequency. The VLBI technique enables the distance between telescopes to be much greater than that possible with conventional interferometry, which requires antennas to be physically connected by coaxial cable, waveguide, optical fiber, or other type of transmission line. The greater telescope separations are possible in VLBI due to the development of the closure phase imaging technique by Roger Jennison in the 1950s, allowing VLBI to produce images with superior resolution.
VLBI is most well known for imaging distant cosmic radio sources, spacecraft tracking, and for applications in astrometry. However, since the VLBI technique measures the time differences between the arrival of radio waves at separate antennas, it can also be used "in reverse" to perform earth rotation studies, map movements of tectonic plates very precisely (within millimetres), and perform other types of geodesy. Using VLBI in this manner requires large numbers of time difference measurements from distant sources (such as quasars) observed with a global network of antennas over a period of time.
Scientific results
Some of the scientific results derived from VLBI include:
- High resolution radio imaging of cosmic radio sources.
- Imaging the surfaces of nearby stars at radio wavelengths (see also interferometry) – similar techniques have also been used to make infrared and optical images of stellar surfaces
- Definition of the celestial reference frame
- Motion of the Earth's tectonic plates
- Regional deformation and local uplift or subsidence.
- Variations in the Earth's orientation and length of day.
- Maintenance of the terrestrial reference frame
- Measurement of gravitational forces of the Sun and Moon on the Earth and the deep structure of the Earth
- Improvement of atmospheric models
- Measurement of the fundamental speed of gravity
- The tracking of the Huygens probe as it passed through Titan's atmosphere, allowing wind velocity measurements
VLBI arrays
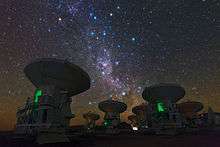
There are several VLBI arrays located in Europe, Canada, the United States, Russia, Korea, Japan, Mexico and Australia. The most sensitive VLBI array in the world is the European VLBI Network (EVN). This is a part-time array which brings together the largest European radiotelescopes for typically week-long sessions, with the data being processed at the Joint Institute for VLBI in Europe (JIVE). The Very Long Baseline Array (VLBA) uses ten dedicated, 25-meter telescopes spanning 5351 miles across the United States, and is the largest VLBI array that operates all year round as both an astronomical and geodesy instrument.[1] The combination of the EVN and VLBA is known as Global VLBI. When one or both of these arrays are combined with one or more space-based VLBI antennas such as HALCA (previously) and now with RadioAstron (Spektr-R), the resolution obtained is higher than any other astronomical instrument, capable of imaging the sky with a level of detail measured in microarcseconds. VLBI generally benefits from the longer baselines afforded by international collaboration, with a notable early example in 1976, when radio telescopes in the United States, USSR and Australia were linked to observe hydroxyl-maser sources.[2]
e-VLBI
VLBI has traditionally operated by recording the signal at each telescope on magnetic tapes or disks, and shipping those to the correlation center for replay. Recently, it has become possible to connect VLBI radio telescopes in close to real-time, while still employing the local time references of the VLBI technique, in a technique known as e-VLBI. In Europe, six radio telescopes of the European VLBI Network (EVN) are now connected with Gigabit per second links via their National Research Networks and the Pan-European research network GEANT2, and the first astronomical experiments using this new technique were successfully conducted in 2011.[3]
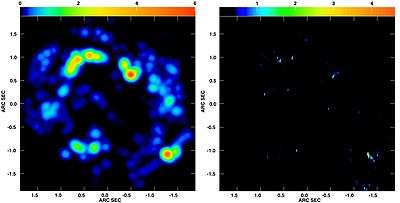
The image to the right shows the first science produced by the European VLBI Network using e-VLBI. The data from 6 telescopes were processed in real time at the European Data Processing centre at JIVE. The Netherlands Academic Research Network SURFnet provides 6 x 1 Gbit/s connectivity between JIVE and the GEANT2 network.
Space VLBI
In the quest for even greater angular resolution, dedicated VLBI satellites have been placed in Earth orbit to provide greatly extended baselines. Experiments incorporating such space-borne array elements are termed Space Very Long Baseline Interferometry (SVLBI).
The first such dedicated VLBI mission was HALCA, an 8-meter radio telescope, which was launched in February 1997 and made observations until October 2003, but due to the small size of the dish only very strong radio sources could be observed with SVLBI arrays incorporating it.
Another space VLBI mission, Spektr-R (or RadioAstron), was launched in July 2011.
How VLBI Works

In VLBI interferometry, the digitized antenna data are usually recorded at each of the telescopes (in the past this was done on large magnetic tapes, but nowadays it is usually done on large RAID arrays of computer disk drives). The antenna signal is sampled with an extremely precise and stable atomic clock (usually a hydrogen maser) that is additionally locked onto a GPS time standard. Alongside the astronomical data samples, the output of this clock is recorded on the tape/disk media. The recorded media are then transported to a central location. More recent experiments have been conducted with "electronic" VLBI (e-VLBI) where the data are sent by fibre-optics (e.g., 10 Gbit/s fiber-optic paths in the European GEANT2 research network) and not recorded at the telescopes, speeding up and simplifying the observing process significantly. Even though the data rates are very high, the data can be sent over normal Internet connections taking advantage of the fact that many of the international high speed networks have significant spare capacity at present.
At the location of the correlator the data are played back. The timing of the playback is adjusted according to the atomic clock signals on the (tapes/disk drives/fibre optic signal), and the estimated times of arrival of the radio signal at each of the telescopes. A range of playback timings over a range of nanoseconds are usually tested until the correct timing is found.
Each antenna will be a different distance from the radio source, and as with the short baseline radio interferometer the delays incurred by the extra distance to one antenna must be added artificially to the signals received at each of the other antennas. The approximate delay required can be calculated from the geometry of the problem. The tape playback is synchronized using the recorded signals from the atomic clocks as time references, as shown in the drawing on the right. If the position of the antennas is not known to sufficient accuracy or atmospheric effects are significant, fine adjustments to the delays must be made until interference fringes are detected. If the signal from antenna A is taken as the reference, inaccuracies in the delay will lead to errors and in the phases of the signals from tapes B and C respectively (see drawing on right). As a result of these errors the phase of the complex visibility cannot be measured with a very-long-baseline interferometer.


The phase of the complex visibility depends on the symmetry of the source brightness distribution. Any brightness distribution can be written as the sum of a symmetric component and an anti-symmetric component. The symmetric component of the brightness distribution only contributes to the real part of the complex visibility, while the anti-symmetric component only contributes to the imaginary part. As the phase of each complex visibility measurement cannot be determined with a very-long-baseline interferometer the symmetry of the corresponding contribution to the source brightness distributions is not known.
R. C. Jennison developed a novel technique for obtaining information about visibility phases when delay errors are present, using an observable called the closure phase. Although his initial laboratory measurements of closure phase had been done at optical wavelengths, he foresaw greater potential for his technique in radio interferometry. In 1958 he demonstrated its effectiveness with a radio interferometer, but it only became widely used for long-baseline radio interferometry in 1974. At least three antennas are required. This method was used for the first VLBI measurements, and a modified form of this approach ("Self-Calibration") is still used today.
References
- ↑ "Archived copy". Archived from the original on June 11, 2012. Retrieved May 30, 2012.
- ↑ First Global Radio Telescope, Sov. Astron., Oct 1976
- ↑ "Astronomers Demonstrate a Global Internet Telescope". Retrieved 2011-05-06.
External links
- E-MERLIN fibre-linked radio telescope array used in VLBI observations
- EXPReS Express Production Real-time e-VLBI Service: a three-year project (est. March 2006) funded by the European Commission to develop an intercontinental e-VLBI instrument available to the scientific community
- JIVE Joint Institute for VLBI in Europe
- The International VLBI Service for Geodesy and Astrometry (IVS)
- IVSOPAR: the VLBI analysis center at the Paris Observatory
- "VLBI - Canada's Role"