Wittenbach
| Wittenbach | ||
|---|---|---|
 | ||
| ||
 Wittenbach | ||
|
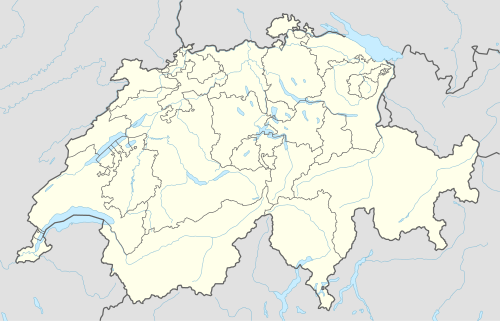
Location of Wittenbach 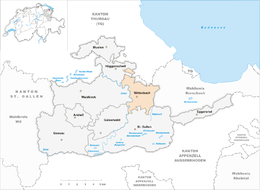 | ||
| Coordinates: 47°28′N 9°22′E / 47.467°N 9.367°ECoordinates: 47°28′N 9°22′E / 47.467°N 9.367°E | ||
| Country | Switzerland | |
| Canton | St. Gallen | |
| District | St. Gallen | |
| Government | ||
| • Mayor | Albert Etter | |
| Area[1] | ||
| • Total | 12.21 km2 (4.71 sq mi) | |
| Elevation | 603 m (1,978 ft) | |
| Population (Dec 2015[2]) | ||
| • Total | 9,652 | |
| • Density | 790/km2 (2,000/sq mi) | |
| Postal code | 9300 | |
| SFOS number | 3204 | |
| Surrounded by | Berg, Gaiserwald, Häggenschwil, Mörschwil, Roggwil (TG), St. Gallen, Waldkirch | |
| Twin towns | Wilburgstetten (Germany), Selma (Switzerland) | |
| Website |
www SFSO statistics | |

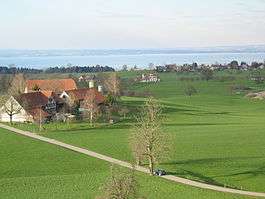
Wittenbach is a municipality in the Wahlkreis (constituency) of St. Gallen in the canton of St. Gallen in Switzerland.
History
Wittenbach is first mentioned in 1297 as Witebach.[3]
Geography
Wittenbach has an area, as of 2006, of 12.3 km2 (4.7 sq mi). Of this area, 58% is used for agricultural purposes, while 20.9% is forested. Of the rest of the land, 19.5% is settled (buildings or roads) and the remainder (1.5%) is non-productive (rivers or lakes).[4]
The municipality consists of the village sections Wittenbach, Kronbühl, Bruggwaldpark as well as scattered settlements and the exclave of Hinterberg.
Coat of arms
The blazon of the municipal coat of arms is Gules three Willows Argent issuant from a Base wavy Azure and on it a bar wavy of the second.[5]
Demographics
Wittenbach has a population (as of 31 December 2015) of 9,652.[6] As of 2007, about 21.4% of the population was made up of foreign nationals. Of the foreign population, (as of 2000), 176 are from Germany, 264 are from Italy, 829 are from ex-Yugoslavia, 87 are from Austria, 115 are from Turkey, and 322 are from another country.[7] Over the last 10 years the population has grown at a rate of 6.5%. Most of the population (as of 2000) speaks German (87.8%), with Serbo-Croatian being second most common ( 2.8%) and Albanian being third ( 2.5%).[4] Of the Swiss national languages (as of 2000), 7,448 speak German, 31 people speak French, 170 people speak Italian, and 8 people speak Romansh.[8]
The age distribution, as of 2000, in Wittenbach is; 952 children or 11.2% of the population are between 0 and 9 years old and 1,155 teenagers or 13.6% are between 10 and 19. Of the adult population, 1,043 people or 12.3% of the population are between 20 and 29 years old. 1,314 people or 15.5% are between 30 and 39, 1,227 people or 14.5% are between 40 and 49, and 1,204 people or 14.2% are between 50 and 59. The senior population distribution is 828 people or 9.8% of the population are between 60 and 69 years old, 491 people or 5.8% are between 70 and 79, there are 224 people or 2.6% who are between 80 and 89, and there are 47 people or 0.6% who are between 90 and 99, and 1 person who is 100 or more.[8]
In 2000 there were 1,076 persons (or 12.7% of the population) who were living alone in a private dwelling. There were 2,113 (or 24.9%) persons who were part of a couple (married or otherwise committed) without children, and 4,414 (or 52.0%) who were part of a couple with children. There were 554 (or 6.5%) people who lived in single parent home, while there are 35 persons who were adult children living with one or both parents, 16 persons who lived in a household made up of relatives, 38 who lived household made up of unrelated persons, and 240 who are either institutionalized or live in another type of collective housing.[8]
In the 2007 federal election the most popular party was the SVP which received 36.2% of the vote. The next three most popular parties were the CVP (20%), the FDP (14.8%) and the SP (13.8%).[4]
In Wittenbach about 71.6% of the population (between age 25-64) have completed either non-mandatory upper secondary education or additional higher education (either university or a Fachhochschule).[4] Out of the total population in Wittenbach, as of 2000, the highest education level completed by 1,795 people (21.2% of the population) was Primary, while 3,387 (39.9%) have completed their secondary education, 954 (11.2%) have attended a Tertiary school, and 326 (3.8%) are not in school. The remainder did not answer this question.[8]
The historical population is given in the following table:[3]
| year | population |
|---|---|
| 1831 | 1,322 |
| 1860 | 1,284 |
| 1900 | 1,849 |
| 1910 | 2,668 |
| 1950 | 2,393 |
| 1970 | 5,487 |
| 1990 | 7,910 |
Sights
The hamlets of Dottenwil/Unterrüti and Unterlörenis are designated as part of the Inventory of Swiss Heritage Sites.[9]
Economy
As of 2007, Wittenbach had an unemployment rate of 3.01%. As of 2005, there were 133 people employed in the primary economic sector and about 53 businesses involved in this sector. 964 people are employed in the secondary sector and there are 81 businesses in this sector. 1,758 people are employed in the tertiary sector, with 215 businesses in this sector.[4]
As of October 2009 the average unemployment rate was 4.1%.[10] There were 352 businesses in the municipality of which 86 were involved in the secondary sector of the economy while 220 were involved in the third.[11]
As of 2000 there were 1,217 residents who worked in the municipality, while 3,306 residents worked outside Wittenbach and 1,347 people commuted into the municipality for work.[12]
Religion
From the 2000 census, 3,929 or 46.3% are Roman Catholic, while 2,518 or 29.7% belonged to the Swiss Reformed Church. Of the rest of the population, there are 13 individuals (or about 0.15% of the population) who belong to the Christian Catholic faith, there are 372 individuals (or about 4.38% of the population) who belong to the Orthodox Church, and there are 206 individuals (or about 2.43% of the population) who belong to another Christian church. There are 499 (or about 5.88% of the population) who are Islamic. There are 74 individuals (or about 0.87% of the population) who belong to another church (not listed on the census), 644 (or about 7.59% of the population) belong to no church, are agnostic or atheist, and 231 individuals (or about 2.72% of the population) did not answer the question.[8]
References
- ↑ Arealstatistik Standard - Gemeindedaten nach 4 Hauptbereichen
- ↑ Swiss Federal Statistical Office - STAT-TAB, online database – Ständige und nichtständige Wohnbevölkerung nach institutionellen Gliederungen, Geburtsort und Staatsangehörigkeit (German) accessed 30 August 2016
- 1 2 Wittenbach in German, French and Italian in the online Historical Dictionary of Switzerland.
- 1 2 3 4 5 Swiss Federal Statistical Office accessed 11-January-2010
- ↑ Flags of the World.com accessed 11-January-2010
- ↑ Swiss Federal Statistical Office - STAT-TAB, online database – Ständige und nichtständige Wohnbevölkerung nach institutionellen Gliederungen, Geburtsort und Staatsangehörigkeit (German) accessed 30 August 2016
- ↑ Der Kanton St. Gallen und seine Menschen in Zahlen - Ausgabe 2009 (German) accessed 30 December 2009
- 1 2 3 4 5 Canton St. Gallen Statistics-Hauptergebnisse der Volkszählung 2000: Regionen- und Gemeindevergleich-Personen (German) accessed 30 December 2009
- ↑ ISOS site accessed 11-Jan-2010
- ↑ St Gallen Canton statistics-Unemployment (German) accessed 30 December 2009
- ↑ St Gallen Canton statistics-Businesses (German) accessed 31 December 2009
- ↑ St Gallen Canton statistics-Commuters (German) accessed 31 December 2009
External links
- Official website (German)
- Wittenbach in German, French and Italian in the online Historical Dictionary of Switzerland.
| Wikimedia Commons has media related to Wittenbach. |