1919–20 Football League
| Season | 1919–20 |
|---|---|
| Champions | West Bromwich Albion |
| Relegated | Lincoln City |
|
← 1914–15 1920–21 → | |
The 1919–1920 season was the 28th season of The Football League.
In 1919, the First Division was extended from 20 to 22 clubs. During previous expansions, the relegated clubs from the previous season were re-elected, while the top Second Division sides were promoted as usual.
Therefore Derby and Preston, the two top Second Division sides in 1915 (there had been a break for the war) did move on up. Chelsea, who had finished 19th that season, were, as expected, re-elected.
But the reason for Chelsea's escape were somewhat arbitrary. In 1915, Manchester United had, to avoid relegation, fixed their last game against Liverpool. They won 2–0 and sent Chelsea into the relegation places instead, but Liverpool chairman John McKenna must have felt some guilt, because at the League's AGM in 1919 he gave a speech insisting on the continued presence in the top flight of the Stamford Bridge club.
For some reason however, he also suggested that lowly Arsenal, who had finished fifth in the Second, should be rewarded for their long service to the League. They should replace the team which came 20th in 1915, he argued. Arsenal has never been relegated from the top flight of the English game ever since. The relegated club were Tottenham Hotspur.
In Second Division, Port Vale took over from Leeds City after 4 October 1919, when Leeds were disbanded by F.A. order following alleged irregular practices. Port Vale then inherited Leeds’ record up to that date.[1]
After the season, Grimsby Town were relegated to the newly formed Third Division. Lincoln City was not re-elected to Second Division and Leeds United was elected to replace it. Cardiff City were elected to take the second available place in Second Division.
Final league tables
The tables and results below are reproduced here in the exact form that they can be found at The Rec.Sport.Soccer Statistics Foundation website[2] and in Rothmans Book of Football League Records 1888–89 to 1978–79,[1] with home and away statistics separated.
Beginning with the season 1894–95, clubs finishing level on points were separated according to goal average (goals scored divided by goals conceded), or more properly put, goal ratio. In case one or more teams had the same goal difference, this system favoured those teams who had scored fewer goals. The goal average system was eventually scrapped beginning with the 1976–77 season.
Since the goal average was used for this purpose for such a long time, it is presented in the tables below even for the seasons prior to 1894–95, and since the goal difference is a more informative piece of information for a modern reader than the goal average, the goal difference is added in this presentation after the goal average.
During the first five seasons of the league, that is, until the season 1893–94, re-election process concerned the clubs which finished in the bottom four of the league. From the 1894–95 season and until the 1920–21 season the re-election process was required of the clubs which finished in the bottom three of the league.
First Division
| Season | 1919–20 |
|---|---|
| Champions | West Bromwich Albion (1st English title) |
| Relegated |
Notts County, The Wednesday |
| Matches played | 462 |
| Goals scored | 1332 (2.88 per match) |
| Top goalscorer | Fred Morris (West Bromwich Albion), 37 [3] |
| Biggest home win | West Brom – Notts County 8–0 (25 Oct 1919) |
| Biggest away win |
Burnley – Bradford Park Avenue 2–6 (22 Nov 1919) Preston North End –Bradford City 1–5 (1 Sep 1919) Bradford Park Avenue – West Brom 0–4 (3 Apr 1920) Derby County – West Brom 0–4 (20 Dec 1919) |
| Highest scoring | Manchester City –Blackburn 8–2 (8 Nov 1919) |
|
← 1914–15 1920–21 → | |
| Pos | Team | Pld | W | D | L | F | A | W | D | L | F | A | F | A | GA | GD | Pts | ||||
|---|---|---|---|---|---|---|---|---|---|---|---|---|---|---|---|---|---|---|---|---|---|
| 1 | West Bromwich Albion | 42 | 17 | 1 | 3 | 65 | 21 | 11 | 3 | 7 | 39 | 26 | 104 | 47 | 2.213 | +57 | 60 | ||||
| 2 | Burnley | 42 | 13 | 5 | 3 | 43 | 27 | 8 | 4 | 9 | 22 | 32 | 65 | 59 | 1.102 | +16 | 51 | ||||
| 3 | Chelsea | 42 | 15 | 3 | 3 | 33 | 10 | 7 | 2 | 12 | 23 | 41 | 56 | 51 | 1.098 | +5 | 49 | ||||
| 4 | Liverpool | 42 | 12 | 5 | 4 | 35 | 18 | 7 | 5 | 9 | 24 | 26 | 59 | 44 | 1.341 | +15 | 48 | ||||
| 5 | Sunderland | 42 | 17 | 2 | 2 | 45 | 16 | 5 | 2 | 14 | 27 | 43 | 72 | 59 | 1.220 | +13 | 48 | ||||
| 6 | Bolton Wanderers | 42 | 11 | 3 | 7 | 35 | 29 | 8 | 6 | 7 | 37 | 36 | 72 | 65 | 1.108 | +7 | 47 | ||||
| 7 | Manchester City | 42 | 14 | 5 | 2 | 52 | 27 | 4 | 4 | 13 | 19 | 35 | 71 | 62 | 1.145 | +9 | 45 | ||||
| 8 | Newcastle United | 42 | 11 | 5 | 5 | 31 | 13 | 6 | 4 | 11 | 13 | 26 | 44 | 39 | 1.128 | +5 | 43 | ||||
| 9 | Aston Villa | 42 | 11 | 3 | 7 | 49 | 36 | 7 | 3 | 11 | 26 | 37 | 75 | 73 | 1.027 | +2 | 42 | ||||
| 10 | Arsenal | 42 | 11 | 5 | 5 | 32 | 21 | 4 | 7 | 10 | 24 | 37 | 56 | 58 | 0.966 | –2 | 42 | ||||
| 11 | Bradford Park Avenue | 42 | 8 | 6 | 7 | 31 | 26 | 7 | 6 | 8 | 29 | 37 | 60 | 63 | 0.952 | –3 | 42 | ||||
| 12 | Manchester United | 42 | 6 | 8 | 7 | 20 | 17 | 7 | 6 | 8 | 34 | 33 | 54 | 50 | 1.080 | +4 | 40 | ||||
| 13 | Middlesbrough | 42 | 10 | 5 | 6 | 35 | 23 | 5 | 5 | 11 | 26 | 42 | 61 | 65 | 0.938 | –4 | 40 | ||||
| 14 | Sheffield United | 42 | 14 | 5 | 2 | 43 | 20 | 2 | 3 | 16 | 16 | 49 | 59 | 69 | 0.855 | –10 | 40 | ||||
| 15 | Bradford City | 42 | 10 | 6 | 5 | 36 | 25 | 4 | 5 | 12 | 18 | 38 | 54 | 63 | 0.857 | –9 | 39 | ||||
| 16 | Everton | 42 | 8 | 6 | 7 | 42 | 29 | 4 | 8 | 9 | 27 | 39 | 69 | 68 | 1.015 | +1 | 38 | ||||
| 17 | Oldham Athletic | 42 | 12 | 4 | 5 | 33 | 19 | 3 | 4 | 14 | 16 | 33 | 49 | 52 | 0.942 | –3 | 38 | ||||
| 18 | Derby County | 42 | 12 | 5 | 4 | 36 | 18 | 1 | 7 | 13 | 11 | 39 | 47 | 57 | 0.825 | –10 | 38 | ||||
| 19 | Preston North End | 42 | 9 | 6 | 6 | 35 | 27 | 5 | 4 | 12 | 22 | 46 | 57 | 73 | 0.781 | –16 | 38 | ||||
| 20 | Blackburn Rovers | 42 | 11 | 4 | 6 | 48 | 30 | 2 | 7 | 12 | 16 | 47 | 64 | 77 | 0.831 | –13 | 37 | ||||
| 21 | Notts County | 42 | 9 | 8 | 4 | 39 | 25 | 3 | 4 | 14 | 17 | 49 | 56 | 74 | 0.757 | –18 | 36 | ||||
| 22 | The Wednesday | 42 | 6 | 4 | 11 | 14 | 23 | 1 | 5 | 15 | 14 | 41 | 28 | 64 | 0.438 | –36 | 23 |
Pld = Matches played; W = Matches won; D = Matches drawn; L = Matches lost; F = Goals for; A = Goals against;
GA = Goal average; GD = Goal difference; Pts = Points
| Key | |
|---|---|
| League Champions | |
| FA Cup Winners | |
| Relegated |
Results
| Home ╲ Away | ARS | AST | BLB | BOL | BRA | BPA | BUR | CHE | DER | EVE | LIV | MCI | MUN | MID | NEW | NTC | OLD | PNE | SHU | SUN | WED | WBA |
| Arsenal | 0–1 | 0–1 | 2–2 | 1–2 | 3–0 | 2–0 | 1–1 | 1–0 | 1–1 | 1–0 | 2–2 | 0–3 | 2–1 | 0–1 | 3–1 | 3–2 | 0–0 | 3–0 | 3–2 | 3–1 | 1–0 | |
| Aston Villa | 2–1 | 1–2 | 3–6 | 3–1 | 1–0 | 2–2 | 5–2 | 2–2 | 2–2 | 0–1 | 0–1 | 2–0 | 5–3 | 4–0 | 3–1 | 3–0 | 2–4 | 4–0 | 0–3 | 3–1 | 2–4 | |
| Blackburn Rovers | 2–2 | 5–1 | 2–2 | 4–1 | 3–3 | 2–3 | 3–1 | 2–0 | 3–2 | 0–2 | 1–4 | 5–0 | 0–2 | 2–0 | 1–1 | 0–1 | 4–0 | 4–0 | 3–0 | 1–0 | 1–5 | |
| Bolton Wanderers | 2–2 | 2–1 | 2–1 | 1–1 | 1–2 | 1–1 | 1–2 | 3–0 | 0–2 | 0–3 | 6–2 | 3–5 | 2–1 | 0–3 | 1–0 | 1–0 | 4–1 | 1–0 | 1–0 | 2–0 | 1–2 | |
| Bradford City | 1–1 | 3–1 | 3–1 | 0–1 | 0–0 | 2–1 | 3–1 | 3–1 | 3–3 | 1–3 | 1–0 | 2–1 | 0–1 | 1–0 | 3–4 | 1–1 | 2–2 | 1–2 | 2–0 | 1–1 | 3–0 | |
| Bradford Park Avenue | 0–0 | 6–1 | 5–2 | 2–0 | 0–0 | 0–1 | 1–0 | 1–1 | 0–2 | 1–2 | 2–1 | 1–4 | 1–1 | 0–1 | 0–1 | 2–0 | 3–3 | 1–0 | 2–2 | 3–0 | 0–4 | |
| Burnley | 2–1 | 0–0 | 3–1 | 2–1 | 1–1 | 2–6 | 2–3 | 2–0 | 5–0 | 1–2 | 2–0 | 2–1 | 5–3 | 1–0 | 2–1 | 2–1 | 1–1 | 2–2 | 2–1 | 2–0 | 2–2 | |
| Chelsea | 3–1 | 2–1 | 2–1 | 2–3 | 1–0 | 4–0 | 0–1 | 0–0 | 0–1 | 1–0 | 1–0 | 1–0 | 3–1 | 0–0 | 2–0 | 1–0 | 4–0 | 1–0 | 2–0 | 1–1 | 2–0 | |
| Derby County | 2–1 | 1–0 | 0–0 | 1–2 | 3–0 | 0–0 | 0–2 | 5–0 | 2–1 | 3–0 | 0–0 | 1–1 | 1–2 | 1–0 | 3–1 | 1–1 | 2–0 | 5–1 | 3–1 | 2–1 | 0–4 | |
| Everton | 2–3 | 1–1 | 3–0 | 3–3 | 4–1 | 2–0 | 2–2 | 2–3 | 4–0 | 0–0 | 2–0 | 0–0 | 5–2 | 4–0 | 1–2 | 0–2 | 0–1 | 3–0 | 1–3 | 1–1 | 2–5 | |
| Liverpool | 2–3 | 2–1 | 3–0 | 2–0 | 2–1 | 3–3 | 0–1 | 0–1 | 3–0 | 3–1 | 1–0 | 0–0 | 1–0 | 1–1 | 3–0 | 2–2 | 1–2 | 2–0 | 3–2 | 1–0 | 0–0 | |
| Manchester City | 4–1 | 2–2 | 8–2 | 1–4 | 1–0 | 4–1 | 3–1 | 1–0 | 3–1 | 1–1 | 2–1 | 3–3 | 1–0 | 0–0 | 4–1 | 3–1 | 1–0 | 3–3 | 1–0 | 4–2 | 2–3 | |
| Manchester United | 0–1 | 1–2 | 1–1 | 1–1 | 0–0 | 0–1 | 0–1 | 0–2 | 0–2 | 1–0 | 0–0 | 1–0 | 1–1 | 2–1 | 0–0 | 1–1 | 5–1 | 3–0 | 2–0 | 0–0 | 1–2 | |
| Middlesbrough | 1–0 | 1–4 | 2–2 | 1–3 | 4–0 | 1–2 | 4–0 | 0–0 | 2–0 | 1–1 | 3–2 | 0–2 | 1–1 | 0–1 | 5–2 | 1–0 | 4–1 | 1–0 | 0–2 | 3–0 | 0–0 | |
| Newcastle United | 3–1 | 2–0 | 0–0 | 0–1 | 0–1 | 4–0 | 0–0 | 3–0 | 0–0 | 3–0 | 3–0 | 3–0 | 2–1 | 0–0 | 2–1 | 0–1 | 1–0 | 2–1 | 2–3 | 1–1 | 0–2 | |
| Notts County | 2–2 | 2–1 | 5–0 | 2–2 | 5–2 | 0–2 | 2–0 | 0–1 | 2–2 | 1–1 | 1–0 | 4–1 | 0–2 | 1–1 | 0–0 | 2–1 | 1–2 | 2–2 | 2–2 | 3–1 | 2–0 | |
| Oldham Athletic | 3–0 | 0–3 | 0–0 | 2–0 | 0–1 | 2–2 | 1–0 | 1–0 | 3–0 | 4–1 | 1–1 | 1–3 | 0–3 | 1–2 | 1–0 | 0–0 | 4–1 | 4–0 | 2–1 | 1–0 | 2–1 | |
| Preston North End | 1–1 | 3–0 | 0–0 | 1–1 | 1–5 | 0–3 | 0–1 | 3–1 | 1–1 | 1–1 | 2–1 | 1–1 | 2–3 | 3–1 | 2–3 | 2–0 | 2–1 | 2–0 | 5–2 | 3–0 | 0–1 | |
| Sheffield United | 2–0 | 1–2 | 2–0 | 3–2 | 0–0 | 2–2 | 1–3 | 3–1 | 0–0 | 1–1 | 3–2 | 3–1 | 2–2 | 5–1 | 2–1 | 3–0 | 1–0 | 2–1 | 3–1 | 3–0 | 1–0 | |
| Sunderland | 1–1 | 2–1 | 2–0 | 2–0 | 2–0 | 2–0 | 3–0 | 3–2 | 2–1 | 2–3 | 0–1 | 2–1 | 3–0 | 1–1 | 2–0 | 3–1 | 3–0 | 1–0 | 3–2 | 2–1 | 4–1 | |
| The Wednesday | 1–2 | 0–1 | 0–0 | 0–2 | 1–0 | 0–1 | 3–1 | 0–2 | 2–0 | 1–0 | 2–2 | 0–0 | 1–3 | 0–1 | 0–1 | 0–0 | 1–0 | 0–1 | 2–1 | 0–2 | 0–3 | |
| West Bromwich Albion | 1–0 | 1–2 | 5–2 | 4–1 | 4–1 | 3–1 | 4–1 | 4–0 | 3–0 | 4–3 | 1–1 | 2–0 | 2–1 | 4–1 | 3–0 | 8–0 | 3–1 | 4–1 | 0–2 | 4–0 | 1–3 |
Source:
1 ^ The home team is listed in the left-hand column.
Colours: Blue = home team win; Yellow = draw; Red = away team win.
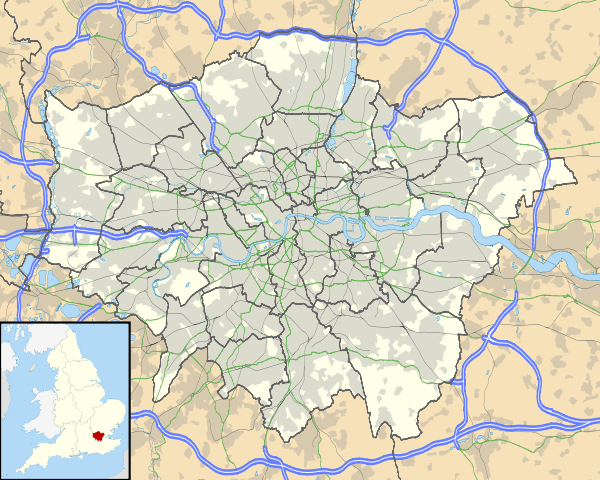
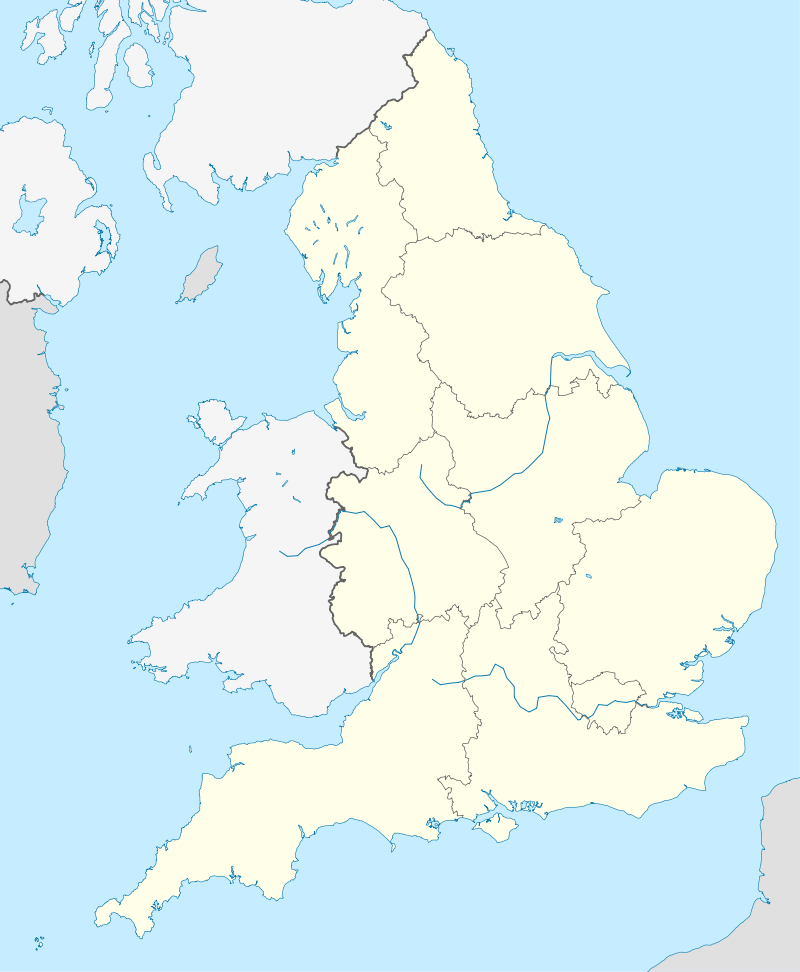
Maps
Second Division
| Season | 1919–20 |
|---|---|
| Champions | Tottenham Hotspur (1st title) |
| Relegated | Grimsby Town |
| Failed re-election | Lincoln City |
| Matches played | 462 |
| Goals scored | 1285 (2.78 per match) |
| Top goalscorer | Sammy Taylor (Huddersfield Town), 35 [3] |
| Biggest home win | Birmingham – Nottingham Forest 8–0 (10 Mar 1920) |
| Biggest away win |
Barnsley – Birmingham 0–5 (14 Feb 1920) Leicester City – Bury 0–5 (10 Apr 1920) |
| Highest scoring | Hull – Wolverhampton 10–3 (27 Dec 1919) |
|
← 1914–15 1920–21 → | |
| Pos | Team | Pld | W | D | L | F | A | W | D | L | F | A | F | A | GA | GD | Pts | ||||
|---|---|---|---|---|---|---|---|---|---|---|---|---|---|---|---|---|---|---|---|---|---|
| 1 | Tottenham Hotspur | 42 | 19 | 2 | 0 | 60 | 11 | 13 | 4 | 4 | 42 | 21 | 102 | 32 | 3.188 | +70 | 70 | ||||
| 2 | Huddersfield Town | 42 | 16 | 4 | 1 | 58 | 13 | 12 | 4 | 5 | 39 | 25 | 97 | 38 | 2.553 | +59 | 64 | ||||
| 3 | Birmingham | 42 | 14 | 3 | 4 | 54 | 16 | 10 | 5 | 6 | 31 | 18 | 85 | 34 | 2.500 | +51 | 56 | ||||
| 4 | Blackpool | 42 | 13 | 4 | 4 | 40 | 18 | 8 | 6 | 7 | 25 | 29 | 65 | 47 | 1.383 | +18 | 52 | ||||
| 5 | Bury | 42 | 14 | 4 | 3 | 35 | 15 | 6 | 4 | 11 | 25 | 29 | 60 | 44 | 1.364 | +16 | 48 | ||||
| 6 | Fulham | 42 | 11 | 6 | 4 | 36 | 18 | 8 | 3 | 10 | 25 | 32 | 61 | 50 | 1.220 | +11 | 47 | ||||
| 7 | West Ham United | 42 | 14 | 3 | 4 | 34 | 14 | 5 | 6 | 10 | 13 | 26 | 47 | 40 | 1.175 | +7 | 47 | ||||
| 8 | Bristol City | 42 | 9 | 9 | 3 | 30 | 18 | 4 | 8 | 9 | 16 | 25 | 46 | 43 | 1.070 | +3 | 43 | ||||
| 9 | South Shields | 42 | 13 | 5 | 3 | 47 | 18 | 2 | 7 | 12 | 11 | 30 | 58 | 48 | 1.208 | +10 | 42 | ||||
| 10 | Stoke | 42 | 13 | 3 | 5 | 37 | 15 | 5 | 3 | 13 | 23 | 39 | 60 | 54 | 1.111 | +6 | 42 | ||||
| 11 | Hull City | 42 | 13 | 4 | 4 | 53 | 23 | 5 | 2 | 14 | 25 | 49 | 78 | 72 | 1.083 | +6 | 42 | ||||
| 12 | Barnsley | 42 | 9 | 5 | 7 | 41 | 28 | 6 | 5 | 10 | 20 | 27 | 61 | 55 | 1.109 | +6 | 40 | ||||
| 13 | Port Vale[4] | 42 | 11 | 3 | 7 | 35 | 27 | 5 | 5 | 11 | 24 | 35 | 59 | 62 | 0.952 | –3 | 40 | ||||
| 14 | Leicester City | 42 | 8 | 6 | 7 | 26 | 29 | 7 | 4 | 10 | 15 | 32 | 41 | 61 | 0.672 | –20 | 40 | ||||
| 15 | Clapton Orient | 42 | 14 | 3 | 4 | 34 | 17 | 2 | 3 | 16 | 17 | 42 | 51 | 59 | 0.864 | –8 | 38 | ||||
| 16 | Stockport County | 42 | 11 | 4 | 6 | 34 | 24 | 3 | 5 | 13 | 18 | 37 | 52 | 61 | 0.852 | –9 | 37 | ||||
| 17 | Rotherham County | 42 | 10 | 4 | 7 | 32 | 27 | 3 | 4 | 14 | 19 | 56 | 51 | 83 | 0.614 | –32 | 34 | ||||
| 18 | Nottingham Forest | 42 | 9 | 4 | 8 | 23 | 22 | 2 | 5 | 14 | 20 | 51 | 43 | 73 | 0.589 | –30 | 31 | ||||
| 19 | Wolverhampton Wanderers | 42 | 8 | 4 | 9 | 41 | 32 | 2 | 6 | 13 | 14 | 48 | 55 | 80 | 0.688 | –25 | 30 | ||||
| 20 | Coventry City | 42 | 7 | 7 | 7 | 20 | 26 | 2 | 4 | 15 | 15 | 47 | 35 | 73 | 0.479 | –38 | 29 | ||||
| 21 | Lincoln City[5] | 42 | 8 | 6 | 7 | 27 | 30 | 1 | 3 | 17 | 17 | 71 | 44 | 101 | 0.436 | –57 | 27 | ||||
| 22 | Grimsby Town[6] | 42 | 8 | 4 | 9 | 23 | 24 | 2 | 1 | 18 | 11 | 51 | 34 | 75 | 0.453 | –41 | 25 |
- 1 2 Ian Laschke: Rothmans Book of Football League Records 1888–89 to 1978–79. Macdonald and Jane’s, London & Sydney, 1980.
- ↑ "England 1919-20". Rec.Sport.Soccer Statistics Foundation. Archived from the original on 5 February 2010. Retrieved 2010-02-24.
- 1 2 "English League Leading Goalscorers". RSSSF. Retrieved 2010-10-31.
- ↑ Leeds City were expelled from the league after 8 games; Port Vale, formerly Burslem Port Vale, took their place and inherited their record.
- ↑ Lincoln City were not re-elected, but they returned to the league later, for the season 1921–22, surfacing this time in 3rd Division North, after
having been absent only for one season. - ↑ Grimsby Town participated in the Football League Third Division during the following season.
Pld = Matches played; W = Matches won; D = Matches drawn; L = Matches lost; F = Goals for; A = Goals against;
GA = Goal average; GD = Goal difference; Pts = Points
| Key | |
|---|---|
| Division Champions, promoted | |
| Promoted | |
| New club in the league (see also Coventry City) | |
| Re-elected | |
| Relegated | |
| Failed re-election |
Results
Note: Port Vale takes over from Leeds City and then inherits the latter’s record up to that date.
| Home ╲ Away | BAR | BIR | BLP | BRI | BRY | CLA | COV | FUL | GRI | HUD | HUL | LEE | LEI | LIN | NOT | PTV | ROT | SSH | STP | STK | TOT | WHU | WOL |
| Barnsley | 0–5 | 1–1 | 0–0 | 1–3 | 2–1 | 1–0 | 4–1 | 0–1 | 3–3 | 2–3 | 0–1 | 5–3 | 2–2 | 1–0 | 4–0 | 0–1 | 0–0 | 1–2 | 3–0 | 7–0 | 4–1 | ||
| Birmingham City | 0–0 | 4–2 | 1–0 | 0–2 | 2–1 | 4–1 | 2–0 | 4–0 | 4–2 | 4–1 | 0–1 | 7–0 | 8–0 | 3–0 | 2–2 | 4–0 | 1–1 | 2–1 | 0–1 | 0–1 | 2–0 | ||
| Blackpool | 0–2 | 3–0 | 0–0 | 1–0 | 3–0 | 2–0 | 1–1 | 2–0 | 0–3 | 2–1 | 4–2 | 3–0 | 6–0 | 3–2 | 5–1 | 0–3 | 1–0 | 3–1 | 0–1 | 0–0 | 1–1 | ||
| Bristol City | 3–1 | 1–1 | 0–0 | 1–0 | 1–1 | 1–0 | 0–3 | 3–1 | 2–1 | 2–2 | 0–0 | 6–0 | 0–0 | 1–1 | 2–1 | 3–1 | 1–0 | 1–2 | 1–2 | 0–0 | 1–1 | ||
| Bury | 2–0 | 1–0 | 1–2 | 0–1 | 3–0 | 2–2 | 2–2 | 1–1 | 2–0 | 2–0 | 1–0 | 3–0 | 1–1 | 2–1 | 4–1 | 2–1 | 0–2 | 1–0 | 2–1 | 1–0 | 2–0 | ||
| Clapton Orient | 2–0 | 2–1 | 3–0 | 1–0 | 2–1 | 2–2 | 0–1 | 3–0 | 0–1 | 2–2 | 3–0 | 1–0 | 1–0 | 2–1 | 1–2 | 4–0 | 2–1 | 2–1 | 0–4 | 1–0 | 0–0 | ||
| Coventry City | 1–0 | 1–3 | 0–0 | 0–0 | 2–1 | 0–0 | 0–1 | 2–0 | 0–2 | 0–1 | 0–4 | 1–2 | 2–0 | 4–2 | 1–1 | 1–1 | 1–1 | 3–2 | 0–5 | 0–0 | 1–0 | ||
| Fulham | 1–1 | 1–2 | 1–2 | 1–1 | 1–0 | 2–1 | 0–0 | 2–1 | 2–2 | 1–0 | 5–0 | 3–0 | 1–0 | 4–0 | 3–0 | 1–0 | 4–1 | 0–0 | 1–4 | 1–2 | 1–1 | ||
| Grimsby Town | 1–1 | 0–3 | 1–1 | 2–2 | 1–2 | 2–0 | 0–1 | 0–2 | 1–0 | 2–1 | 1–2 | 2–2 | 1–0 | 2–0 | 0–1 | 3–1 | 0–3 | 2–0 | 2–0 | 0–1 | 0–1 | ||
| Huddersfield Town | 4–1 | 0–0 | 1–3 | 1–0 | 5–0 | 2–1 | 5–0 | 3–0 | 3–0 | 2–0 | 0–0 | 4–2 | 2–1 | 4–1 | 7–1 | 2–2 | 5–0 | 3–0 | 1–1 | 2–0 | 2–0 | ||
| Hull City | 3–1 | 0–0 | 0–1 | 0–0 | 4–2 | 3–1 | 0–1 | 2–0 | 4–1 | 1–4 | 1–1 | 5–1 | 5–2 | 2–0 | 1–0 | 3–0 | 4–1 | 3–0 | 1–3 | 1–1 | 10–3 | ||
| Leeds City | 1–0 | 3–0 | 1–2 | 1–1 | |||||||||||||||||||
| Leicester City | 0–0 | 1–0 | 2–3 | 2–1 | 0–5 | 1–1 | 1–0 | 3–2 | 2–0 | 0–4 | 3–2 | 4–0 | 0–0 | 0–1 | 1–1 | 0–0 | 0–2 | 3–1 | 2–4 | 0–0 | 1–2 | ||
| Lincoln City | 0–4 | 2–2 | 0–3 | 0–0 | 2–1 | 2–1 | 4–1 | 0–1 | 2–0 | 1–3 | 2–0 | 0–3 | 1–4 | 0–0 | 0–0 | 1–1 | 2–0 | 2–1 | 1–1 | 1–4 | 4–0 | ||
| Nottingham Forest | 0–1 | 1–2 | 2–0 | 1–2 | 1–0 | 2–1 | 2–1 | 0–3 | 2–0 | 1–2 | 0–2 | 0–0 | 2–1 | 0–1 | 4–1 | 0–0 | 1–1 | 0–2 | 1–1 | 2–1 | 1–0 | ||
| Port Vale | 0–2 | 1–3 | 3–1 | 2–2 | 4–2 | 3–4 | 2–1 | 0–0 | 1–2 | 1–0 | 4–1 | 4–2 | 1–0 | 2–0 | 0–3 | 0–1 | 1–0 | ||||||
| Rotherham County | 1–0 | 0–3 | 1–2 | 2–2 | 1–2 | 3–1 | 4–3 | 1–1 | 3–1 | 1–3 | 1–2 | 1–0 | 3–0 | 2–0 | 2–2 | 1–0 | 1–0 | 1–3 | 1–1 | 0–1 | 2–0 | ||
| South Shields | 0–0 | 1–0 | 6–0 | 0–2 | 0–0 | 2–0 | 1–0 | 2–0 | 2–0 | 1–2 | 7–1 | 2–0 | 2–2 | 5–2 | 2–0 | 6–2 | 3–2 | 2–2 | 0–3 | 3–0 | 0–0 | ||
| Stockport County | 1–0 | 2–1 | 0–0 | 2–3 | 1–1 | 3–1 | 1–1 | 2–1 | 1–2 | 1–2 | 3–1 | 0–2 | 3–0 | 0–0 | 0–4 | 4–1 | 1–0 | 3–1 | 1–2 | 1–0 | 4–1 | ||
| Stoke | 2–0 | 0–1 | 2–0 | 2–0 | 1–1 | 2–0 | 6–1 | 1–0 | 3–0 | 0–1 | 3–1 | 3–0 | 1–3 | 0–2 | 0–0 | 3–0 | 0–0 | 2–1 | 1–3 | 2–1 | 3–0 | ||
| Tottenham Hotspur | 4–0 | 0–0 | 2–2 | 2–0 | 2–1 | 2–1 | 4–1 | 4–0 | 3–1 | 2–0 | 4–0 | 4–0 | 6–1 | 5–2 | 2–0 | 2–0 | 2–0 | 2–0 | 2–0 | 2–0 | 4–2 | ||
| West Ham United | 0–2 | 1–2 | 1–0 | 2–0 | 1–0 | 0–1 | 2–0 | 0–1 | 1–0 | 1–1 | 2–1 | 1–0 | 1–1 | 5–1 | 3–1 | 2–1 | 1–0 | 3–0 | 1–1 | 2–1 | 4–0 | ||
| Wolverhampton Wanderers | 2–4 | 0–2 | 0–3 | 3–1 | 0–1 | 1–2 | 2–0 | 2–1 | 6–1 | 2–3 | 4–2 | 2–4 | 1–1 | 4–0 | 4–0 | 0–1 | 0–0 | 2–2 | 4–0 | 1–3 | 1–1 |
Source: Ian Laschke: Rothmans Book of Football League Records 1888–89 to 1978–79. Macdonald and Jane’s, London & Sydney, 1980.
1 ^ The home team is listed in the left-hand column.
Colours: Blue = home team win; Yellow = draw; Red = away team win.
Maps
See also
References
- Ian Laschke: Rothmans Book of Football League Records 1888–89 to 1978–79. Macdonald and Jane’s, London & Sydney, 1980.