2012 Pacific hurricane season
 | |
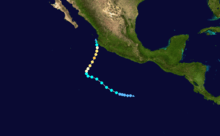
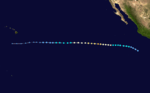
| Season summary map | |
| First system formed | May 14, 2012 |
|---|---|
| Last system dissipated | November 3, 2012 |
| Strongest storm1 | Emilia – 945 mbar (hPa) (27.91 inHg), 140 mph (220 km/h) |
| Total depressions | 17 |
| Total storms | 17 |
| Hurricanes | 10 |
| Major hurricanes (Cat. 3+) | 5 |
| Total fatalities | 8 total |
| Total damage | $27.9 million (2012 USD) |
| 1Strongest storm is determined by lowest pressure | |
2010, 2011, 2012, 2013, 2014 | |
| Related article | |
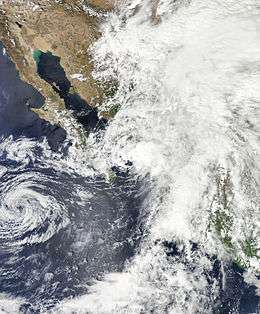
The 2012 Pacific hurricane season was a moderately active Pacific hurricane season that saw an unusually high number of tropical cyclones pass west of the Baja California Peninsula. The season officially started on May 15 in the eastern Pacific, and on June 1 in the central Pacific, and ended on November 30; these dates conventionally delimit the period during which most tropical cyclones form in the northeastern Pacific Ocean. However, with the formation of Tropical Storm Aletta on May 14 the season slightly exceeded these bounds.
Hurricane Bud intensified into the first major hurricane of the season, one of three to do so in the month of May. In mid-June, Hurricane Carlotta came ashore near Puerto Escondido, Mexico. Seven people were killed by Carlotta and damage amounted to US$12.4 million. Hurricane Paul brought significant damage to Baja California Sur. Tropical Storms Hector, John, Kristy, and Norman, as well as Hurricane Fabio all threatened land; however, damage from these storms were relatively minor.
Seasonal forecasts
| Source | Date | Named storms |
Hurricanes | Major hurricanes | |
| Average (1971–2006) | 15.3 | 8.8 | 4.2 | ||
| Record high activity | 27 | 16 (tie) | 11 | ||
| Record low activity | 8 (tie) | 3 | 0 (tie) | ||
| ––––––––––––––––––––––––––––––––––––––––––––––––––––––– | |||||
| CPC | May 24, 2012 | 12-18 | 5-9 | 2-5 | |
| ––––––––––––––––––––––––––––––––––––––––––––––––––––––– | |||||
| Actual activity | 17 | 10 | 5 | ||
On May 24, the Climate Prediction Center released its pre-season outlook. The scientists stated a 30% chance of a below-normal season, a 50% chance of a near-normal season and a 20% chance of an above-normal season. The climatologists expected 12–18 named storms, with 5–9 becoming hurricanes, and 2–5 becoming major hurricanes. The below-normal activity forecast was because of increased wind shear and a high expectation of El Niño-Southern Oscillation (ENSO)-neutral conditions throughout the peak in the later months of summer, together with lingering La Niña conditions at the beginning of the season, even though there had already been two named systems – one tropical storm and one major hurricane – in the month of May.[1]
Seasonal summary

The season was relatively active. Hurricane Bud became a major hurricane in May, marking the third occurrence of such.[2] Hurricane Carlotta threatened Mexico in mid-June. In July three hurricanes developed, two of which reached major hurricane strength. With the formation of Hurricane Fabio on July 12, the season was a month ahead of normal.[3]
The first tropical cyclone, Tropical Storm Aletta, developed on May 14, which was about a day before the normal start of the season. The final storm of the year, Tropical Storm Rosa, dissipated on November 3. Storm activity in the Central Pacific Hurricane Center's area of responsibility was below average, with no tropical cyclones forming in the region. However one tropical cyclone, Hurricane Daniel, entered the Central Pacific, as a tropical storm.
The Accumulated Cyclone Energy (ACE) for the season was 98.[nb 1]
Storms
Tropical Storm Aletta
| Tropical storm (SSHWS) | |||
|---|---|---|---|
| |||
| Duration | May 14 – May 19 | ||
| Peak intensity | 50 mph (85 km/h) (1-min) 1000 mbar (hPa) | ||


During the early morning hours of May 12, the National Hurricane Center began to monitor an area of disturbed weather that had developed roughly 550 mi (890 km) to the south-southwest of Acapulco.[4] Moving towards the west-northwest, the system was assessed with a high chance of becoming a tropical cyclone over the next 48 hours during the afternoon hours of the following day as shower and thunderstorm activity had become better defined.[5] The disturbance continued to organize, and by early on May 14, it was deemed sufficiently well organized to be declared as Tropical Depression One-E, a day before the official start of the 2012 Pacific hurricane season.[6] Embedded within a favorable environment for further intensification, the tropical depression intensified into Tropical Storm Aletta at 0000 UTC on May 15.[7] Twelve hours later the tropical storm attained its peak intensity with winds of 50 mph (80 km/h) and a minimum barometric pressure of 1,000 mbar (30 inHg) before weakening ensued as Aletta entered an environment characterized by moderate vertical wind shear and an increasingly stable air mass. Late on May 16, Aletta was downgraded to a tropical depression,[8] and the system was declared post-tropical two days later after it was unable to sustain deep thunderstorm activity atop the low-level center for at least twelve hours.[9] The remnants of the storm completely dissipated on May 21.[10]
Hurricane Bud
| Category 3 hurricane (SSHWS) | |||
|---|---|---|---|
| |||
| Duration | May 20 – May 26 | ||
| Peak intensity | 115 mph (185 km/h) (1-min) 961 mbar (hPa) | ||
On May 12, a low pressure system formed just south of eastern Panama. The storm slowly organized as it moved westwards. On May 15, the storm acquired a burst of convection, and the NHC began to monitor the system.[11] As the storm turned west-northwestwards, it organized significantly. On May 17, wind shear began to erode the storm's convection, weakening the system and causing it to stall, although the system continued to persist. On May 20, the storm strengthened rapidly, as it began moving again and that night the NHC reported that the storm had strengthened into Tropical Depression Two-E.[12] Then, as it slightly accelerated to the west, the storm continued to organize, eventually intensifying into Tropical Storm Bud on May 22, with 40 mph (65 km/h) sustained winds.[13] Bud remained at this intensity for one day before strengthening, starting early on May 23, and reached winds of 65 mph (100 km/h) during the afternoon.[14] By the next morning, Bud continued its rapid intensification, reaching sustained winds of 85 mph (145 km/h),[15] and then 110 mph (175 km/h) by the afternoon, as the system turned northward.[16] Later on the same day, Bud turned to the northeast, and began to approach the coast of Western Mexico.[17] Late on May 24, Bud intensified further into a Category 3 major hurricane, and obtained a peak intensity of 115 mph (185 km/h) winds, with a minimum central low pressure of 961 millibars.[18] Hurricane Bud was able to maintain Category 3 intensity for the next several hours, even as its outer rainbands began moving onshore in Western Mexico. Early on May 25, Hurricane Bud weakened down to a strong Category 2 hurricane.[19] Hurricane Bud rapidly began to weaken, as it slowly moved onshore. Bud quickly lost most of its convection, which was sheared mainly to the north. During the mid-afternoon of May 25, Bud weakened down to a strong tropical storm, as it began making landfall on Western Mexico.[20] Further weakening ensued over the next 24 hours, and Bud degenerated into a remnant low early on May 26.[21]
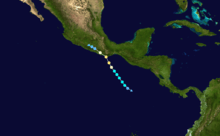
Hurricane Carlotta
| Category 2 hurricane (SSHWS) | |||
|---|---|---|---|
| |||
| Duration | June 14 – June 16 | ||
| Peak intensity | 110 mph (175 km/h) (1-min) 973 mbar (hPa) | ||
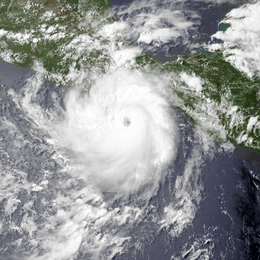
A tropical wave in the Eastern Pacific quickly became organized on June 13,[22] and became Tropical Depression Three-E early the next day.[23] The National Hurricane Center upgraded it to a Tropical Storm and named it "Carlotta" that afternoon.[24] Carlotta passed over very favorable environmental conditions that allowed further intensification into a strong Category 2 hurricane.[25] On June 16, Carlotta weakened back slightly and then made landfall near Puerto Escondido, Mexico, with maximum winds of 105 mph (165 km/h).[26] After making its landfall, Carlotta quickly weakened to a tropical depression because of the mountainous terrain along the coastline.[27] Carlotta continued to move westward, and soon dissipated to a remnant low, late on June 16. Its remnants later merged with another trough of low pressure.[28]
Upon formation, hurricane watches were issued for the southern coastline of Mexico.[23] This was later upgraded to a warning when Carlotta became a hurricane.[29] The storm made landfall in southern Mexico, bringing with it heavy rains and gusty winds which caused flash floods and numerous landslides along the area, primarily the state of Oaxaca. Due to the severity of the situation in Oaxaca the governor requested for a state of emergency to be declared to his state.[30] Throughout Mexico, seven people were killed by Carlotta and damage amounted to MX$1.4 billion (US$107.7 million).[31][32]
Hurricane Daniel
| Category 3 hurricane (SSHWS) | |||
|---|---|---|---|
| |||
| Duration | July 4 – July 12 | ||
| Peak intensity | 115 mph (185 km/h) (1-min) 961 mbar (hPa) | ||

Early on July 2, the National Hurricane Center began monitoring an area of disturbed weather about 475 mi (764 km) south-southeast of Acapulco. Over the next 24 hours, the disturbance continued to become increasingly better organized, and a Tropical Cyclone Formation Alert was issued on the system early on July 3.[33] By early on July 4, the system had gained enough organization to be declared as Tropical Depression Four-E.[34] On July 5, Four-E became Tropical Storm Daniel.[35] The cyclone then slowly intensified, and after having been situated over a favorable environment for two days, it intensified into a hurricane.[36] Overnight July 7 to July 8, Daniel rapidly intensified further into a Category 2 hurricane with sustained winds of 105 mph (165 km/h).[37] Just hours later, Daniel reached its peak intensity of 115 mph (185 km/h) and a central pressure of 961 millibars, a Category 3 hurricane, although the eye was already over cooler waters.[38] However, Daniel only maintained Category 3 status briefly, and six hours later, the eye became less well-defined and the storm weakened back to a Category 2 hurricane.[39] The system maintained this intensity for a while, but by July 9, the hurricane weakened further to a Category 1.[40] Early on July 10, Daniel continued to weaken, eventually becoming a small, shallow tropical storm over a low ocean heat content.[41] The storm then crossed 140°W into the central Pacific as a heavily sheared tropical storm with little convection.[42] On July 11, Daniel's low level circulation center started to become exposed under moderate vertical wind shear. It further weakened into a tropical depression later that day[43] and then degenerated into a remnant low east-southeast of Hawaii, as it became a convectionless vortex.[44] The remnants persisted for almost a week after weakening below tropical depression intensity, and eventually brushed Hawaii with little to no effects.[45] The remnant low of Daniel continued westward for the next couple of days, before dissipating on July 14.[46]
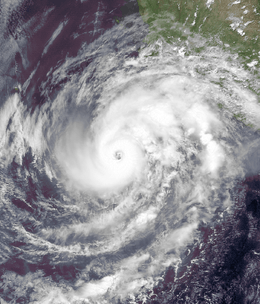
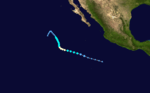
Hurricane Emilia
| Category 4 hurricane (SSHWS) | |||
|---|---|---|---|
| |||
| Duration | July 7 – July 15 | ||
| Peak intensity | 140 mph (220 km/h) (1-min) 945 mbar (hPa) | ||
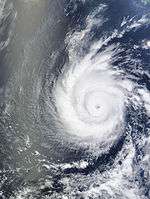

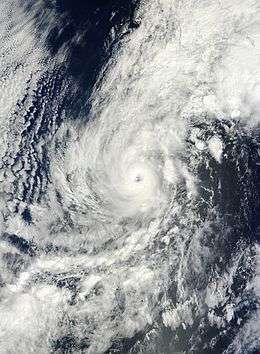
A small but well-defined area of disturbed weather became organized enough to be declared as Tropical Depression Five-E on July 7, about 500 mi (800 km) south-southwest of Acapulco.[47] Later the same day the depression gained sufficient organization to be classified as a tropical storm, receiving the name "Emilia", the fifth named storm of the season.[48] Emilia reached hurricane status early on July 9.[49] and began to rapidly intensify into a Category 3 hurricane as the eastern outflow channel from Daniel that had previously inhibited development weakened and allowed Emilia to ventilate its core in all directions.[50] Early on July 10, Emilia reached its peak intensity as a Category 4 hurricane with sustained winds of 140 mph (220 km/h) and a barometric pressure of 945 mbar.[51] After its peak, Emilia began to fluctuate between a strong Category 2 hurricane and a weak Category 3 hurricane.[52] Although the storm was over cool waters, it was able to maintain this intensity because of its annular structure. However, late on July 12, the eye disappeared from satellite imagery and the storm weakened to a Category 1 hurricane.[53] Early the next morning, it was observed that Emilia passed just north of Daniel's path days earlier, which was a hostile environment. In response to this, the storm dropped to below hurricane status.[54] For a brief period while at tropical storm strength, Emilia passed over a tongue of warmer Sea Surface Temperatures, causing its convection to blossom slightly and weakening to temporarily halt. However, Emilia quickly encountered colder waters and drier air, once again, and weakened to a minimal tropical storm, as a result.[55] Early on July 15, the system transitioned into a post-tropical cyclone, and became an exposed, convectionless vortex.[56] It followed a similar track to Hurricane Daniel. On July 17, the remnant low of Emilia passed south of Hawaii, with little effects.[57] The remnant low of Emilia continued westward for another day, until it dissipated on July 18.[58]
Hurricane Fabio
| Category 2 hurricane (SSHWS) | |||
|---|---|---|---|
| |||
| Duration | July 12 – July 18 | ||
| Peak intensity | 110 mph (175 km/h) (1-min) 966 mbar (hPa) | ||

Early on July 12, a well-defined area of low pressure south of Mexico gained enough organization to be declared as Tropical Depression Six-E.[59] Just hours after formation, the sustained winds exceeded 38 miles per hour, and organization became sufficient enough for the depression to be upgraded to Tropical Storm Fabio, the sixth named storm of the season.[60] During the afternoon hours of July 13, Fabio intensified into a Category 1 hurricane, with sustained winds of 80 mph (130 km/h).[61] Later that night, Fabio continued to intensify, and became a strong Category 1 with 90 mph (150 km/h) sustained winds.[62] The storm maintained this intensity for a while, before rapidly and unexpectedly intensifying into a 110 mph (175 km/h) Category 2 hurricane during the afternoon hours of July 14, as it was being noticed that the cyclone's eye became better-defined, the cloud tops cooled and the system became more symmetric.[63][64] In fact, it is possible that Fabio briefly became a Category 3 hurricane early on July 15 when the satellite signature was most distinct.[63] However, less than 24 hours after becoming a Category 2, the storm began ingesting drier air and was situated over cooler waters, causing it to progressively weaken to below hurricane strength.[65] By July 17, the system's center was devoid of most convection and had weakened down to tropical depression status off the coast of central Baja California.[66] The remnant circulation continued northward, however, and associated clouds and moisture began streaming over Southern California on July 18, eventually streaming into Central California and Northern California, until early on July 20, when the remnants left the state, moving into Nevada.[67]
Hurricane Gilma
| Category 1 hurricane (SSHWS) | |||
|---|---|---|---|
| |||
| Duration | August 7 – August 11 | ||
| Peak intensity | 80 mph (130 km/h) (1-min) 984 mbar (hPa) | ||
Late on August 5, the National Hurricane Center began monitoring an area of disturbed weather about 500 mi (805 km) south-southwest of Acapulco, Mexico, characterized by disorganized shower and thunderstorm activity.[68] Quick organization occurred, and a day later, the system was given a high chance of tropical cyclone development within 48 hours.[69] After a subsequent increase in shower and thunderstorm activity, the NHC determined that the low had acquired enough organization to be declared a tropical depression at 0600 UTC on August 7.[70] Initially, the depression, which was upgraded to Tropical Storm Gilma early that same day,[71] was forecast to reach cooler sea surface temperatures within four days, limiting the storm's chances of becoming a hurricane. However, following a quicker rate of intensification than originally anticipated, the NHC stated that Gilma had acquired enough organization to be upgraded to the sixth hurricane of the season at 0300 UTC on August 9, simultaneously reaching its peak intensity of 80 mph.[72][73] Shortly thereafter, the cyclone entered cooler waters, and weakened to a tropical storm during the afternoon hours of the same day.[74] The tropical cyclone further weakened to a tropical depression early on August 11, and transitioned into a post-tropical cyclone that afternoon, well away from land.[75] During the next few days, the remnants of Gilma curved towards the north and then the west, before dissipating early on August 14.[76]
Tropical Storm Hector
| Tropical storm (SSHWS) | |||
|---|---|---|---|
| |||
| Duration | August 11 – August 16 | ||
| Peak intensity | 50 mph (85 km/h) (1-min) 995 mbar (hPa) | ||

A trough of low pressure, formed from the remnants of Hurricane Ernesto in the Atlantic, began to organize, and by the evening hours of August 11, the NHC declared the formation of Tropical Depression Eight-E.[77] The next day, the depression intensified to Tropical Storm Hector, the eighth named storm of the 2012 season.[78] Hector moved slowly towards the west, with slight changes in strength during its entirety. Because of the strong vertical wind shear and marginally warm water around Hector, not much strengthening was anticipated, but instead weakened over the next several days. It never intensified above tropical storm strength, where it remained until further weakening to a tropical depression on August 15.[79] The next day on August 16, as Hector lacked numerous thunderstorms surrounding its center, it was declared post-tropical.[80] During the next several days, Hector slowly curved towards the east, before dissipating on August 20.[81]
Hector brought waves up to 12 ft (3.7 m) in the port of Mazatlan, subsequently; authorities restricted boating access. The storm also brought intervals of heavy showers, gusty winds exceeding 40 mph and hot temperatures in most municipalities in Sinaloa.[82] 400 people were evacuated in Los Cabos due to flooding.[83] 100 people were left homeless.[84]
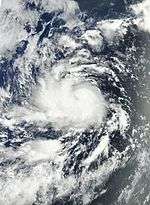
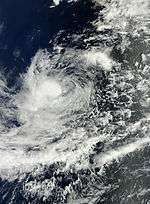
Hurricane Ileana
| Category 1 hurricane (SSHWS) | |||
|---|---|---|---|
| |||
| Duration | August 27 – September 2 | ||
| Peak intensity | 85 mph (140 km/h) (1-min) 978 mbar (hPa) | ||
.jpg)

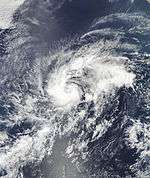
The low pressure system that was to become Hurricane Ileana began from a tropical wave that is first monitored by the National Hurricane Center on August 23. Development of the said wave is expected if it reaches more favorable conditions.[85] Moving towards the north-west, the low began to organize, and by August 27, the low organized to become the ninth tropical depression of the season.[86] The depression continued to show signs of organization, and later that day it was upgraded to Tropical Storm Ileana, the ninth named storm of the season.[87] Ileana took advantage of the warm sea surface temperature and low vertical wind shear and became better organized; such substantial strengthening would make Ileana a hurricane, peaking as an 85 mph (145 km/h) Category 1 hurricane on August 29.[88] Ileana would not maintain hurricane strength for long, and, as predicted, weakened back to tropical storm status on August 31 as it began to turn west.[89] Weakening continued as Ileana traversed cooler sea surface temperatures and encountered increasing wind shear and more stable air environment. The storm weakened to a tropical depression on September 2, further weakened into a post-tropical cyclone after failing to sustain deep convection for over twelve hours.[90] However, the remnants continued moving southwestward into the Central Pacific over the next 4 days, before finally dissipating on September 6.[91]
Tropical Storm John
| Tropical storm (SSHWS) | |||
|---|---|---|---|
| |||
| Duration | September 2 – September 4 | ||
| Peak intensity | 45 mph (75 km/h) (1-min) 1000 mbar (hPa) | ||

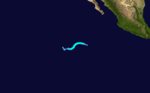
A large area of low pressure well west of Central America formed on August 29. Over the next couple of days, the system began to slowly organize as it was in an area of favorable conditions for further development.[92] By September 1, another area of low pressure had formed just offshore Mexico, just east of the organizing low, and that same day it eventually absorbed the weaker low; this gives an extra hint for the formation of Tropical Depression Ten-E, which was south of Baja California.[93] The next day, the depression became the tenth storm of the 2012 season; however, no significant strengthening was anticipated because of moderate to high vertical wind shear in addition to the marginally warm sea surface temperature along John's path.[94] John remained a very weak tropical storm; it never exceeded 40 mph winds throughout its lifetime, and the main low level circulation was always separated from the main canopy of thunderstorms due to the increasing easterly wind shear.[95] It only maintained tropical storm intensity for 18 hours; after that it weakened to a tropical depression.[96] It held onto tropical depression status for another 18 hours, before becoming post-tropical on the following day.[97] However, the remnant low of John continued moving northwestward for the next 3 days, before dissipating on September 7.[98]
John brought rain and wind to the Baja California Peninsula; the Los Cabos port was closed for small craft.[99]
Tropical Storm Kristy
| Tropical storm (SSHWS) | |||
|---|---|---|---|
| |||
| Duration | September 12 – September 17 | ||
| Peak intensity | 60 mph (95 km/h) (1-min) 998 mbar (hPa) | ||


On September 9, an area of low pressure formed west of Central America. The disturbance was expected to strengthen within the next couple of days, with conditions conducive for development.[100] During the next several days, the low edged a little close towards the coast of Western Mexico, but interaction with land did not inhibit further development of this area of low pressure into the eleventh tropical depression of the season.[101] The depression then became Tropical Storm Kristy that same day. The system was insistent on maintaining its intensity even though structure and organization began to collapse because of the unfavorable environment it encountered.[102] September 16, Kristy was downgraded to a tropical depression, and was declared post-tropical the following day, as from a lack of deep convection. The following day, wind warnings were placed in effect for the Baja California Peninisula from the remnants associated with Kristy.[103] Kristy also threatened Southern Mexico.[104] During the next several days, Kristy's remnants turned towards the east before looping back towards the south, until the system dissipated very early on September 20.[105]
Hurricane Lane
| Category 1 hurricane (SSHWS) | |||
|---|---|---|---|
| |||
| Duration | September 15 – September 19 | ||
| Peak intensity | 85 mph (140 km/h) (1-min) 985 mbar (hPa) | ||


Lane formed from an area of low pressure that formed just west of Tropical Storm Kristy on September 13. At first, development was not expected as it was forecast to interact with Tropical Storm Kristy.[106] Nevertheless, the system moved away from Kristy and organized into the twelfth depression of the season, on September 15.[107][108] Twelve-E became better organized that day, and was upgraded to Tropical Storm Lane, the twelfth named storm of the season.[109] At first, Lane was expected to remain a tropical storm before weakening because of it approaching less favorable conditions. However, due to the improving satellite appearance, and some additional intensification overnight, Lane was forecast to become a hurricane within 24 hours. Lane was upgraded to hurricane status at 0900 UTC on Monday, September 17,[110] maintaining that status for approximately 30 hours before being downgraded back to a tropical storm at 1500 UTC, on Tuesday, September 18.[111] Lane quickly degenerated into a tropical depression, and then a remnant low during the next day. The remnant low of Lane continued moving westward for another day, before dissipating on September 20.[112]
Hurricane Miriam
| Category 3 hurricane (SSHWS) | |||
|---|---|---|---|
| |||
| Duration | September 22 – September 27 | ||
| Peak intensity | 120 mph (195 km/h) (1-min) 959 mbar (hPa) | ||
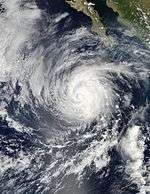

On September 22, an area of low pressure that had been organizing for a couple of days became defined enough to be declared as Tropical Depression Thirteen-E.[113] It soon strengthened to Tropical Storm Miriam, and began to further intensify over a very favorable environment.[114] On September 23, rapid intensification was noted as a distinct possibility[115] as vertical wind shear was forecast to remain under 5 knots for the next 36 hours. Later that evening, Miriam intensified from a 70 mph tropical storm at 2 pm PDT[116] to a 90 mph Category 1 hurricane at 8 pm.[117] Miriam continued to intensify on the 24th, developing a 10 nautical mile wide eye[118] and by 8 am PDT that day, it became a Category 3 major hurricane with maximum sustained winds of 120 mph.[119] Miriam maintained this intensity for 12 hours before weakening back into a Category 2 at 8 pm PDT the same day.[120] Miriam began to gradually weaken and weakened to a tropical storm with 70 mph winds at 2 am PDT on the 26th.[121] Miriam continued to steadily weaken over colder sea surface temperatures and became a tropical depression on the 27th as the last of the deep convection dissipated, as the moisture separated from the storm, and began streaming over Baja California.[122] Miriam became a remnant low just 6 hours later.[123] As Miriam lost its convection, the moisture drifted over the Baja California Peninsula, and into Texas.[124] The remnant low of Hurricane Miriam continued to drift southward, until it dissipated early on October 3.[125]
Tropical Storm Norman
| Tropical storm (SSHWS) | |||
|---|---|---|---|
| |||
| Duration | September 28 – September 29 | ||
| Peak intensity | 50 mph (85 km/h) (1-min) 997 mbar (hPa) | ||

Early on September 25, the National Hurricane Center began monitoring an area of disturbed weather a few hundred miles south of Acapulco, Mexico.[126] This system originally lacked a well-defined center and was broad in size, but gradually organized as it moved towards the north-northwest.[127] Satellite, ship, and buoy observations early on September 28 revealed that the low had become much better defined, and at 1500 UTC, the first advisory was issued on Tropical Storm Norman, located at the time about 85 mi (135 km) east of Cabo San Lucas, Mexico.[128] Norman weakened as it approached the coast of western Mexico and it became a tropical depression on September 29.[129] The depression made landfall about just west of Topolobampo, but quickly emerged into the Gulf of California.[130] The last of the deep convection associated with Norman dissipated early on September 29,[131] and Norman became a post-tropical remnant low later that day.[132] Early on September 30, the remnant low of Norman dissipated.[133][134]
Tropical Storm Olivia
| Tropical storm (SSHWS) | |||
|---|---|---|---|
| |||
| Duration | October 6 – October 8 | ||
| Peak intensity | 60 mph (95 km/h) (1-min) 997 mbar (hPa) | ||

An area of low pressure that formed in the eastern Pacific quickly began to organize and eventually gained enough convection and organization to be declared Tropical Depression Fifteen-E on October 6.[135] However, the environment was only marginal for development, and NHC forecaster Lixion Avila only forecasted Fifteen-E to become a 40 mph tropical storm before weakening.[135] Over the next several hours, a convective cloud band gained curvature over the northwest quadrant of the circulation and a central dense overcast persisted,[136] and on this basis and Dvorak classifications, Fifteen-E was upgraded to Tropical Storm Olivia with an estimated wind speed of 45 mph.[136] Despite the convective banding breaking off and becoming disconnected from the inner circulation of Olivia overnight, Dvorak T-numbers suggested that Olivia packed 60 mph winds.[137] Olivia moved over very warm water (29 degrees C), but stopped strengthening on the morning of the 7th as it lost its banding features.[138] However, the central dense overcast expanded and forecasters noted that additional strengthening was a possibility.[138] Olivia continued moving northward, but with no change in strength until the afternoon of October 8, when the low-level circulation became exposed to the southwest of the main area of deep convection around 6:00 AM PDT.[139] At 2:00 PM PDT the same day, it was reported that the deep convection was located about 100 nautical miles away from the low-level center.[139] As southwesterly shear remained strong, the low- and mid-level centers of Olivia completely decoupled late on October 8, with last-light visible satellite imagery showing it as a swirl of low clouds with the strongest convection a few hundred miles away from the center.[140] At 2:00 AM PDT on October 9, Olivia was declared post-tropical, as it had not been producing significant deep convection for the past 6 to 12 hours and the low-level center was moving even further away from the few convective cells that remained.[141] The cyclone was expected to weaken and open up into a trough within 48 hours at the time of the last discussion.[141] Late on October 10, the remnant of Olivia dissipated.[142][143]
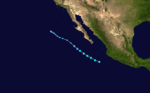
Hurricane Paul
| Category 3 hurricane (SSHWS) | |||
|---|---|---|---|
| |||
| Duration | October 13 – October 17 | ||
| Peak intensity | 120 mph (195 km/h) (1-min) 959 mbar (hPa) | ||

Early on October 10, the National Hurricane Center first began monitoring a trough of low pressure off the southern coast of Mexico. With a disorganized area of convection, the system moved slowly westward, and conditions allowed for gradual development.[144] Initially, upper-level winds were only marginally favorable, and although the thunderstorms remained disorganized, the NHC estimated a 50% chance for development by early on October 12.[145] The next day, the system became better defined,[146] and the NHC classified it as Tropical Storm Paul at 2100 UTC that day, about 660 mi (1065 km) south-southwest of the southern tip of the Baja California Peninsula. Upon forming, Paul skipped the tropical depression stage, and it had a well-defined circulation with organized convection. It moved westward due to a mid-level ridge that extended westward from Mexico.[147]
Warm waters, very little wind shear, and a moist environment allowed Paul to quickly intensify and developed organized rainbands.[148] Easterly wind shear was the primary inhibitor factor of rapid intensification. On October 14, Paul began moving northward while rounding a ridge, also influenced by an upper-level low west of Baja California.[149] An eye began developing early on October 15,[150] and later that day Paul intensified into a hurricane.[151] The cloud pattern became increasingly symmetrical,[152] and the storm underwent rapid deepening on October 15. It developed a well-defined eye, prompting the NHC to estimate peak winds of 120 mph (190 km/h); this made it the fifth major hurricane season of the season.[153] However, increasing southwesterly wind shear quickly imparted weakening, causing the eye to deteriorate by early on October 16. Shortly thereafter, the NHC reported that Paul was no longer a major hurricane.[154] During the afternoon hours of October 17, Paul was downgraded to a tropical depression,[155] and hours later, the storm was declared a remnant low.[156] The remnant low of Hurricane Paul persisted for another day, before dissipating on October 18.[157] During the next two days, remnant moisture from Paul caused drizzle and light rain across Southern California.
Across the city of La Paz, damage to roads was estimated at MX$200 million (US$15.5 million).[158]
Tropical Storm Rosa
| Tropical storm (SSHWS) | |||
|---|---|---|---|
| |||
| Duration | October 30 – November 3 | ||
| Peak intensity | 50 mph (85 km/h) (1-min) 1001 mbar (hPa) | ||

On October 30 the NHC issued a special advisory to the effect that a low pressure system located well to the southwest of Cabo San Lucas had organized rather quickly and was being classified as a tropical depression.[159] In light shear conditions it soon strengthened to become Tropical Storm Rosa,[160] and continued to strengthen as it drifted slowly west then southwest.[161] On November 2, increasing westerly shear caused Rosa to weaken steadily,[162] Rosa degenerated into a remnant low late on November 3.[163] The remnants of Rosa persisted for another couple of days, before dissipating on November 5.[164]
Storm names
The following names will be used for named storms that form in the Eastern Pacific in 2012. No names were retired during the 35th session of the RA IV hurricane committee on April 11, 2013. The names will be used in the 2018 season, as none were retired. This was the same list used in the 2006 season.
|
For storms that form in the Central Pacific Hurricane Center's area of responsibility, encompassing the area between 140 degrees west and the International Date Line, all names are used in a series of four rotating lists. The next four names that were slated for use in 2012 are shown below, however none of them were used.
|
|
|
|
Season effects
This is a table of all of the storms in the 2012 Pacific hurricane season. It includes their durations, peak intensities, names, landfall(s), damages, and death totals. Deaths in parentheses are additional and indirect (an example of an indirect death would be a traffic accident), but are still storm-related. Damage and deaths include totals while the storm was extratropical, a wave, or a low. All of the damage figures are in 2012 USD.
| Saffir–Simpson hurricane wind scale | ||||||
| TD | TS | C1 | C2 | C3 | C4 | C5 |
| Storm name |
Dates active | Storm category
at peak intensity |
Max 1-min wind mph (km/h) |
Min. press. (mbar) |
Areas affected | Damage (millions USD) |
Deaths | |||
|---|---|---|---|---|---|---|---|---|---|---|
| Aletta | May 14 – May 19 | Tropical storm | 50 (85) | 1000 | None | None | None | |||
| Bud | May 20 – May 26 | Category 3 hurricane | 115 (185) | 961 | Western Mexico | Minimal | None | |||
| Carlotta | June 14 – June 16 | Category 2 hurricane | 110 (175) | 973 | Southwestern Mexico | 12.4 | 7 | |||
| Daniel | July 4 – July 12 | Category 3 hurricane | 115 (185) | 961 | None | None | None | |||
| Emilia | July 7 – July 15 | Category 4 hurricane | 140 (220) | 945 | None | None | None | |||
| Fabio | July 12 – July 18 | Category 2 hurricane | 110 (175) | 966 | Baja California Peninsula, California, Western United States | None | None | |||
| Gilma | August 7 – August 11 | Category 1 hurricane | 80 (130) | 984 | None | None | None | |||
| Hector | August 11 – August 16 | Tropical storm | 50 (85) | 995 | Western Mexico, Baja California Peninsula | Minimal | None | |||
| Ileana | August 27 – September 2 | Category 1 hurricane | 85 (140) | 978 | None | None | None | |||
| John | September 2 – September 4 | Tropical storm | 45 (75) | 1000 | Baja California Peninsula | Minimal | None | |||
| Kristy | September 12 – September 17 | Tropical storm | 60 (95) | 998 | Baja California Peninsula | Minimal | None | |||
| Lane | September 15 – September 19 | Category 1 hurricane | 85 (130) | 985 | None | None | None | |||
| Miriam | September 22 – September 27 | Category 3 hurricane | 120 (195) | 959 | Baja California Peninsula, Texas | None | None | |||
| Norman | September 28 – September 29 | Tropical storm | 50 (85) | 997 | Western Mexico, Baja California Peninsula, Northwestern Mexico, Texas | Minimal | 1 | |||
| Olivia | October 6 – October 8 | Tropical storm | 60 (95) | 997 | None | None | None | |||
| Paul | October 13 – October 17 | Category 3 hurricane | 120 (195) | 959 | Baja California Peninsula, Northwestern Mexico | 15.5 | None | |||
| Rosa | October 30 – November 3 | Tropical storm | 50 (85) | 1001 | None | None | None | |||
| Season Aggregates | ||||||||||
| 17 cyclones | May 14 – November 3 | 140 (220) | 945 | 27.9 | 8 | |||||
See also
- List of Pacific hurricanes
- List of Pacific hurricane seasons
- 2012 Atlantic hurricane season
- 2012 Pacific typhoon season
- 2012 North Indian Ocean cyclone season
- South-West Indian Ocean cyclone seasons: 2011–12, 2012–13
- Australian region cyclone seasons: 2011–12, 2012–13
- South Pacific cyclone seasons: 2011–12, 2012–13
References
- ↑ "NOAA: 2012 Eastern Pacific Hurricane Season Outlook". Climate Prediction Center. May 24, 2012. Retrieved August 7, 2012.
- ↑ United States Department of Commerce; National Ocean Service. "Historical Hurricane Tracks". United States National Oceanic and Atmospheric Administration's National Weather Service. Retrieved 20 July 2012.
- ↑ Kelley, Johnny (July 4, 2012). "Eastern Pacific spews out fifth hurricane more than a month ahead of schedule". The Examiner. Retrieved 20 July 2012.
- ↑ Jack Beven (May 12, 2012). "Special Graphical Tropical Weather Outlook". National Hurricane Center. Retrieved July 18, 2012.
- ↑ Daniel Brown (May 13, 2012). "Special Graphical Tropical Weather Outlook". National Hurricane Center. Retrieved July 18, 2012.
- ↑ Todd Kimberlain (May 14, 2012). "Tropical Depression One-E Public Advisory Number 1". National Hurricane Center. Retrieved July 18, 2012.
- ↑ Richard Pasch (May 14, 2012). "Tropical Storm Aletta Public Advisory Number 3". National Hurricane Center. Retrieved July 18, 2012.
- ↑ Lixion Avila (May 17, 2012). "Tropical Depression Aletta Public Advisory Number 12". National Hurricane Center. Retrieved July 18, 2012.
- ↑ John Cangialosi (May 19, 2012). "Post-Tropical Cyclone Aletta Public Advisory Number 21". National Hurricane Center. Retrieved July 18, 2012.
- ↑ "NHC ATCF File on Aletta". National Hurricane Center. May 20, 2012. Retrieved August 7, 2012.
- ↑ Jack Beven (May 15, 2012). "Graphical Tropical Weather Outlook". National Hurricane Center. Retrieved August 11, 2012.
- ↑ Michael Brennan (May 20, 2012). "Tropical Depression Two-E Public Advisory Number 1". National Hurricane Center. Retrieved August 11, 2012.
- ↑ Daniel Brown (May 22, 2012). "Tropical Storm Bud Public Advisory Number 6". National Hurricane Center. Retrieved August 15, 2012.
- ↑ Robbie Berg (May 23, 2012). "Tropical Storm Bud Public Advisory Number 11". National Hurricane Center. Retrieved August 15, 2012.
- ↑ Robbie Berg; James Franklin (May 24, 2012). "Hurricane Bud Public Advisory Number 14". National Hurricane Center. Retrieved August 15, 2012.
- ↑ Daniel Brown (May 24, 2012). "Hurricane Bud Public Advisory Number 16". National Hurricane Center. Retrieved August 15, 2012.
- ↑ Stacy Stewart (May 25, 2012). "Hurricane Bud Public Advisory Number 16A". National Hurricane Center. Retrieved August 15, 2012.
- ↑ Stacy Stewart (May 24, 2012). "Hurricane Bud Public Advisory Number 17". National Hurricane Center. Retrieved August 11, 2012.
- ↑ Michael Brennan (May 25, 2012). "Hurricane Bud Public Advisory Number 18". National Hurricane Center. Retrieved August 11, 2012.
- ↑ Jack Beven (May 25, 2012). "Tropical Storm Bud Public Advisory Number 21". National Hurricane Center. Retrieved August 11, 2012.
- ↑ James Franklin (May 26, 2012). "Post-tropical Cyclone Bud Public Advisory Number 23". National Hurricane Center. Retrieved August 11, 2012.
- ↑ "Tropical Weather Outlook". National Hurricane Center. Archived from the original on June 13, 2012. Retrieved August 15, 2012.
- 1 2 Daniel Brown; Robbie Berg (June 13, 2012). "Tropical Depression Three-E Public Advisory Number 1". National Hurricane Center. Retrieved August 15, 2012.
- ↑ Stacy Stewart (June 14, 2012). "Tropical Storm Carlotta Public Advisory Number 2". National Hurricane Center. Retrieved August 15, 2012.
- ↑ Jack Beven (June 15, 2012). "Hurricane Carlotta Public Advisory Number 8". National Hurricane Center. Retrieved August 15, 2012.
- ↑ Lixion Avila (June 16, 2012). "Hurricane Carlotta Public Advisory Number 9". National Hurricane Center. Retrieved August 15, 2012.
- ↑ Lixion Avila (June 16, 2012). "Tropical Depression Carlotta Public Advisory Number 11". National Hurricane Center. Retrieved August 15, 2012.
- ↑ Robbie Berg (June 16, 2012). "Post-Tropical Cyclone Carlotta Discussion Number 13". National Hurricane Center. Retrieved August 15, 2012.
- ↑ Jack Beven (June 15, 2012). "Hurricane Carlotta Public Advisory Number 7". National Hurricane Center. Retrieved August 15, 2012.
- ↑ "Death toll rises to 3 from hurricane in Mexico". Fox News Latino. June 18, 2012. Retrieved August 15, 2012.
- ↑ "July 2012 Global Catastrophe Recap" (PDF). AON Benfield. August 2012. Retrieved September 13, 2012.
- ↑ "El estado de Oaxaca solicita 1,444 millones de pesos al FONDEN, para atender los daños en los 103 municipios declarados en Desastre por la ocurrencia del Huracán "Carlotta"". Government of Mexico (in Spanish). ReliefWeb. July 25, 2012. Retrieved September 13, 2012.
- ↑ "Tropical Cyclone Formation Alert". Joint Typhoon Warning Center. Archived from the original on July 3, 2012. Retrieved August 15, 2012.
- ↑ Jack Beven (July 4, 2012). "Tropical Depression Four-E Public Advisory Number 1". National Hurricane Center. Retrieved August 15, 2012.
- ↑ Michael Brennan (July 5, 2012). "Tropical Storm Daniel Public Advisory Number 6". National Hurricane Center. Retrieved August 15, 2012.
- ↑ Robbie Berg (July 7, 2012). "Hurricane Daniel Public Advisory Number 12". National Hurricane Center. Retrieved August 15, 2012.
- ↑ Robbie Berg (July 8, 2012). "Hurricane Daniel Public Advisory Number 16". National Hurricane Center. Retrieved August 15, 2012.
- ↑ John Cangialosi (July 8, 2012). "Hurricane Daniel Public Advisory Number 17". National Hurricane Center. Retrieved August 15, 2012.
- ↑ Richard Pasch (July 8, 2012). "Hurricane Daniel Public Advisory Number 18". National Hurricane Center. Retrieved August 15, 2012.
- ↑ Stacy Stewart (July 9, 2012). "Hurricane Daniel Public Advisory Number 21". National Hurricane Center. Retrieved August 15, 2012.
- ↑ Dave Roberts (July 9, 2012). "Tropical Storm Daniel Discussion Number 27". National Hurricane Center. Retrieved August 15, 2012.
- ↑ Tom Birchard (July 11, 2012). "Tropical Storm Daniel Discussion Number 30". Central Pacific Hurricane Center. Retrieved August 15, 2012.
- ↑ Bob Burke (July 11, 2012). "Tropical Depression Daniel Discussion Number 31". Central Pacific Hurricane Center. Retrieved August 15, 2012.
- ↑ Kevin Kodama (July 12, 2012). "Tropical Depression Daniel Discussion Number 32". Central Pacific Hurricane Center. Retrieved August 15, 2012.
- ↑ "Tropical Weather Outlook July 14, 2012, 00z". Central Pacific Hurricane Center. Archived from the original on July 14, 2012. Retrieved August 15, 2012.
- ↑ http://www.nhc.noaa.gov/data/tcr/EP042012_Daniel.pdf
- ↑ Eric Blake (July 7, 2012). "Tropical Depression Five-E Public Advisory Number 1". National Hurricane Center. Retrieved August 15, 2012.
- ↑ Lixion Avila (July 8, 2012). "Tropical Storm Emilia Public Advisory Number 2". National Hurricane Center. Retrieved August 15, 2012.
- ↑ Stacy Stewart (July 9, 2012). "Hurricane Emilia Public Advisory Number 7". National Hurricane Center. Retrieved August 15, 2012.
- ↑ John Cangialosi (July 10, 2012). "Hurricane Emilia Public Advisory Number 10". National Hurricane Center. Retrieved August 15, 2012.
- ↑ Stacy Stewart (July 10, 2012). "Hurricane Emilia Public Advisory Number 11". National Hurricane Center. Retrieved August 15, 2012.
- ↑ Lixion Avila (July 11, 2012). "Hurricane Emilia Public Advisory Number 17". National Hurricane Center. Retrieved August 15, 2012.
- ↑ Daniel Brown (July 13, 2012). "Hurricane Emilia Public Advisory Number 22". National Hurricane Center. Retrieved August 15, 2012.
- ↑ Eric Blake (July 13, 2012). "Tropical Storm Emilia Public Advisory Number 23". National Hurricane Center. Retrieved August 15, 2012.
- ↑ Michael Brennan (July 15, 2012). "Tropical Storm Emilia Public Advisory Number 30". National Hurricane Center. Retrieved August 15, 2012.
- ↑ John Cangialosi (July 15, 2012). "Tropical Storm Emilia Public Advisory Number 32". National Hurricane Center. Retrieved August 15, 2012.
- ↑ "Tropical Weather Outlook July 18, 2012, 12z". Central Pacific Hurricane Center. Archived from the original on July 18, 2012. Retrieved August 15, 2012.
- ↑ http://www.nhc.noaa.gov/data/tcr/EP052012_Emilia.pdf
- ↑ Stacy Stewart (July 12, 2012). "Tropical Depression Six-E Public Advisory Number 1". National Hurricane Center. Retrieved August 15, 2012.
- ↑ Robbie Berg (July 12, 2012). "Tropical Storm Fabio Public Advisory Number 2". National Hurricane Center. Retrieved August 15, 2012.
- ↑ Robbie Berg (July 13, 2012). "Hurricane Fabio Public Advisory Number 7". National Hurricane Center. Retrieved August 15, 2012.
- ↑ Dave Roberts (July 14, 2012). "Hurricane Fabio Public Advisory Number 8". National Hurricane Center. Retrieved August 15, 2012.
- 1 2 John L. Beven (December 18, 2012). "Tropical Cyclone Report: Hurricane Fabio" (PDF). National Hurricane Center. Retrieved January 7, 2013.
- ↑ John Cangialosi; Michael Brennan (July 15, 2012). "Hurricane Fabio Public Advisory Number 12". National Hurricane Center. Retrieved August 15, 2012.
- ↑ John Cangialosi (July 16, 2012). "Tropical Storm Fabio Public Advisory Number 20". National Hurricane Center. Retrieved August 15, 2012.
- ↑ John Cangialosi (July 18, 2012). "Tropical Depression Fabio Public Advisory Number 25". National Hurricane Center. Retrieved August 15, 2012.
- ↑ Robert J. Lopez (2012-07-18). "Hurricane Fabio remnants cause thunder across Southern California". Los Angeles Times. Retrieved 2012-07-30.
- ↑ Beven, Jack (August 5, 2012). "Graphical Tropical Weather Outlook". National Hurricane Center. Retrieved September 16, 2012.
- ↑ Todd Kimberlain; Stacy Stewart (August 6, 2012). "Graphical Tropical Weather Outlook". National Hurricane Center. Retrieved September 16, 2012.
- ↑ Berg, Robbie (August 7, 2012). "Tropical Depression Seven-E Public Advisory Number 1". National Hurricane Center. Retrieved September 16, 2012.
- ↑ Beven, Jack (August 7, 2012). "Tropical Storm Gilma Public Advisory Number 2". National Hurricane Center. Retrieved September 16, 2012.
- ↑ Roberts, Dave. "Hurricane Gilma Discussion Number 9". National Hurricane Center. Retrieved 29 September 2012.
- ↑ Cangialosi, John (August 8, 2012). "Hurricane Gilma Public Advisory Number 8". National Hurricane Center. Retrieved September 16, 2012.
- ↑ Berg, Robbie (August 9, 2012). "Tropical Storm Gilma Public Advisory Number 11". National Hurricane Center. Retrieved September 16, 2012.
- ↑ Avila, Lixion (August 11, 2012). "Post-Tropical Cyclone Gilma Public Advisory Number 19". National Hurricane Center. Retrieved September 16, 2012.
- ↑ http://www.nhc.noaa.gov/data/tcr/EP072012_Gilma.pdf
- ↑ Lixion Avila (August 11, 2012). "Tropical Depression Eight-E Public Advisory Number 1". National Hurricane Center. Retrieved August 11, 2012.
- ↑ Eric Blake (August 12, 2012). "Tropical Storm Hector Public Advisory Number 3". National Hurricane Center. Retrieved August 15, 2012.
- ↑ "Tropical Depression Hector Public Advisory Number 18". National Hurricane Center. August 15, 2012. Retrieved September 16, 2012.
- ↑ "Post-Tropical Cyclone Hector Public Advisory Number 24". National Hurricane Center. August 17, 2012. Retrieved September 16, 2012.
- ↑ http://www.nhc.noaa.gov/data/tcr/EP082012_Hector.pdf
- ↑ http://www.eluniversal.com.mx/notas/864733.html
- ↑ http://www.eluniversal.com.mx/notas/864785.html
- ↑ http://fotos.eluniversal.com.mx/coleccion/muestra_fotogaleria.html?idgal=13539
- ↑ "Graphical Tropical Weather Outlook". National Hurricane Center. August 24, 2012. Retrieved September 16, 2012.
- ↑ "Tropical Depression Nine-E Public Advisory Number 1". National Hurricane Center. August 27, 2012. Retrieved September 16, 2012.
- ↑ "Tropical Storm Ileana Public Advisory Number 2". National Hurricane Center. August 27, 2012. Retrieved September 16, 2012.
- ↑ "Hurricane Ileana Public Advisory Number 10". National Hurricane Center. August 29, 2012. Retrieved September 16, 2012.
- ↑ "Tropical Storm Ileana Public Advisory Number 17". National Hurricane Center. August 31, 2012. Retrieved September 16, 2012.
- ↑ "Post-Tropical Cyclone Ilene Public Advisory Number 24". National Hurricane Center. September 2, 2012. Retrieved September 16, 2012.
- ↑ http://www.nhc.noaa.gov/data/tcr/EP092012_Ileana.pdf
- ↑ Todd Kimberlain (August 29, 2012). "Graphical Tropical Weather Outlook". National Hurricane Center. Retrieved September 16, 2012.
- ↑ John Cangialosi (September 2, 2012). "Tropical Depression Ten-E Public Advisory Number 1". National Hurricane Center. Retrieved September 16, 2012.
- ↑ Stacy Stewart (September 3, 2012). "Tropical Storm John Discussion Number 3". National Hurricane Center. Retrieved September 16, 2012.
- ↑ Daniel Brown (September 3, 2012). "Tropical Storm John Discussion Number 5". National Hurricane Center. Retrieved September 16, 2012.
- ↑ "Tropical Depression John Public Advisory Number 6". National Hurricane Center. September 3, 2012. Retrieved September 16, 2012.
- ↑ Daniel Brown (September 4, 2012). "Post-Tropical Cyclone John Discussion Number 9". National Hurricane Center. Retrieved September 16, 2012.
- ↑ http://www.nhc.noaa.gov/data/tcr/EP102012_John.pdf
- ↑ http://www.eluniversal.com.mx/notas/868052.html
- ↑ Todd Kimberlain (September 9, 2012). "Graphical Tropical Weather Outlook". National Hurricane Center. Retrieved September 16, 2012.
- ↑ Lixion Avila (September 12, 2012). "Tropical Depression Eleven-E Public Advisory Number 1". National Hurricane Center. Retrieved September 16, 2012.
- ↑ Eric Blake (September 15, 2012). "Tropical Storm Kristy Discussion Number 15". National Hurricane Center. Retrieved September 16, 2012.
- ↑ http://www.wrh.noaa.gov/lox/
- ↑ http://www.eluniversal.com.mx/notas/870140.html
- ↑ http://www.nhc.noaa.gov/data/tcr/EP112012_Kristy.pdf
- ↑ Lixion Avila (September 13, 2012). "Graphical Tropical Weather Outlook". National Hurricane Center. Retrieved September 16, 2012.
- ↑ Eric Blake (September 14, 2012). "Graphical Tropical Weather Outlook". National Hurricane Center. Retrieved September 16, 2012.
- ↑ Lixion Avila (September 15, 2012). "Tropical Depression Twelve-E Public Advisory Number 1". National Hurricane Center. Retrieved September 16, 2012.
- ↑ Lixion Avila (September 15, 2012). "Tropical Storm Lane Public Advisory Number 1". National Hurricane Center. Retrieved September 16, 2012.
- ↑ Hurricane Lane – Advisory Number 8 – National Hurricane Center. Retrieved September 18, 2012.
- ↑ Hurricane Lane – Advisory Number 13 – National Hurricane Center. Retrieved September 18, 2012.
- ↑ http://www.nhc.noaa.gov/data/tcr/EP122012_Lane.pdf
- ↑ Cangialosi, John. "Tropical Depression Thirteen-E Discussion Number 1". National Hurricane Center. Retrieved 21 October 2012.
- ↑ Brennan, Michael. "Tropical Storm Miriam Discussion Number 3". National Hurricane Center. Retrieved 21 October 2012.
- ↑ Stewart, Stacy. "Tropical Storm Miriam Discussion Number 6". National Hurricane Center. Retrieved 29 September 2012.
- ↑ Kimberlain, Todd. "Tropical Storm Miriam Discussion Number 8". National Hurricane Center. Retrieved 29 September 2012.
- ↑ Cangialosi, John. "Hurricane Miriam Discussion Number 9". National Hurricane Center. Retrieved 29 September 2012.
- ↑ Stewart, Stacy. "Hurricane Miriam Discussion Number 10". National Hurricane Center. Retrieved 29 September 2012.
- ↑ Kimberlain, Todd. "Hurricane Miriam Discussion Number 11". National Hurricane Center. Retrieved 29 September 2012.
- ↑ Cangialosi, John. "Hurricane Miriam Discussion Number 13". National Hurricane Center. Retrieved 29 September 2012.
- ↑ Blake, Eric. "Tropical Storm Miriam Discussion Number 18". National Hurricane Center. Retrieved 29 September 2012.
- ↑ Roberts, Dave. "Tropical Depression Miriam Discussion Number 24". National Hurricane Center. Retrieved 29 September 2012.
- ↑ Berg, Robbie. "Post-Tropical Cyclone Miriam Discussion Number 25". National Hurricane Center. Retrieved 29 September 2012.
- ↑ http://www.nhc.noaa.gov/archive/gtwo/epac/201209272033/index.php?basin=epac¤t_issuance=201209272033
- ↑ John Sullivan. "Microsoft Word - EP132012_Miriam.docx" (PDF). Archived (PDF) from the original on 2013-07-15. Retrieved 2013-07-10.
- ↑ Brown, Dan (September 25, 2012). "Graphical Tropical Weather Outlook". National Hurricane Center. Retrieved 21 October 2012.
- ↑ Beven, Jack (September 26, 2012). "Graphical Tropical Weather Outlook". National Hurricane Center. Retrieved 21 October 2012.
- ↑ Michael Brennan; Dave Roberts (September 28, 2012). "Tropical Storm Norman Public Advisory Number 1". National Hurricane Center. Retrieved September 28, 2012.
- ↑ Berg, Robbie; Lixion Avila. "Tropical Depression Norman Discussion Number 3". National Hurricane Center. Retrieved 29 September 2012.
- ↑ Blake, Eric. "Tropical Depression Norman Discussion Number 4". National Hurricane Center. Retrieved 29 September 2012.
- ↑ Cangialosi, John. "Tropical Depression Norman Discussion Number 5". National Hurricane Center. Retrieved 29 September 2012.
- ↑ Cangialosi, John. "Post-Tropical Cyclone Norman Discussion Number 6". National Hurricane Center. Retrieved 29 September 2012.
- ↑ http://www.nhc.noaa.gov/archive/gtwo/epac/201209300600/index.php?basin=epac¤t_issuance=201209300600
- ↑ http://www.nhc.noaa.gov/data/tcr/EP142012_Norman.pdf
- 1 2 Avila, Lixion. "Tropical Depression Fifteen-E Discussion Number 1". National Hurricane Center. Retrieved 9 October 2012.
- 1 2 Cangialosi, John. "Tropical Storm Olivia Discussion Number 2". National Hurricane Center. Retrieved 9 October 2012.
- ↑ Berg, Robbie. "Tropical Storm Olivia Discussion Number 4". National Hurricane Center. Retrieved 9 October 2012.
- 1 2 Cangialosi, John. "Tropical Storm Olivia Discussion Number 5". National Hurricane Center. Retrieved 9 October 2012.
- 1 2 Cangialosi, John. "Tropical Storm Olivia Discussion Number 10". National Hurricane Center. Retrieved 9 October 2012.
- ↑ Kimberlain, Todd. "Tropical Depression Olivia Discussion Number 11". National Hurricane Center. Retrieved 9 October 2012.
- 1 2 Berg, Robbie. "Post-Tropical Cyclone Olivia Discussion Number 12". National Hurricane Center. Retrieved 9 October 2012.
- ↑ http://www.nhc.noaa.gov/text/refresh/MIATWDEP+shtml/
- ↑ http://www.nhc.noaa.gov/data/tcr/EP152012_Olivia.pdf
- ↑ Michael Brennan (October 10, 2012). Tropical Weather Outlook (TXT) (Report). National Hurricane Center. Retrieved October 15, 2012.
- ↑ Todd Kimberlain (October 12, 2012). Tropical Weather Outlook (TXT) (Report). National Hurricane Center. Retrieved October 15, 2012.
- ↑ John Cangialosi (October 13, 2012). Tropical Weather Outlook (TXT) (Report). National Hurricane Center. Retrieved October 15, 2012.
- ↑ John Cangialosi (October 13, 2012). Tropical Storm Paul Discussion Number 1 (Report). National Hurricane Center. Retrieved October 15, 2012.
- ↑ Chris Landsea; Matt Sardi (October 14, 2012). Tropical Storm Paul Discussion Number 2 (Report). National Hurricane Center. Retrieved October 15, 2012.
- ↑ John Cangialosi (October 14, 2012). Tropical Storm Paul Discussion Number 4 (Report). National Hurricane Center. Retrieved October 15, 2012.
- ↑ Robbie Berg (October 15, 2012). Tropical Storm Paul Discussion Number 6 (Report). National Hurricane Center. Retrieved October 15, 2012.
- ↑ John Cangialosi; Stacy Stewart (October 15, 2012). Hurricane Paul Discussion Number 7 (Report). National Hurricane Center. Retrieved October 15, 2012.
- ↑ Todd Kimberlain; Daniel Brown (October 15, 2012). Hurricane Paul Discussion Number 8 (Report). National Hurricane Center. Retrieved October 15, 2012.
- ↑ Todd Kimberlain (October 15, 2012). Hurricane Paul Discussion Number 9 (Report). National Hurricane Center. Retrieved October 15, 2012.
- ↑ Robbie Berg; Richard Pasch (October 16, 2012). Hurricane Paul Discussion Number 10 (Report). National Hurricane Center. Retrieved October 15, 2012.
- ↑ Jack Beven (October 17, 2012). Hurricane Paul Discussion Number 17 (Report). National Hurricane Center. Retrieved October 18, 2012.
- ↑ Jack Beven (October 17, 2012). Hurricane Paul Discussion Number 18 (Report). National Hurricane Center. Retrieved October 18, 2012.
- ↑ http://www.nhc.noaa.gov/data/tcr/EP162012_Paul.pdf
- ↑ Haydee Ramirez (October 2012). "Paul damage report" (in Spanish). Terra Mexico. Retrieved October 21, 2012.
- ↑ Berg, Robbie (October 30, 2012). Tropical Depression Seventeen-E Special Discussion Number 1 (Report). National Hurricane Center. Retrieved November 4, 2012.
- ↑ Blake, Eric (October 30, 2012). Tropical Storm Rosa Discussion Number 2 (Report). National Hurricane Center. Retrieved November 4, 2012.
- ↑ Berg, Robbie (November 1, 2012). Tropical Storm Rosa Discussion Number 9 (Report). National Hurricane Center. Retrieved November 4, 2012.
- ↑ Berg, Robbie (November 2, 2012). Tropical Storm Rosa Discussion Number 13 (Report). National Hurricane Center. Retrieved November 4, 2012.
- ↑ Brown, Daniel (November 4, 2012). Post-Tropical Cyclone Rosa Discussion Number 23 (Report). National Hurricane Center. Retrieved November 5, 2012.
- ↑ http://www.nhc.noaa.gov/data/tcr/EP172012_Rosa.pdf
- ↑ The totals represent the sum of the squares for every tropical storm's intensity of over 33 knots (38 mph, 61 km/h), divided by 10,000. Calculations are provided at Talk:2012 Pacific hurricane season/ACE calcs.
External links
| Wikimedia Commons has media related to 2012 Pacific hurricane season. |
- National Hurricane Center Website
- National Hurricane Center's Eastern Pacific Tropical Weather Outlook
Tropical cyclones of the 2012 Pacific hurricane season | ||
|---|---|---|
| ||
| ||