A-weighting
.svg.png)

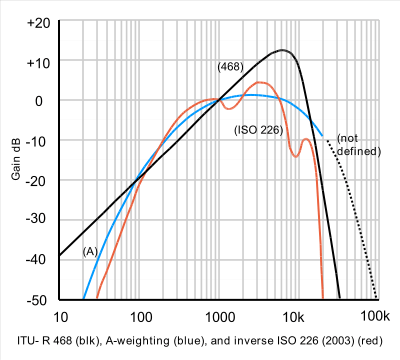
A-weighting is the most commonly used of a family of curves defined in the International standard IEC 61672:2003 and various national standards relating to the measurement of sound pressure level. A-weighting is applied to instrument-measured sound levels in an effort to account for the relative loudness perceived by the human ear, as the ear is less sensitive to low audio frequencies. It is employed by arithmetically adding a table of values, listed by octave or third-octave bands, to the measured sound pressure levels in dB. The resulting octave band measurements are usually added (logarithmic method) to provide a single A-weighted value describing the sound; the units are written as dB(A). Other weighting sets of values - B, C, D and now Z - are discussed below.
The curves were originally defined for use at different average sound levels, but A-weighting, though originally intended only for the measurement of low-level sounds (around 40 phon), is now commonly used for the measurement of environmental noise and industrial noise, as well as when assessing potential hearing damage and other noise health effects at all sound levels; indeed, the use of A-frequency-weighting is now mandated for all these measurements, although it is badly suited for these purposes, being only applicable to low levels so that it tends to devalue the effects of low frequency noise in particular.[1] It is also used when measuring low-level noise in audio equipment, especially in the United States. In Britain, Europe and many other parts of the world, broadcasters and audio engineers more often use the ITU-R 468 noise weighting, which was developed in the 1960s based on research by the BBC and other organizations. This research showed that our ears respond differently to random noise, and the equal-loudness curves on which the A, B and C weightings were based are really only valid for pure single tones.
History of A-weighting
A-weighting began with work by Fletcher and Munson which resulted in their publication, in 1933, of a set of equal-loudness contours. Three years later these curves were used in the first American standard for sound level meters.[1] This ANSI standard, later revised as ANSI S1.4-1981, incorporated B-weighting as well as the A-weighting curve, recognising the unsuitability of the latter for anything other than low-level measurements. But B-weighting has since fallen into disuse. Later work, first by Zwicker and then by Schomer, attempted to overcome the difficulty posed by different levels, and work by the BBC resulted in the CCIR-468 weighting, currently maintained as ITU-R 468 noise weighting, which gives more representative readings on noise as opposed to pure tones.
Deficiencies of A-weighting
A-weighting is only really valid for relatively quiet sounds and for pure tones as it is based on the 40-phon Fletcher–Munson curves which represented an early determination of the equal-loudness contour for human hearing.
Because of perceived discrepancies between early and more recent determinations, the International Organization for Standardization (ISO) recently revised its standard curves as defined in ISO 226, in response to the recommendations of a study coordinated by the Research Institute of Electrical Communication, Tohoku University, Japan. The study produced new curves by combining the results of several studies, by researchers in Japan, Germany, Denmark, UK, and USA. (Japan was the greatest contributor with about 40% of the data.) This has resulted in the recent acceptance of a new set of curves standardized as ISO 226:2003. The report comments on the surprisingly large differences, and the fact that the original Fletcher–Munson contours are in better agreement with recent results than the Robinson-Dadson, which appear to differ by as much as 10–15 dB especially in the low-frequency region, for reasons that are not explained. Fortuitously, the 40-phon Fletcher–Munson curve is particularly close to the modern ISO 226:2003 standard.[2]
Nevertheless, it will be noted that A-weighting would be a better match to the loudness curve if it fell much more steeply above 10 kHz, and it is likely that this compromise came about because steep filters were difficult to construct in the early days of electronics. Nowadays, no such limitation need exist, as demonstrated by the ITU-R 468 curve. If A-weighting is used without further band-limiting it is possible to obtain different readings on different instruments when ultrasonic, or near ultrasonic noise is present. Accurate measurements therefore require a 20 kHz low-pass filter to be combined with the A-weighting curve in modern instruments. This is defined in IEC 61012 as AU weighting and while very desirable, is rarely fitted to commercial sound level meters.
B-, C-, D- and Z-weightings
A-frequency-weighting is mandated by the international standard IEC 61672 to be fitted to all sound level meters. The old B- and D-frequency-weightings have fallen into disuse, but many sound level meters provide for C frequency-weighting and its fitting is mandated — at least for testing purposes — to precision (Class one) sound level meters. D-frequency-weighting was specifically designed for use when measuring high level aircraft noise in accordance with the IEC 537 measurement standard. The large peak in the D-weighting curve is not a feature of the equal-loudness contours, but reflects the fact that humans hear random noise differently from pure tones, an effect that is particularly pronounced around 6 kHz. This is because individual neurons from different regions of the cochlea in the inner ear respond to narrow bands of frequencies, but the higher frequency neurons integrate a wider band and hence signal a louder sound when presented with noise containing many frequencies than for a single pure tone of the same pressure level. Following changes to the ISO standard, D-frequency-weighting should now only be used for non-bypass engines and as these are not fitted to commercial aircraft — but only to military ones — A-frequency-weighting is now mandated for light civilian aircraft measurements, while a more accurate loudness-corrected weighting EPNdB is required for certification of large transport aircraft[3]
Z- or ZERO frequency-weighting was introduced in the International Standard IEC 61672 in 2003 and was intended to replace the "Flat" or "Linear" frequency weighting often fitted by manufacturers. This change was needed as each sound level meter manufacturer could choose their own low and high frequency cut-offs (–3 dB) points, resulting in different readings, especially when peak sound level was being measured. As well, the C-frequency-weighting, with –3 dB points at 31.5 Hz and 8 kHz did not have a sufficient bandpass to allow the sensibly correct measurement of true peak noise (Lpk)
B- and D-frequency-weightings are no longer described in the body of the standard IEC 61672 : 2003, but their frequency responses can be found in the older IEC 60651, although that has been formally withdrawn by the International Electro-technical Commission in favour of IEC 61672 : 2003. The frequency weighting tolerances in IEC 61672 have been tightened over those in the earlier standards IEC 179 and IEC 60651 and thus instruments complying with the earlier specifications should no longer be used for legally required measurements.
Environmental and other noise measurements

A-weighted decibels are abbreviated dB(A) or dBA. When acoustic (calibrated microphone) measurements are being referred to, then the units used will be dB SPL referenced to 20 micropascals = 0 dB SPL. dBrn adjusted is a synonym for dBA.
The A-weighting curve has been widely adopted for environmental noise measurement, and is standard in many sound level meters. The A-weighting system is used in any measurement of environmental noise (examples of which include roadway noise, rail noise, aircraft noise). A-weighting is also in common use for assessing potential hearing damage caused by loud noise.
A-weighted SPL measurements of noise level are increasingly found on sales literature for domestic appliances such as refrigerators, freezers and computer fans. In Europe, the A-weighted noise level is used for instance for normalizing the noise of tires on cars.
The A-weighting is also used for noise dose measurements at work. A noise level of more than 85 dB(A) each day increases the risk factor for hearing damage.
Noise exposure for visitors of venues with loud music is usually also expressed in dB(A), although the presence of high levels of low frequency noise does not justify this.
Audio reproduction and broadcasting equipment
Although the A-weighting curve, in widespread use for noise measurement, is said to have been based on the 40-phon Fletcher-Munson curve, research in the 1960s demonstrated that determinations of equal-loudness made using pure tones are not directly relevant to our perception of noise.[4] This is because the cochlea in our inner ear analyses sounds in terms of spectral content, each 'hair-cell' responding to a narrow band of frequencies known as a critical band. The high-frequency bands are wider in absolute terms than the low frequency bands, and therefore 'collect' proportionately more power from a noise source. However, when more than one critical band is stimulated, the outputs of the various bands are summed by the brain to produce an impression of loudness. For these reasons equal-loudness curves derived using noise bands show an upwards tilt above 1 kHz and a downward tilt below 1 kHz when compared to the curves derived using pure tones.
This enhanced sensitivity to noise in the region of 6 kHz became particularly apparent in the late 1960s with the introduction of compact cassette recorders and Dolby-B noise reduction. A-weighted noise measurements were found to give misleading results because they did not give sufficient prominence to the 6 kHz region where the noise reduction was having greatest effect, and did not sufficiently attenuate noise around 10 kHz and above (a particular example is with the 19 kHz pilot tone on FM radio systems which, though usually inaudible is not sufficiently attenuated by A-weighting, so that sometimes one piece of equipment would even measure worse than another and yet sound better, because of differing spectral content.
ITU-R 468 noise weighting was therefore developed to more accurately reflect the subjective loudness of all types of noise, as opposed to tones. This curve, which came out of work done by the BBC Research Department, and was standardised by the CCIR and later adopted by many other standards bodies (IEC, BSI) and, as of 2006, is maintained by the ITU. It became widely used in Europe, especially in broadcasting, and was adopted by Dolby Laboratories who realised its superior validity for their purposes when measuring noise on film soundtracks and compact cassette systems. Its advantages over A-weighting is less understood in the US, where the use of A-weighting still predominates. It is universally used by broadcasters in Britain, Europe, and former countries of the British Empire such as Australia and South Africa.
Function realisation of some common weightings
Although they are defined in the standards by tables with tolerance limits (to allow a variety of implementations) the weightings can be described in terms of a weighting function that acts on the amplitude spectrum (not the intensity spectrum), or an offset that must be added to the unweighted sound level in dB units. Appropriate weighting functions are:[5]


A


B


C


The offsets (approximately 2.0, 0.17 and 0.06 for A, B and C, respectively) ensure the normalisation to 0 dB at 1000 Hz. Precisely, the respective offset values are , , and .


D


where

Transfer function equivalent
The gain curves can be realised[7] by the following s-domain transfer functions. They are not defined in this way though, being defined by tables of values with tolerances in the standards documents, thus allowing different realisations:
A

kA ≈ 7.39705×10⁹
B

kB ≈ 5.99185×10⁹
C

kC ≈ 5.91797×10⁹
D

kD ≈ 91104.32
The k values are constants which are used to normalize the function to a gain of 1 (0 dB). The values listed above normalize the functions to 0 dB at 1 kHz, as they are typically used. (This normalization is shown in the image.)
See also
- Noise
- Signal noise
- Psophometric weighting
- Audio quality measurement
- Noise pollution
- Noise regulation
- Headroom
- Rumble measurement
- Weighting filter
- Weighting curve
- Luminosity function, the light equivalent
References
- 1 2 Richard L. St. Pierre, Jr. and Daniel J. Maguire (July 2004), The Impact of A-weighting Sound Pressure Level Measurements during the Evaluation of Noise Exposure (PDF), retrieved 2011-09-13
- ↑ Precise and Full-range Determination of Two-dimensional Equal Loudness Contours (PDF), archived from the original (PDF) on 2007-09-27
- ↑ http://www.icao.int/Meetings/EnvironmentalWorkshops/Documents/NoiseCertificationWorkshop-2004/BIP_2_2_jb.pdf
- ↑ "Researches in loudness measurement". doi:10.1109/TAU.1966.1161864.
- ↑ "Frequency weighting equations". Cross Spectrum. 2004. Archived from the original on 2011-03-30.
- ↑ RONALD M. AARTS (March 1992). "A Comparison of Some Loudness Measures for Loudspeaker Listening Tests" (PDF). Audio Engineering Society. Retrieved 2013-02-28.
- ↑ Noise Measurement Briefing, Product Technology Partners Ltd., archived from the original on 2008-06-30
- Audio Engineer's Reference Book, 2nd Ed 1999, edited Michael Talbot Smith, Focal Press
- An Introduction to the Psychology of Hearing 5th ed, Brian C.J.Moore, Elsevier Press
External links
- Noise Measurement Briefing. Archived from the original on 2013-02-25.
- A-weighting filter circuit for audio measurements
- Weighting Filter Set Circuit diagrams
- Rane pro audio reference definition of "weighting filters"
- Frequency Weighting Equations
- A-weighting in detail
- A-Weighting Equation and online calculation
- Researches in loudness measurement by CBS using noise bands, 1966 IEEE Article
- Evaluation of Loudness-level weightings and LLSEL JASA
- Comparison of some loudness measures for loudspeaker listening tests (Aarts, JAES, 1992) PDF containing algorithm for ABCD filters