California's 31st congressional district
| California's 31st congressional district | ||
|---|---|---|
.tif.png) | ||
| Current Representative | Pete Aguilar (D–Redlands) | |
| Ethnicity | 29.7% White, 11.0% Black, 7.2% Asian, 49.4% Hispanic, 2.7[1]% other | |
| Cook PVI | D+5 | |
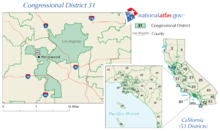
California's 31st congressional district is a congressional district in San Bernardino County, in the U.S. state of California. The district is located in the Inland Empire region, including the city of San Bernardino and portions of Rancho Cucamonga. The district is currently represented by Democrat Pete Aguilar, who won in 2014 with 51.4% of the vote.
Formerly, from 2003 to 2013, the district was located in Los Angeles County. It was the only congressional district entirely based within the City of Los Angeles, and included Hollywood and some predominantly Hispanic/Latino sections of central and northeast Los Angeles.
Recent election results from statewide races
| Year | Office | Results |
|---|---|---|
| 1992 | U.S. President | Clinton 51.7 - 32.3% |
| U.S. Senator | Boxer 48.9 - 41.1% | |
| U.S. Senator | Feinstein 57.7 - 33.7% | |
| 1994 | Governor | [Data unknown/missing. You can help!] |
| U.S. Senator | [Data unknown/missing. You can help!] | |
| 1996 | U.S. President | [Data unknown/missing. You can help!] |
| 1998 | Governor | [Data unknown/missing. You can help!] |
| U.S. Senator | [Data unknown/missing. You can help!] | |
| 2000 | U.S. President[2] | Gore 69.3 - 27.4% |
| U.S. Senator[3] | Feinstein 70.4 - 22.3% | |
| 2002 | Governor[4] | Davis 68.6 - 19.5% |
| 2003 | Gubernatorial recall[5][6] | No 67.6 - 32.4% |
| Bustamante 58.5 - 26.5% | ||
| 2004 | U.S. President[7] | Kerry 76.9 - 21.6% |
| U.S. Senator[8] | Boxer 80.1 - 14.6% | |
| 2006 | Governor[9] | Angelides 66.8 - 26.8% |
| U.S. Senator[10] | Feinstein 79.1 - 14.0% | |
| 2008 | U.S. President[11] | Obama 79.9 - 17.8% |
| 2010 | Governor[12] | Brown 77.9 - 16.6% |
| U.S. Senator[13] | Boxer 78.1 - 16.2% |
List of representatives
| Representative | Party | Dates | Notes | Counties |
|---|---|---|---|---|
| District created | January 3, 1963 | |||
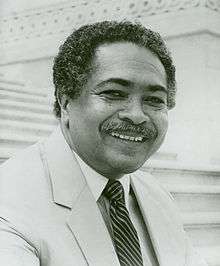
 Charles H. Wilson Charles H. Wilson |
Democratic | January 3, 1963 – January 3, 1981 | Lost re-nomination | Los Angeles |
 Mervyn M. Dymally Mervyn M. Dymally |
Democratic | January 3, 1981 – January 3, 1983 | ||
| January 3, 1983 – January 3, 1993 | Retired | Los Angeles (Carson, Compton) | ||
 Matthew G. Martinez Matthew G. Martinez |
Democratic | January 3, 1993 – July 27, 2000 | Redistricted from the 30th district | Los Angeles (Baldwin Park, East L.A.) |
| Republican | July 27, 2000 – January 3, 2001 | Switched to Republican Party after losing re-nomination | ||
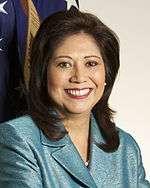 Hilda Solis Hilda Solis |
Democratic | January 3, 2001 – January 3, 2003 | Redistricted to the 32nd district | |
 Xavier Becerra Xavier Becerra |
Democratic | January 3, 2003 – January 3, 2013 | Redistricted from the 30th district Redistricted to the 34th district |
Los Angeles (Hollywood, Northeast L.A.) |
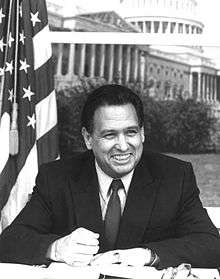
 Gary Miller Gary Miller |
Republican | January 3, 2013 – January 3, 2015 | Redistricted from the 42nd district | Inland Empire including San Bernardino and Rancho Cucamonga |
 Pete Aguilar Pete Aguilar |
Democratic | January 3, 2015 – Present | ||
Election results
|
1962 • 1964 • 1966 • 1968 • 1970 • 1972 • 1974 • 1976 • 1978 • 1980 • 1982 • 1984 • 1986 • 1988 • 1990 • 1992 • 1994 • 1996 • 1998 • 2000 • 2002 • 2004 • 2006 • 2008 • 2010 • 2012 • 2014 |
1962
| Party | Candidate | Votes | % | ||
|---|---|---|---|---|---|
| Democratic | Charles H. Wilson (incumbent) | 76,631 | 52.2 | ||
| Republican | Gordon Hahn | 70,154 | 47.8 | ||
| Total votes | 146,785 | 100.0 | |||
| Voter turnout | % | ||||
| Democratic win (new seat) | |||||
1964
| Party | Candidate | Votes | % | |
|---|---|---|---|---|
| Democratic | Charles H. Wilson (incumbent) | 114,246 | 64 | |
| Republican | Norman G. Shanahan | 64,256 | 36 | |
| Total votes | 178,502 | 100.0 | ||
| Voter turnout | % | |||
| Democratic hold | ||||
1966
| Party | Candidate | Votes | % | |
|---|---|---|---|---|
| Democratic | Charles H. Wilson (incumbent) | 92,875 | 63.4 | |
| Republican | Norman G. Shanahan | 53,708 | 36.6 | |
| Total votes | 146,583 | 100.0 | ||
| Voter turnout | % | |||
| Democratic hold | ||||
1968
| Party | Candidate | Votes | % | |
|---|---|---|---|---|
| Democratic | Charles H. Wilson (incumbent) | 94,387 | 58.9 | |
| Republican | James R. Dunn | 62,711 | 39.1 | |
| American Independent | Stanley L. Schulte | 3,134 | 2.0 | |
| Total votes | 160,232 | 100.0 | ||
| Voter turnout | % | |||
| Democratic hold | ||||
1970
| Party | Candidate | Votes | % | |
|---|---|---|---|---|
| Democratic | Charles H. Wilson (incumbent) | 102,071 | 73.2 | |
| Republican | Fred L. Casmir | 37,416 | 26.8 | |
| Total votes | 139,487 | 100.0 | ||
| Voter turnout | % | |||
| Democratic hold | ||||
1972
| Party | Candidate | Votes | % | |
|---|---|---|---|---|
| Democratic | Charles H. Wilson (incumbent) | 85,954 | 52.3 | |
| Republican | Ben Valentine | 69,876 | 42.5 | |
| Peace and Freedom | Roberta Lynn Wood | 8,582 | 5.2 | |
| Total votes | 164,412 | 100.0 | ||
| Voter turnout | % | |||
| Democratic hold | ||||
1974
| Party | Candidate | Votes | % | |
|---|---|---|---|---|
| Democratic | Charles H. Wilson (incumbent) | 60,560 | 70.4 | |
| Republican | Norman A. Hodges | 23,039 | 26.8 | |
| Peace and Freedom | William C. Taylor | 2,349 | 2.7 | |
| Total votes | 85,948 | 100.0 | ||
| Voter turnout | % | |||
| Democratic hold | ||||
1976
| Party | Candidate | Votes | % | |
|---|---|---|---|---|
| Democratic | Charles H. Wilson (incumbent) | 83,155 | 100.0 | |
| Voter turnout | % | |||
| Democratic hold | ||||
1978
| Party | Candidate | Votes | % | |
|---|---|---|---|---|
| Democratic | Charles H. Wilson (incumbent) | 55,667 | 67.8 | |
| Republican | Don Grimshaw | 26,490 | 32.2 | |
| Total votes | 82,157 | 100.0 | ||
| Voter turnout | % | |||
| Democratic hold | ||||
1980
| Party | Candidate | Votes | % | |
|---|---|---|---|---|
| Democratic | Mervyn M. Dymally | 69,146 | 64.4 | |
| Republican | Don Grimshaw | 38,203 | 35.6 | |
| Total votes | 107,349 | 100.0 | ||
| Voter turnout | % | |||
| Democratic hold | ||||
1982
| Party | Candidate | Votes | % | |
|---|---|---|---|---|
| Democratic | Mervyn M. Dymally (inc.) | 86,718 | 72.4 | |
| Republican | Henry C. Minturn | 33,043 | 27.6 | |
| Total votes | 119,761 | 100.0 | ||
| Voter turnout | % | |||
| Democratic hold | ||||
1986
| Party | Candidate | Votes | % | |
|---|---|---|---|---|
| Democratic | Mervyn M. Dymally (inc.) | 77,126 | 70.3 | |
| Republican | Jack McMurray | 30,322 | 27.6 | |
| Peace and Freedom | B. Kwaku Duren | 2,333 | 2.1 | |
| Total votes | 109,781 | 100.0 | ||
| Voter turnout | % | |||
| Democratic hold | ||||
1988
| Party | Candidate | Votes | % | |
|---|---|---|---|---|
| Democratic | Mervyn M. Dymally (inc.) | 100,919 | 71.6 | |
| Republican | Arnold C. May | 36,017 | 25.5 | |
| Peace and Freedom | B. Kwaku Duren | 4,091 | 2.9 | |
| Total votes | 151,027 | 100.0 | ||
| Voter turnout | % | |||
| Democratic hold | ||||
1990
| Party | Candidate | Votes | % | |
|---|---|---|---|---|
| Democratic | Mervyn M. Dymally (inc.) | 56,394 | 67.1 | |
| Republican | Eunice N. Sato | 27,593 | 32.9 | |
| Total votes | 83,987 | 100.0 | ||
| Voter turnout | % | |||
| Democratic hold | ||||
1992
| Party | Candidate | Votes | % | |
|---|---|---|---|---|
| Democratic | Matthew G. Martinez (inc.) | 68,324 | 62.6 | |
| Republican | Reuben D. Franco | 40,873 | 37.4 | |
| Total votes | 109,197 | 100.0 | ||
| Voter turnout | % | |||
| Democratic hold | ||||
1994
| Party | Candidate | Votes | % | |
|---|---|---|---|---|
| Democratic | Matthew G. Martinez (inc.) | 50,541 | 59.14 | |
| Republican | John V. Flores | 34,926 | 40.86 | |
| Total votes | 85,467 | 100.0 | ||
| Voter turnout | % | |||
| Democratic hold | ||||
1996
| Party | Candidate | Votes | % | |
|---|---|---|---|---|
| Democratic | Matthew G. Martinez (inc.) | 69,285 | 67.5 | |
| Republican | John Flores | 28,705 | 28.0 | |
| Libertarian | Michael Everling | 4,700 | 4.5 | |
| Total votes | 102,690 | 100.0 | ||
| Voter turnout | % | |||
| Democratic hold | ||||
1998
| Party | Candidate | Votes | % | |
|---|---|---|---|---|
| Democratic | Matthew G. Martinez (inc.) | 61,173 | 70.02 | |
| Republican | Frank C. Moreno | 19,786 | 22.65 | |
| Green | Krista Lieberg-Wong | 4,377 | 5.01 | |
| Libertarian | Michael B. Everling | 1,121 | 1.28 | |
| Natural Law | Gary Hearne | 903 | 1.03 | |
| Total votes | 87,360 | 100.0 | ||
| Voter turnout | % | |||
| Democratic hold | ||||
2000
| Party | Candidate | Votes | % | |
|---|---|---|---|---|
| Democratic | Hilda Solis | 89,600 | 79.4 | |
| Green | Krista Lieberg-Wong | 10,294 | 9.1 | |
| Libertarian | Michael McGuire | 7,138 | 6.3 | |
| Natural Law | Richard D. Griffin | 5,882 | 5.2 | |
| Total votes | 112,914 | 100.0 | ||
| Voter turnout | % | |||
| Democratic hold | ||||
2002
| Party | Candidate | Votes | % | |
|---|---|---|---|---|
| Democratic | Xavier Becerra (incumbent) | 54,569 | 81.2 | |
| Republican | Luis Vega | 12,674 | 18.8 | |
| Total votes | 67,243 | 100.0 | ||
| Voter turnout | % | |||
| Democratic hold | ||||
2004
| Party | Candidate | Votes | % | |
|---|---|---|---|---|
| Democratic | Xavier Becerra (incumbent) | 89,363 | 80.3 | |
| Republican | Luis Vega | 22,048 | 19.7 | |
| Total votes | 111,411 | 100.0 | ||
| Voter turnout | % | |||
| Democratic hold | ||||
2006
| Party | Candidate | Votes | % | |
|---|---|---|---|---|
| Democratic | Xavier Becerra (incumbent) | 64,952 | 98 | |
| Voter turnout | % | |||
| Democratic hold | ||||
2008
| Party | Candidate | Votes | % | |
|---|---|---|---|---|
| Democratic | Xavier Becerra (incumbent) | 110,955 | 100.00 | |
| Voter turnout | % | |||
| Democratic hold | ||||
2010
| Party | Candidate | Votes | % | |
|---|---|---|---|---|
| Democratic | Xavier Becerra (incumbent) | 76,363 | 83.82 | |
| Republican | Stephen C. Smith | 14,740 | 16.18 | |
| Voter turnout | % | |||
| Democratic hold | ||||
2012
| Party | Candidate | Votes | % | |
|---|---|---|---|---|
| Republican | Gary Miller (incumbent) | 88,964 | 55.2 | |
| Republican | Robert Dutton | 72,255 | 44.8 | |
| Total votes | 161,219 | 100.0 | ||
| Republican hold | ||||
2014
| Party | Candidate | Votes | % | |
|---|---|---|---|---|
| Democratic | Pete Aguilar | 51,622 | 52% | |
| Republican | Paul Chabot | 48,162 | 48% | |
| Total votes | 99,784 | 100% | ||
| Democratic gain from Republican | ||||
Living former Members
As of April 2015, there are three former members of the U.S. House of Representatives from California's 31st congressional district that are currently living.
| Representative | Term in office | Date of birth (and age) |
|---|---|---|
| Hilda Solis | 2001 - 2003 | October 20, 1957 |
| Xavier Becerra | 2003 - 2013 | January 26, 1958 |
| Gary Miller | 2013 - 2015 | October 16, 1948 |
Former district boundaries
See also
References
- ↑ California's citizen commission final district maps
- ↑ Statement of Vote (2000 President)
- ↑ Statement of Vote (2000 Senator)
- ↑ Statement of Vote (2002 Governor)
- ↑ Statement of Vote (2003 Recall Question)
- ↑ Statement of Vote (2003 Governor)
- ↑ Statement of Vote (2004 President)
- ↑ Statement of Vote (2004 Senator)
- ↑ Statement of Vote (2006 Governor)
- ↑ Statement of Vote (2006 Senator)
- ↑ (2008 President)
- ↑ Statement of Vote (2010 Governor)
- ↑ Statement of Vote (2010 Senator)
- ↑ 1962 election results
- ↑ 1964 election results
- ↑ 1966 election results
- ↑ 1968 election results
- ↑ 1970 election results
- ↑ 1972 election results
- ↑ 1974 election results
- ↑ 1976 election results
- ↑ 1978 election results
- ↑ 1980 election results
- ↑ 1982 election results
- ↑ 1986 election results
- ↑ 1988 election results
- ↑ 1990 election results
- ↑ 1992 election results
- ↑ 1994 election results
- ↑ 1996 election results
- ↑ 1998 election results
- ↑ 2000 election results
- ↑ 2002 general election results Archived February 3, 2009, at the Wayback Machine.
- ↑ 2004 general election results
- ↑ 2006 general election results Archived November 27, 2008, at the Wayback Machine.
- ↑ 2008 general election results
- ↑ 2010 general election results
- ↑ 2012 general election results Archived October 19, 2013, at the Wayback Machine.
- ↑ 2012 general election results Archived October 19, 2013, at the Wayback Machine.
External links
- GovTrack.us: California's 31st congressional district
- RAND California Election Returns: District Definitions
- California Voter Foundation map - CD31
Coordinates: 34°06′36″N 117°21′12″W / 34.11000°N 117.35333°W