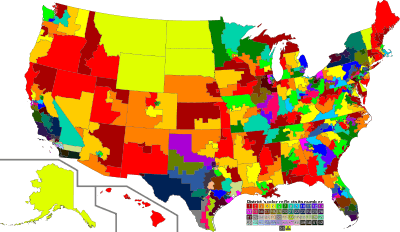
List of United States congressional districts

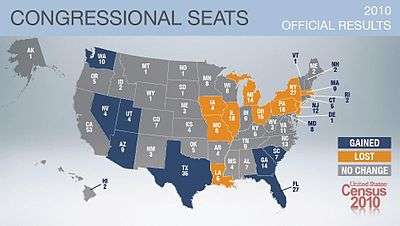
Change in apportionment of congressional districts, starting in 2013, as a result of the 2010 census
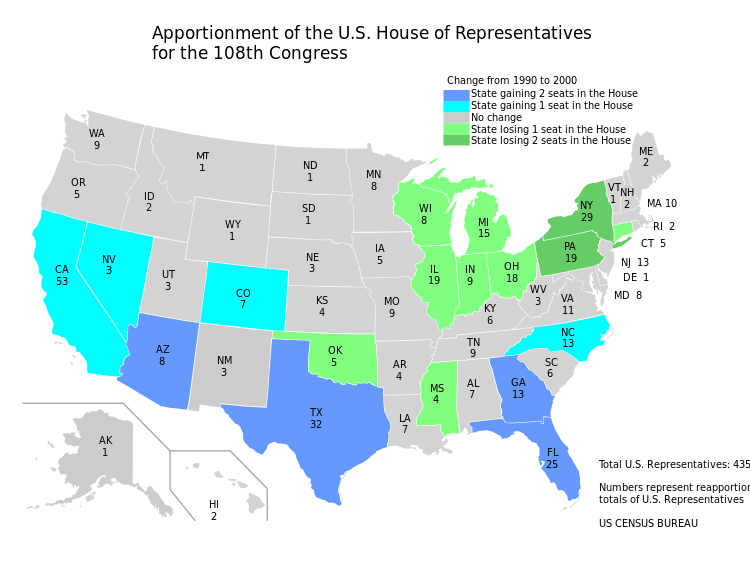
Change in apportionment of congressional districts, from 2003 to 2013, as a result of the 2000 census
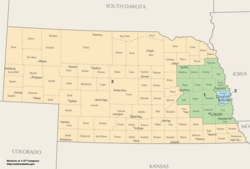
This is a complete list of congressional districts for representation in the United States House of Representatives. The quantity (apportionment) and boundaries (redistricting) of districts are determined after each census, although in some cases states have changed the boundaries more than once per census. This list includes the 435 current and over 200 obsolete districts. For example, since the 2000 census, Nebraska has had three districts, but it used to have as many as six. In the first decade of the twenty-first century, Texas had 32 districts, but has since added four due to reapportionment as a result of the 2010 census. Other states have lost districts since the number of congressional seats has been set at 435 by statute. Also included here are non-voting delegations: six current and one obsolete.
The boundaries of districts often shift with each redistricting. Over time, the region and demographics represented in a district can change substantially. Furthermore, districts sometimes retain the same boundaries while changing their district numbers.
Extremes
Population
- Average population: 710,767 people[1] (In 2000: 646,946)
- State with the most people in the average district: Montana (994,416)[1] (In 2000: also Montana (905,316))
- State with the fewest people in the average district: Rhode Island (527,624)[1] (In 2000: [Data unknown/missing. You can help!])
- District with the most people: Montana At-large (994,416)[1] (In 2000: also Montana At-large (905,316))
- District with the fewest people: Rhode Island's 1st (526,283 - as of 2010 census)[2] (In 2000: [Data unknown/missing. You can help!])
Districts per state
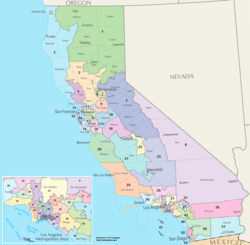
- State with the most: California (53) (Same as in 2000)
- States with the fewest (only one district "at-large"): Alaska, Delaware, Montana, North Dakota, South Dakota, Vermont, and Wyoming. Alaska, Delaware, and Wyoming are the only states that have never had more than one district. Between 1810 and 1820, Delaware had two Representatives, but they were elected at-large.
Area
- District with the greatest area: Alaska At-large (Same as in 2000)
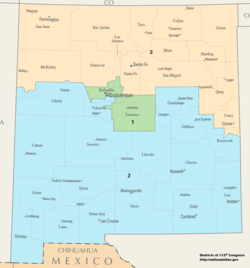
- District with the greatest area that comprises less than an entire state: New Mexico's 2nd (In 2000: Nevada's 2nd)
- District with the smallest area: New York's 13th (In 2000: New York's 15th[3])
Oldest district
- Delaware At-large (Same geographical borders since 1789)
Alabama

- Territory: 1818–1819 (obsolete since statehood)
- At-large: 1819–1823, 1841–1843, 1873–1877, 1913–1917, 1963–1965 (obsolete)
- 1st district: 1833–1841, 1843–1963, 1965–present
- 2nd district: 1823–1841, 1843–1963, 1965–present
- 3rd district: 1823–1841, 1843–1963, 1965–present
- 4th district: 1833–1841, 1843–1963, 1965–present
- 5th district: 1833–1841, 1843–1963, 1965–present
- 6th district: 1843–1963, 1965–present
- 7th district: 1843–1863, 1877–1963, 1965–present
- 8th district: 1877–1963, 1965–1973 (obsolete since the 1970 census)
- 9th district: 1893–1963 (obsolete since the 1960 census)
- 10th district: 1917–1933 (obsolete since the 1930 census)
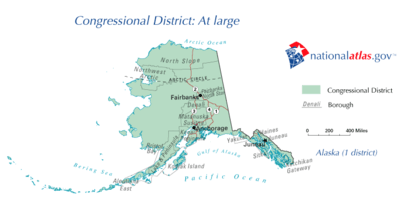
Alaska
American Samoa
See Non-voting delegations, below.
Arizona

- Territory: 1863–1912 (obsolete since statehood)
- At-large: 1912–1949 (obsolete)
- 1st district: 1949–present
- 2nd district: 1949–present
- 3rd district: 1963–present
- 4th district: 1973–present
- 5th district: 1983–present
- 6th district: 1993–present
- 7th district: 2003–present
- 8th district: 2003–present
- 9th district: 2013–present
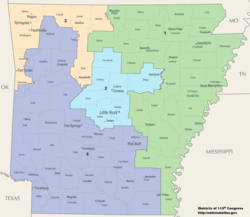
Arkansas
- Territory: 1819–1836 (obsolete since statehood)
- At-large: 1836–1853, 1873–1875, 1883–1885 (obsolete)
- 1st district: 1853–present
- 2nd district: 1853–present
- 3rd district: 1863–present
- 4th district: 1875–present
- 5th district: 1885–1963 (obsolete since the 1960 census)
- 6th district: 1893–1963 (obsolete since the 1960 census)
- 7th district: 1903–1953 (obsolete since the 1950 census)
California
- At-large: 1849–1865, 1883–1885 (obsolete)
- 1st district: 1865–present
- 2nd district: 1865–present
- 3rd district: 1865–present
- 4th district: 1873–present
- 5th district: 1885–present
- 6th district: 1885–present
- 7th district: 1893–present
- 8th district: 1903–present
- 9th district: 1913–present
- 10th district: 1913–present
- 11th district: 1913–present
- 12th district: 1933–present
- 13th district: 1933–present
- 14th district: 1933–present
- 15th district: 1933–present
- 16th district: 1933–present
- 17th district: 1933–present
- 18th district: 1933–present
- 19th district: 1933–present
- 20th district: 1933–present
- 21st district: 1943–present
- 22nd district: 1943–present
- 23rd district: 1943–present
- 24th district: 1953–present
- 25th district: 1953–present
- 26th district: 1953–present
- 27th district: 1953–present
- 28th district: 1953–present
- 29th district: 1953–present
- 30th district: 1953–present
- 31st district: 1963–present
- 32nd district: 1963–present
- 33rd district: 1963–present
- 34th district: 1963–present
- 35th district: 1963–present
- 36th district: 1963–present
- 37th district: 1963–present
- 38th district: 1963–present
- 39th district: 1973–present
- 40th district: 1973–present
- 41st district: 1973–present
- 42nd district: 1973–present
- 43rd district: 1973–present
- 44th district: 1983–present
- 45th district: 1983–present
- 46th district: 1993–present
- 47th district: 1993–present
- 48th district: 1993–present
- 49th district: 1993–present
- 50th district: 1993–present
- 51st district: 1993–present
- 52nd district: 1993–present
- 53rd district: 2003–present
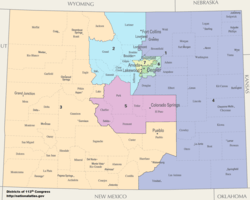
Colorado
- Territory: 1861–1876 (obsolete since statehood)
- At-large: 1876–1893, 1903–1915 (obsolete)
- 1st district: 1893–present
- 2nd district: 1893–present
- 3rd district: 1915–present
- 4th district: 1915–present
- 5th district: 1973–present
- 6th district: 1983–present
- 7th district: 2003–present
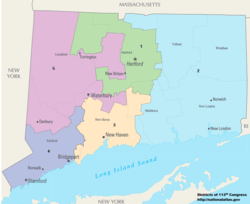
Connecticut
- At-large: 1789–1837, 1903–1913, 1933–1965 (obsolete)
- 1st district: 1837–present
- 2nd district: 1837–present
- 3rd district: 1837–present
- 4th district: 1837–present
- 5th district: 1837–1843, 1913–present
- 6th district: 1837–1843, 1965–2003 (obsolete since the 2000 census)
Delaware
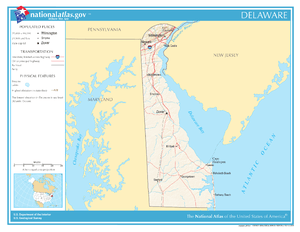
- At-large: 1789–present
The oldest district in the country, it has never changed its shape or size. From 1813 to 1823, Delaware had two representatives — both chosen at-large on a general ticket from the same statewide district.
District of Columbia
See Non-voting delegations, below.
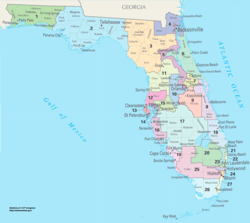
Florida
- Territory: 1822–1845 (obsolete since statehood)
- At-large: 1845–1875, 1913–1915, 1933–1937, 1943–1945 (obsolete)
- 1st district: 1875–present
- 2nd district: 1875–present
- 3rd district: 1903–present
- 4th district: 1915–present
- 5th district: 1937–present
- 6th district: 1945–present
- 7th district: 1953–present
- 8th district: 1953–present
- 9th district: 1963–present
- 10th district: 1963–present
- 11th district: 1963–present
- 12th district: 1963–present
- 13th district: 1973–present
- 14th district: 1973–present
- 15th district: 1973–present
- 16th district: 1983–present
- 17th district: 1983–present
- 18th district: 1983–present
- 19th district: 1983–present
- 20th district: 1993–present
- 21st district: 1993–present
- 22nd district: 1993–present
- 23rd district: 1993–present
- 24th district: 2003–present
- 25th district: 2003–present
- 26th district: 2013–present
- 27th district: 2013–present
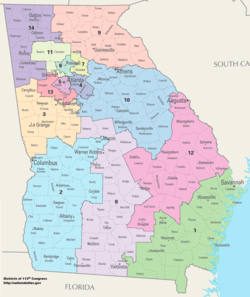
Georgia
- At-large: 1793–1827, 1829–1845, 1883–1885 (obsolete)
- 1st district: 1789–1793, 1827–1829, 1845–present
- 2nd district: 1789–1793, 1827–1829, 1845–present
- 3rd district: 1789–1793, 1827–1829, 1845–present
- 4th district: 1827–1829, 1845–present
- 5th district: 1827–1829, 1845–present
- 6th district: 1827–1829, 1845–present
- 7th district: 1827–1829, 1845–present
- 8th district: 1845–1863, 1873–present
- 9th district: 1873–present
- 10th district: 1885–present
- 11th district: 1893–1933, 1993–present
- 12th district: 1913–1933, 2003–present
- 13th district: 2003–present
- 14th district: 2013–present
Guam
See Non-voting delegations, below.
Hawaii

- Territory: 1900–1959 (obsolete since statehood)
- At-large: 1959–1971 (obsolete)
- 1st district: 1971–present
- 2nd district: 1971–present
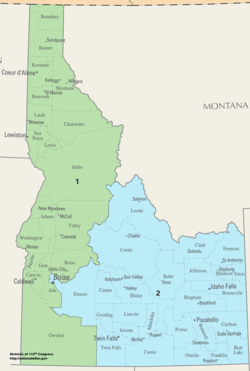
Idaho
- Territory: 1864–1890 (obsolete since statehood)
- At-large: 1890–1919 (obsolete)
- 1st district: 1919–present
- 2nd district: 1919–present
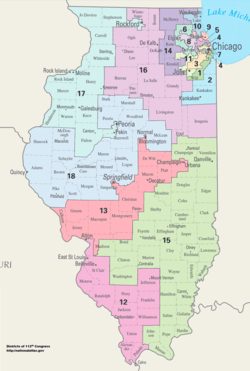
Illinois
- Territory: 1812–1818 (obsolete since statehood)
- At-large: 1818–1833, 1863–1873, 1893–1895, 1913–1949 (obsolete)
- 1st district: 1833–present
- 2nd district: 1833–present
- 3rd district: 1833–present
- 4th district: 1843–present
- 5th district: 1843–present
- 6th district: 1843–present
- 7th district: 1843–present
- 8th district: 1853–present
- 9th district: 1853–present
- 10th district: 1863–present
- 11th district: 1863–present
- 12th district: 1863–present
- 13th district: 1863–present
- 14th district: 1873–present
- 15th district: 1873–present
- 16th district: 1873–present
- 17th district: 1873–present
- 18th district: 1873–present
- 19th district: 1873–2013 (obsolete since the 2010 census)
- 20th district: 1883–2003 (obsolete since the 2000 census)
- 21st district: 1895–1993 (obsolete since the 1990 census)
- 22nd district: 1895–1993 (obsolete since the 1990 census)
- 23rd district: 1903–1983 (obsolete since the 1980 census)
- 24th district: 1903–1983 (obsolete since the 1980 census)
- 25th district: 1903–1963 (obsolete since the 1960 census)
- 26th district: 1949–1953 (obsolete since the 1950 census)
Indiana
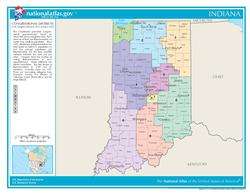
- Territory: 1805–1816 (obsolete since statehood)
- At-large: 1816–1823, 1873–1875 (obsolete)
- 1st district: 1823–present
- 2nd district: 1823–present
- 3rd district: 1823–present
- 4th district: 1833–present
- 5th district: 1833–present
- 6th district: 1833–present
- 7th district: 1833–present
- 8th district: 1843–present
- 9th district: 1843–present
- 10th district: 1843–2003 (obsolete since the 2000 census)
- 11th district: 1853–1983 (obsolete since the 1980 census)
- 12th district: 1875–1943 (obsolete since the 1940 census)
- 13th district: 1875–1933 (obsolete since the 1930 census)
Iowa
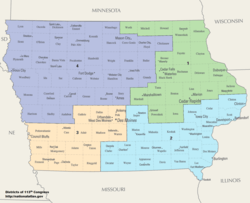
- Territory: 1838–1846 (obsolete since statehood)
- At-large: 1846–1847 (obsolete)
- 1st district: 1847–present
- 2nd district: 1847–present
- 3rd district: 1863–present
- 4th district: 1863–present
- 5th district: 1863–2013 (obsolete since the 2010 census)
- 6th district: 1863–1993 (obsolete since the 1990 census)
- 7th district: 1873–1973 (obsolete since the 1970 census)
- 8th district: 1873–1963 (obsolete since the 1960 census)
- 9th district: 1873–1943 (obsolete since the 1940 census)
- 10th district: 1883–1933 (obsolete since the 1930 census)
- 11th district: 1883–1933 (obsolete since the 1930 census)
Kansas
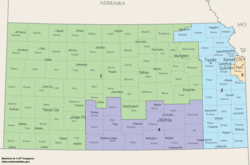
- Territory: 1854–1861 (obsolete since statehood)
- At-large: 1861–1875, 1883–1907 (obsolete)
- 1st district: 1875–present
- 2nd district: 1875–present
- 3rd district: 1875–present
- 4th district: 1893–present
- 5th district: 1893–1993 (obsolete since the 1990 census)
- 6th district: 1893–1963 (obsolete since the 1960 census)
- 7th district: 1893–1943 (obsolete since the 1940 census)
- 8th district: 1907–1933 (obsolete since the 1930 census)
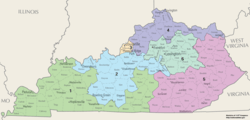
Kentucky
- At-large: 1933–1935 (obsolete)
- 1st district: 1792–1933, 1935–present
- 2nd district: 1792–1933, 1935–present
- 3rd district: 1803–1933, 1935–present
- 4th district: 1803–1933, 1935–present
- 5th district: 1803–1933, 1935–present
- 6th district: 1803–1933, 1935–present
- 7th district: 1813–1933, 1935–1993 (obsolete since the 1990 census)
- 8th district: 1813–1933, 1935–1963 (obsolete since the 1960 census)
- 9th district: 1813–1933, 1935–1953 (obsolete since the 1950 census)
- 10th district: 1813–1933 (obsolete since the 1930 census)
- 11th district: 1823–1933 (obsolete since the 1930 census)
- 12th district: 1823–1843 (obsolete since the 1840 census)
- 13th district: 1833–1843 (obsolete since the 1840 census)
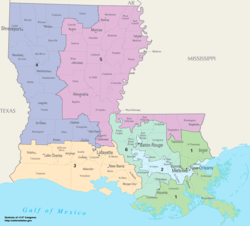
Louisiana
- Orleans Territory: 1806–1812 (obsolete since statehood)
- At-large: 1812–1823, 1873–1875 (obsolete)
- 1st district: 1823–present
- 2nd district: 1823–present
- 3rd district: 1823–present
- 4th district: 1843–present
- 5th district: 1863–present
- 6th district: 1875–present
- 7th district: 1903–2013 (obsolete since the 2010 census)
- 8th district: 1913–1993 (obsolete since the 1990 census)
Maine
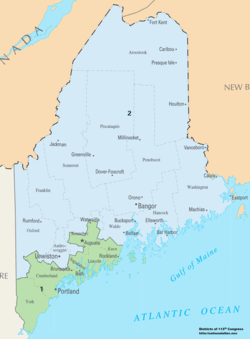
Until 1820, Maine was part of Massachusetts. After the 1810 census, Massachusetts was allocated 20 districts. Seven Massachusetts districts (then numbered 14 through 20) were credited to Maine soon after it became a state in 1820. See District of Maine.
- At-large: 1883–1885 (obsolete)
- 1st district: 1820–1883, 1885–present
- 2nd district: 1820–1883, 1885–present
- 3rd district: 1820–1883, 1885–1963 (obsolete since the 1960 census)
- 4th district: 1820–1883, 1885–1933 (obsolete since the 1930 census)
- 5th district: 1820–1883 (obsolete since the 1880 census)
- 6th district: 1820–1863 (obsolete since the 1860 census)
- 7th district: 1820–1850 (obsolete since the 1850 census)
- 8th district: 1833–1843 (obsolete since the 1840 census)
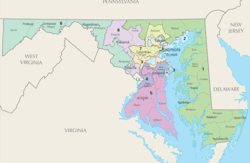
Maryland
- At-large: 1963–1967 (obsolete)
- 1st district: 1789–present
- 2nd district: 1789–present
- 3rd district: 1789–present
- 4th district: 1789–present
- 5th district: 1789–present
- 6th district: 1789–1863, 1873–present
- 7th district: 1793–1843, 1953–present
- 8th district: 1793–1835, 1967–present
Massachusetts

- At-large: 1793–1795 (obsolete)
- 1st district: 1789–present
- 2nd district: 1789–present
- 3rd district: 1789–present
- 4th district: 1789–present
- 5th district: 1789–1793, 1795–present
- 6th district: 1789–1793, 1795–present
- 7th district: 1789–1793, 1795–present
- 8th district: 1789–1793, 1795–present
- 9th district: 1795–present
- 10th district: 1795–2013 (obsolete since the 2010 census)
- 11th district: 1795–1843, 1853–1863, 1873–1993 (obsolete since the 1990 census)
- 12th district: 1795–1843, 1883–1983 (obsolete since the 1980 census)
- 13th district: 1795–1833, 1893–1963 (obsolete since the 1960 census)
- 14th district: 1795–1820 (moved to Maine), 1903–1963 (obsolete since the 1960 census)
- 15th district: 1803–1820 (moved to Maine), 1913–1943 (obsolete since the 1940 census)
- 16th district: 1803–1820 (moved to Maine), 1913–1933 (obsolete since the 1930 census)
- 17th district: 1803–1820 (obsolete since 1820 move to Maine[4])
- 18th district: 1813–1820 (obsolete since 1820 move to Maine[4])
- 19th district: 1813–1820 (obsolete since 1820 move to Maine[4])
- 20th district: 1813–1820 (obsolete since 1820 move to Maine[4])
Michigan
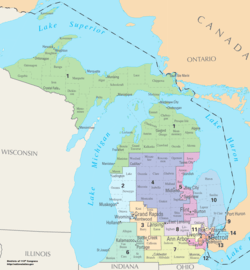
- Territory: 1819–1837 (obsolete since statehood)
- At-large 1835–1843, 1913–1915, 1963–1965 (obsolete)
- 1st district: 1843–present
- 2nd district: 1843–present
- 3rd district: 1843–present
- 4th district: 1853–present
- 5th district: 1863–present
- 6th district: 1863–present
- 7th district: 1873–present
- 8th district: 1873–present
- 9th district: 1873–present
- 10th district: 1883–present
- 11th district: 1883–present
- 12th district: 1893–present
- 13th district: 1915–present
- 14th district: 1933–present
- 15th district: 1933–2013 (obsolete since the 2010 census)
- 16th district: 1933–2003 (obsolete since the 2000 census)
- 17th district: 1933–1993 (obsolete since the 1990 census)
- 18th district: 1933–1993 (obsolete since the 1990 census)
- 19th district: 1965–1983 (obsolete since the 1980 census)
Minnesota
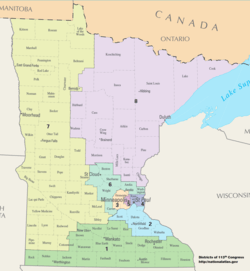
- Territory: 1849–1858 (obsolete since statehood)
- At-large: 1857–1863, 1913–1915, 1933–1935 (obsolete)
- 1st district: 1863–1933, 1935–present
- 2nd district: 1863–1933, 1935–present
- 3rd district: 1873–1933, 1935–present
- 4th district: 1883–1933, 1935–present
- 5th district: 1883–1933, 1935–present
- 6th district: 1893–1933, 1935–present
- 7th district: 1893–1933, 1935–present
- 8th district: 1903–1933, 1935–present
- 9th district: 1903–1933, 1935–1963 (obsolete since the 1960 census)
- 10th district: 1915–1933 (obsolete since the 1930 census)
Mississippi
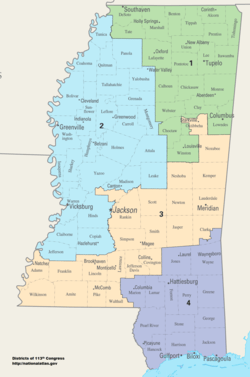
- Territory: 1801–1817 (obsolete since statehood)
- At-large: 1817–1847, 1853–1855 (obsolete)
- 1st district: 1847–present
- 2nd district: 1847–present
- 3rd district: 1847–present
- 4th district: 1847–present
- 5th district: 1855–2003 (obsolete since the 2000 census)
- 6th district: 1873–1963 (obsolete since the 1960 census)
- 7th district: 1883–1953 (obsolete since the 1950 census)
- 8th district: 1903–1933 (obsolete since the 1930 census)
Missouri

- Territory: 1812–1821 (obsolete since statehood)
- At-large: 1821–1847, 1933–1935 (obsolete)
- 1st district: 1847–1933, 1935–present
- 2nd district: 1847–1933, 1935–present
- 3rd district: 1847–1933, 1935–present
- 4th district: 1847–1933, 1935–present
- 5th district: 1847–1933, 1935–present
- 6th district: 1853–1933, 1935–present
- 7th district: 1853–1933, 1935–present
- 8th district: 1863–1933, 1935–present
- 9th district: 1863–1933, 1935–2013 (obsolete since the 2010 census)
- 10th district: 1873–1933, 1935–1983 (obsolete since the 1980 census)
- 11th district: 1873–1933, 1935–1963 (obsolete since the 1960 census)
- 12th district: 1873–1933, 1935–1953 (obsolete since the 1950 census)
- 13th district: 1873–1933, 1935–1953 (obsolete since the 1950 census)
- 14th district: 1883–1933 (obsolete since the 1930 census)
- 15th district: 1893–1933 (obsolete since the 1930 census)
- 16th district: 1903–1933 (obsolete since the 1930 census)
Montana
- Territory: 1865–1889 (obsolete since statehood)
- At-large: 1889–1919, 1993–present
- 1st district: 1919–1993 (obsolete since the 1990 census)
- 2nd district: 1919–1993 (obsolete since the 1990 census)
Nebraska
- Territory: 1855–1867 (obsolete since statehood)
- At-large: 1867–1883 (obsolete)
- 1st district: 1883–present
- 2nd district: 1883–present
- 3rd district: 1883–present
- 4th district: 1893–1963 (obsolete since the 1960 census)
- 5th district: 1893–1943 (obsolete since the 1940 census)
- 6th district: 1893–1933 (obsolete since the 1930 census)
Nevada
- Territory: 1861–1864 (obsolete since statehood)
- At-large: 1864–1983 (obsolete)
- 1st district: 1983–present
- 2nd district: 1983–present
- 3rd district: 2003–present
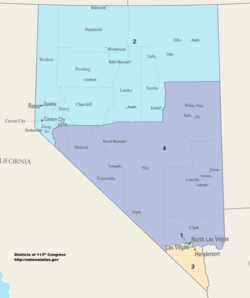
- 4th district: 2013–present
New Hampshire

- At-large: 1789–1847 (obsolete)
- 1st district: 1847–present
- 2nd district: 1847–present
- 3rd district: 1847–1883 (obsolete since the 1880 census)
- 4th district: 1847–1853 (obsolete since the 1850 census)
New Jersey
- At-large: 1789–1799, 1801–1813, 1815–1843 (obsolete)
- 1st district: 1799–1801, 1813–1815, 1843–present
- 2nd district: 1799–1801, 1813–1815, 1843–present
- 3rd district: 1799–1801, 1813–1815, 1843–present
- 4th district: 1799–1801, 1843–present
- 5th district: 1799–1801, 1843–present
- 6th district: 1873–present
- 7th district: 1873–present
- 8th district: 1893–present
- 9th district: 1903–present
- 10th district: 1903–present
- 11th district: 1913–present
- 12th district: 1913–present
- 13th district: 1933–2013 (obsolete since the 2010 census)
- 14th district: 1933–1993 (obsolete since the 1990 census)
- 15th district: 1963–1983 (obsolete since the 1980 census)
New Mexico
- Territory: 1851–1912 (obsolete since statehood)
- At-large: 1912–1969 (obsolete)
- 1st district: 1969–present
- 2nd district: 1969–present
- 3rd district: 1983–present
New York

- At-large: 1873–1875, 1883–1885, 1933–1945 (obsolete)
- 1st district, 1789–present
- 2nd district, 1789–present
- 3rd district, 1789–present
- 4th district, 1789–present
- 5th district, 1789–present
- 6th district, 1789–present
- 7th district, 1793–present
- 8th district, 1793–present
- 9th district, 1793–present
- 10th district, 1793–present
- 11th district, 1803–present
- 12th district, 1803–present
- 13th district, 1803–present
- 14th district, 1803–present
- 15th district, 1803–present
- 16th district, 1803–1809, 1813–present
- 17th district, 1803–1809, 1813–present
- 18th district, 1813–present
- 19th district, 1813–present
- 20th district, 1813–present
- 21st district, 1813–present
- 22nd district, 1821–present
- 23rd district, 1823–present
- 24th district, 1823–present
- 25th district, 1823–present
- 26th district, 1823–present
- 27th district, 1823–present
- 28th district, 1823–2013 (obsolete since the 2010 census)
- 29th district, 1823–2013 (obsolete since the 2010 census)
- 30th district, 1823–2003 (obsolete since the 2000 census)
- 31st district, 1833–2003 (obsolete since the 2000 census)
- 32nd district, 1833–1863, 1873–1993 (obsolete since the 1990 census)
- 33rd district, 1833–1863, 1873–1993 (obsolete since the 1990 census)
- 34th district, 1843–1853, 1885–1993 (obsolete since the 1990 census)
- 35th district, 1903–1983 (obsolete since the 1980 census)
- 36th district, 1903–1983 (obsolete since the 1980 census)
- 37th district, 1903–1983 (obsolete since the 1980 census)
- 38th district, 1913–1983 (obsolete since the 1980 census)
- 39th district, 1913–1983 (obsolete since the 1980 census)
- 40th district, 1913–1973 (obsolete since the 1970 census)
- 41st district, 1913–1973 (obsolete since the 1970 census)
- 42nd district, 1913–1963 (obsolete since the 1960 census)
- 43rd district, 1913–1963 (obsolete since the 1960 census)
- 44th district, 1945–1953 (obsolete since the 1950 census)
- 45th district, 1945–1953 (obsolete since the 1950 census)
North Carolina
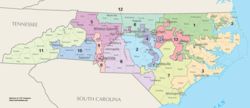
- At-large: 1883–1885 (obsolete)
- 1st district: 1789–present
- 2nd district: 1789–present
- 3rd district: 1789–present
- 4th district: 1789–present
- 5th district: 1789–present
- 6th district: 1793–present
- 7th district: 1793–present
- 8th district: 1793–1863, 1873–present
- 9th district: 1793–1853, 1885–present
- 10th district: 1793–1843, 1903–present
- 11th district: 1803–1843, 1933–present
- 12th district: 1803–1843, 1943–1963, 1993–present
- 13th district: 1813–1843, 2003–present
North Dakota
- Dakota Territory: 1861–1889 (obsolete since statehood)
- At-large: 1889–1913, 1933–1963, 1973–present
- 1st district: 1913–1933, 1963–1973 (obsolete since the 1970 census)
- 2nd district: 1913–1933, 1963–1973 (obsolete since the 1970 census)
- 3rd district: 1913–1933 (obsolete since the 1930 census)
Northern Mariana Islands
- See Non-voting delegations, below.
Ohio

- Northwest Territory: 1799–1803 (obsolete since statehood)
- At-large: 1803–1813, 1913–1915, 1933–1953, 1963–1967 (obsolete)
- 1st district: 1813–present
- 2nd district: 1813–present
- 3rd district: 1813–present
- 4th district: 1813–present
- 5th district: 1813–present
- 6th district: 1813–present
- 7th district: 1823–present
- 8th district: 1823–present
- 9th district: 1823–present
- 10th district: 1823–present
- 11th district: 1823–present
- 12th district: 1823–present
- 13th district: 1823–present
- 14th district: 1823–present
- 15th district: 1833–present
- 16th district: 1833–present
- 17th district: 1833–2013 (obsolete since the 2010 census)
- 18th district: 1833–2013 (obsolete since the 2010 census)
- 19th district: 1833–2003 (obsolete since the 2000 census)
- 20th district: 1843–1863, 1873–1993 (obsolete since the 1990 census)
- 21st district: 1843–1863, 1883–1993 (obsolete since the 1990 census)
- 22nd district: 1915–1983 (obsolete since the 1980 census)
- 23rd district: 1953–1983 (obsolete since the 1980 census)
- 24th district: 1967–1973 (obsolete since the 1970 census)
Oklahoma
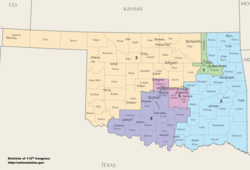
- Territory: 1890–1907 (obsolete since statehood)
- At-large: 1913–1915, 1933–1943 (obsolete)
- 1st district: 1907–present
- 2nd district: 1907–present
- 3rd district: 1907–present
- 4th district: 1907–present
- 5th district: 1907–present
- 6th district: 1915–2003 (obsolete since the 2000 census)
- 7th district: 1915–1953 (obsolete since the 1950 census)
- 8th district: 1915–1953 (obsolete since the 1950 census)
Oregon
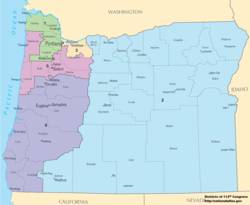
- Territory: 1849–1859 (obsolete since statehood)
- At-large: 1859–1893 (obsolete)
- 1st district: 1893–present
- 2nd district: 1893–present
- 3rd district: 1913–present
- 4th district: 1943–present
- 5th district: 1983–present
Pennsylvania

- At-large: 1789–1791, 1793–1795, 1873–1875, 1883–1889, 1893–1903, 1913–1923, 1943–1945 (obsolete)
- 1st district: 1791–1793, 1795–present
- 2nd district: 1791–1793, 1795–present
- 3rd district: 1791–1793, 1795–present
- 4th district: 1791–1793, 1795–present
- 5th district: 1791–1793, 1795–present
- 6th district: 1791–1793, 1795–present
- 7th district: 1791–1793, 1795–present
- 8th district: 1791–1793, 1795–present
- 9th district: 1795–present
- 10th district: 1795–present
- 11th district: 1795–present
- 12th district: 1795–1803, 1813–present
- 13th district: 1813–present
- 14th district: 1813–present
- 15th district: 1813–present
- 16th district: 1823–present
- 17th district: 1823–present
- 18th district: 1823–present
- 19th district: 1833–2013 (obsolete since the 2010 census)
- 20th district: 1833–2003 (obsolete since the 2000 census)
- 21st district: 1833–2003 (obsolete since the 2000 census)
- 22nd district: 1833–1993 (obsolete since the 1990 census)
- 23rd district: 1833–1993 (obsolete since the 1990 census)
- 24th district: 1833–1983 (obsolete since the 1980 census)
- 25th district: 1833–1843, 1853–1863, 1875–1983 (obsolete since the 1980 census)
- 26th district: 1875–1973 (obsolete since the 1970 census)
- 27th district: 1875–1963 (obsolete since the 1970 census)
- 28th district: 1889–1963 (obsolete since the 1960 census)
- 29th district: 1903–1963 (obsolete since the 1960 census)
- 30th district: 1903–1963 (obsolete since the 1960 census)
- 31st district: 1903–1953 (obsolete since the 1950 census)
- 32nd district: 1903–1953 (obsolete since the 1950 census)
- 33rd district: 1923–1953 (obsolete since the 1950 census)
- 34th district: 1923–1943 (obsolete since the 1940 census)
- 35th district: 1923–1933 (obsolete since the 1930 census)
- 36th district: 1923–1933 (obsolete since the 1930 census)
Philippines
- See Non-voting delegations, below.
Puerto Rico
- See Non-voting delegations, below.
Rhode Island
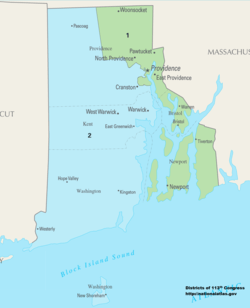
- At-large: 1790–1843 (obsolete)
- 1st district: 1843–present
- 2nd district: 1843–present
- 3rd district: 1913–1933 (obsolete since the 1930 census)
South Carolina
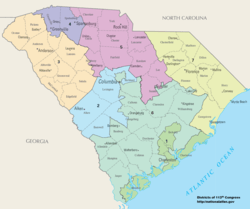
- At-large: 1873–1875 (obsolete)
- 1st district: 1789–present
- 2nd district: 1789–present
- 3rd district: 1789–present
- 4th district: 1789–present
- 5th district: 1789–1863, 1875–present
- 6th district: 1793–1863, 1883–present
- 7th district: 1803–1853, 1883–1933, 2013–present
- 8th district: 1803–1843 (obsolete since the 1840 census)
- 9th district: 1813–1843 (obsolete since the 1840 census)
South Dakota
- Dakota Territory 1861–1889 (obsolete since statehood)
- At-large: 1889–1913, 1983–present
- 1st district: 1913–1983 (obsolete since the 1980 census)
- 2nd district: 1913–1983 (obsolete since the 1980 census)
- 3rd district: 1913–1933 (obsolete since the 1930 census)
Tennessee

- Southwest Territory: 1794–1796 (obsolete since statehood)
- At-large: 1796–1805, 1873–1875 (obsolete)
- 1st district: 1805–present
- 2nd district: 1805–present
- 3rd district: 1805–present
- 4th district: 1813–present
- 5th district: 1813–present
- 6th district: 1813–present
- 7th district: 1823–present
- 8th district: 1823–present
- 9th district: 1823–1863, 1873–1973, 1983–present
- 10th district: 1833–1863, 1875–1933, 1943–1953 (obsolete since the 1950 census)
- 11th district: 1833–1853 (obsolete since the 1850 census)
- 12th district: 1833–1843 (obsolete since the 1840 census)
- 13th district: 1833–1843 (obsolete since the 1840 census)
Texas

- At-large: 1873–1875, 1913–1919, 1933–1935, 1953–1959, 1963–1967 (obsolete)
- 1st district: 1845–present
- 2nd district: 1845–present
- 3rd district: 1863–present
- 4th district: 1863–present
- 5th district: 1875–present
- 6th district: 1875–present
- 7th district: 1883–present
- 8th district: 1883–present
- 9th district: 1883–present
- 10th district: 1883–present
- 11th district: 1883–present
- 12th district: 1893–present
- 13th district: 1893–present
- 14th district: 1903–present
- 15th district: 1903–present
- 16th district: 1903–present
- 17th district: 1919–present
- 18th district: 1919–present
- 19th district: 1935–present
- 20th district: 1935–present
- 21st district: 1935–present
- 22nd district: 1959–present
- 23rd district: 1967–present
- 24th district: 1973–present
- 25th district: 1983–present
- 26th district: 1983–present
- 27th district: 1983–present
- 28th district: 1993–present
- 29th district: 1993–present
- 30th district: 1993–present
- 31st district: 2003–present
- 32nd district: 2003–present
- 33rd district: 2013–present
- 34th district: 2013–present
- 35th district: 2013–present
- 36th district: 2013–present
U.S. Virgin Islands
- See Non-voting delegations, below.
Utah
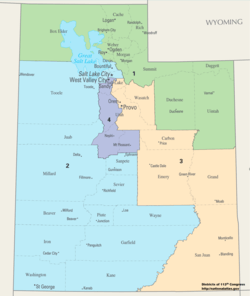
- Territory (obsolete since statehood)
- At-large: 1896–1913 (obsolete)
- 1st district: 1913–present
- 2nd district: 1913–present
- 3rd district: 1983–present
- 4th district: 2013–present
Vermont
- At-large: 1813–1821, 1823–1825, 1933–present
- 1st district: 1791–1813, 1821–1823, 1825–1933 (obsolete since the 1930 census)
- 2nd district: 1791–1813, 1821–1823, 1825–1933 (obsolete since the 1930 census)
- 3rd district: 1803–1813, 1821–1823, 1825–1883 (obsolete since the 1880 census)
- 4th district: 1803–1813, 1821–1823, 1825–1853 (obsolete since the 1850 census)
- 5th district: 1821–1823, 1825–1843 (obsolete since the 1840 census)
- 6th district: 1821–1823 (obsolete since the 1820 census)
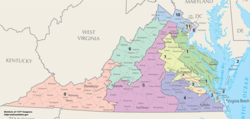
Virginia
- At-large: 1883–1885, 1933–1935 (obsolete)
- 1st district: 1789–1933, 1935–present
- 2nd district: 1789–1933, 1935–present
- 3rd district: 1789–1933, 1935–present
- 4th district: 1789–1933, 1935–present
- 5th district: 1789–1933, 1935–present
- 6th district: 1789–1933, 1935–present
- 7th district: 1789–1933, 1935–present
- 8th district: 1789–1933, 1935–present
- 9th district: 1789–1933, 1935–present
- 10th district: 1789–1863, 1885–1933, 1953–present
- 11th district: 1793–1863, 1993–present
- 12th district: 1793–1863 (obsolete since the 1863 move to West Virginia)
- 13th district: 1793–1863 (obsolete since the 1863 move to West Virginia)
- 14th district: 1793–1853 (obsolete since the 1850 census)
- 15th district: 1793–1853 (obsolete since the 1850 census)
- 16th district: 1793–1843 (obsolete since the 1840 census)
- 17th district: 1793–1843 (obsolete since the 1840 census)
- 18th district: 1793–1843 (obsolete since the 1840 census)
- 19th district: 1793–1843 (obsolete since the 1840 census)
- 20th district: 1803–1843 (obsolete since the 1840 census)
- 21st district: 1803–1843 (obsolete since the 1840 census)
- 22nd district: 1813–1833 (obsolete since the 1830 census)
- 23rd district: 1813–1823 (obsolete since the 1820 census)
Washington
_Congressional_Districts%2C_113th_Congress.tif.png)
- Territory: 1854–1889 (obsolete since statehood)
- At-large: 1889–1909, 1913–1915, 1953–1959 (obsolete)
- 1st district: 1909–present
- 2nd district: 1909–present
- 3rd district: 1909–present
- 4th district: 1915–present
- 5th district: 1915–present
- 6th district: 1933–present
- 7th district: 1959–present
- 8th district: 1983–present
- 9th district: 1993–present
- 10th district: 2013–present
West Virginia
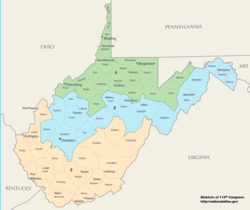
- At-large: 1913–1917 (obsolete)
- 1st district: 1863–present
- 2nd district: 1863–present
- 3rd district: 1863–present
- 4th district: 1883–1993 (obsolete since the 1990 census)
- 5th district: 1903–1973 (obsolete since the 1970 census)
- 6th district: 1917–1963 (obsolete since the 1960 census)
Wisconsin
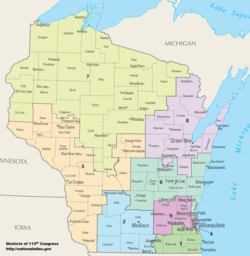
- Territory: 1836–1848 (obsolete since statehood)
- 1st district: 1848–present
- 2nd district: 1848–present
- 3rd district: 1849–present
- 4th district: 1863–present
- 5th district: 1863–present
- 6th district: 1863–present
- 7th district: 1873–present
- 8th district: 1873–present
- 9th district: 1883–2003 (obsolete since the 2000 census)
- 10th district: 1893–1973 (obsolete since the 1970 census)
- 11th district: 1903–1933 (obsolete since the 1930 census)
Wyoming

Non-voting delegations

- American Samoa, 1978–present
- District of Columbia, 1871–1875 & 1971–present
- Guam, 1970–present
- Northern Mariana Islands, 2009–present
- Philippines, 1907–1946 (obsolete since independence)
- Puerto Rico, 1901–present
- United States Virgin Islands, 1970–present
List of districts by area
This list includes the 435 voting districts, along with the District of Columbia's non-voting delegation.[5]
| Rank small | Rank large | District | Land area (mi²) | Land area (km²) |
|---|---|---|---|---|
| 435 | 1 | Alaska At-large | 571,951.26 | 1,481,353.76 |
| 434 | 2 | Montana At-large | 145,552.44 | 376,980.82 |
| 433 | 3 | Wyoming At-large | 97,100.40 | 251,490.04 |
| 432 | 4 | South Dakota At-large | 75,884.64 | 196,541.22 |
| 431 | 5 | New Mexico 2nd | 71,739.49 | 185,805.46 |
| 430 | 6 | Oregon 2nd | 69,442.78 | 179,856.98 |
| 429 | 7 | North Dakota At-large | 68,975.93 | 178,647.66 |
| 428 | 8 | Nebraska 3rd | 67,435.41 | 174,657.89 |
| 427 | 9 | Texas 23rd | 58,059.18 | 150,373.43 |
| 426 | 10 | Nevada 2nd | 55,829.71 | 144,599.09 |
| 425 | 11 | Arizona 1st | 55,039.61 | 142,552.73 |
| 424 | 12 | Kansas 1st | 52,542.5 | 136085.21 |
| 423 | 13 | Nevada 4th | 50,997.97 | 132,084.87 |
| 422 | 14 | Colorado 3rd | 49,731.77 | 128,805.41 |
| 421 | 15 | New Mexico 3rd | 44,958.52 | 116,442.68 |
| 420 | 16 | Idaho 2nd | 43,225.09 | 111,953.1 |
| 419 | 17 | Utah 2nd | 39,987.95 | 103,568.89 |
| 418 | 18 | Idaho 1st | 39,418.02 | 102,092.77 |
| 417 | 19 | Texas 13th | 38,349.24 | 99,324.63 |
| 416 | 20 | Colorado 4th | 38,102.67 | 98,686.01 |
| 415 | 21 | Oklahoma 3rd | 34,116.73 | 88,362.42 |
| 414 | 22 | Minnesota 7th | 33,429.31 | 86,582 |
| 413 | 23 | Arizona 4th | 33,199.45 | 85,986.66 |
| 412 | 24 | California 8th | 32,867.21 | 85,126.16 |
| 411 | 25 | California 1st | 28,089.47 | 72,751.8 |
| 410 | 26 | Minnesota 8th | 27,908.13 | 72,282.13 |
| 409 | 27 | Texas 11th | 27,832.17 | 72,085.39 |
| 408 | 28 | Maine 2nd | 27,557.4 | 71,373.74 |
| 407 | 29 | Texas 19th | 25,835.59 | 66,914.25 |
| 406 | 30 | Michigan 1st | 25,027.75 | 64,821.94 |
| 405 | 31 | Wisconsin 7th | 23,037.26 | 59,666.56 |
| 404 | 32 | Iowa 4th | 22,756.75 | 58,940.04 |
| 403 | 33 | Arkansas 4th | 22,338.08 | 57,855.69 |
| 402 | 34 | Oklahoma 2nd | 20,995.35 | 54,378.01 |
| 401 | 35 | Utah 3rd | 20,070.54 | 51,982.75 |
| 400 | 36 | Missouri 8th | 19,901.17 | 51,544.08 |
| 399 | 37 | Utah 1st | 19,560.79 | 50,662.5 |
| 398 | 38 | Arkansas 1st | 19,318.29 | 50,034.42 |
| 397 | 39 | Washington 4th | 19,250.22 | 49,858.12 |
| 396 | 40 | Missouri 6th | 18,198.62 | 47,134.47 |
| 395 | 41 | Oregon 4th | 17,274.04 | 44739.81 |
| 394 | 42 | Arizona 3rd | 15,688.79 | 40,634.01 |
| 393 | 43 | Mississippi 2nd | 15,551.51 | 40,278.45 |
| 392 | 44 | Washington 5th | 15,473.13 | 40,075.45 |
| 391 | 45 | New York 21st | 15,114.76 | 39,147.27 |
| 390 | 46 | Illinois 15th | 14,695.67 | 38,061.82 |
| 389 | 47 | Louisiana 5th | 14,452.88 | 37,433 |
| 388 | 48 | Missouri 4th | 14,401.38 | 37,299.61 |
| 387 | 49 | Kansas 4th | 14,315.68 | 37,077.65 |
| 386 | 50 | Kansas 2nd | 14,143.34 | 36,631.29 |
| 385 | 51 | California 2nd | 12,952.23 | 33,546.31 |
| 384 | 52 | California 4th | 12,836.2 | 33,245.79 |
| 383 | 53 | Mississippi 3rd | 12,754.48 | 33,034.14 |
| 382 | 54 | Louisiana 4th | 12,435.1 | 32,206.94 |
| 381 | 55 | Iowa 2nd | 12,261.92 | 31,758.40 |
| 380 | 56 | Kentucky 1st | 12,079.5 | 31,285.94 |
| 379 | 57 | Iowa 1st | 12,048.84 | 31,206.53 |
| 378 | 58 | Minnesota 1st | 11,973.99 | 31,012.67 |
| 377 | 59 | Kentucky 5th | 11,235.15 | 29,099.07 |
| 376 | 60 | Wisconsin 3rd | 11,111.79 | 28,779.56 |
| 375 | 61 | Pennsylvania 5th | 10,711.21 | 27,742.06 |
| 374 | 62 | Mississippi 1st | 10,572.8 | 27,383.58 |
| 373 | 63 | Illinois 18th | 10,515.95 | 27,236.34 |
| 372 | 64 | Alabama 7th | 10,156.13 | 26,304.40 |
| 371 | 65 | Alabama 2nd | 10,141.63 | 26,266.85 |
| 370 | 66 | Texas 4th | 10,122.99 | 26,218.57 |
| 369 | 67 | Virginia 5th | 10,029.79 | 25,977.18 |
| 368 | 68 | California 23rd | 9,898 | 25,635.85 |
| 367 | 69 | Oklahoma 4th | 9,777.28 | 25,323.18 |
| 366 | 70 | West Virginia 3rd | 9,745.33 | 25,240.43 |
| 365 | 71 | Georgia 2nd | 9,626.23 | 24,931.96 |
| 364 | 72 | Texas 28th | 9,378.53 | 24,290.42 |
| 363 | 73 | Vermont At-large | 9,249.56 | 23,956.36 |
| 362 | 74 | Tennessee 7th | 9,160.44 | 23,725.56 |
| 361 | 75 | Texas 27th | 9,128.25 | 23,642.19 |
| 360 | 76 | Washington 3rd | 9,114.01 | 23,605.31 |
| 359 | 77 | Virginia 9th | 9,113.87 | 23,604.95 |
| 358 | 78 | Alabama 4th | 8,888.77 | 23,021.94 |
| 357 | 79 | Nebraska 1st | 8,879.02 | 22,996.68 |
| 356 | 80 | Iowa 3rd | 8,789.62 | 22,765.14 |
| 355 | 81 | Georgia 8th | 8,711.64 | 22,563.17 |
| 354 | 82 | Florida 2nd | 8,613.58 | 22,309.19 |
| 353 | 83 | Michigan 4th | 8,457.8 | 21,905.72 |
| 352 | 84 | Pennsylvania 10th | 8,378.06 | 21,699.2 |
| 351 | 85 | Texas 34th | 8,190.32 | 21,212.95 |
| 350 | 86 | Georgia 12th | 8,185.27 | 21,199.87 |
| 349 | 87 | South Carolina 6th | 8,062.93 | 20,883.01 |
| 348 | 88 | Mississippi 4th | 8,044.48 | 20,835.22 |
| 347 | 89 | West Virginia 2nd | 8,017.31 | 20,764.85 |
| 346 | 90 | Georgia 1st | 7,982.81 | 20,675.5 |
| 345 | 91 | New York 19th | 7,937.02 | 20,556.90 |
| 344 | 92 | Illinois 16th | 7,917.49 | 20,506.32 |
| 343 | 93 | Texas 1st | 7,858.86 | 20,354.47 |
| 342 | 94 | Arizona 2nd | 7,838.12 | 20,300.75 |
| 341 | 95 | North Carolina 3rd | 7,810.08 | 20,228.13 |
| 340 | 96 | Texas 15th | 7,804.07 | 20,212.56 |
| 339 | 97 | Texas 17th | 7,651.16 | 19,816.52 |
| 338 | 98 | Texas 25th | 7,620.7 | 19,737.63 |
| 337 | 99 | Alabama 3rd | 7,543.86 | 19,538.62 |
| 336 | 100 | Colorado 2nd | 7,535.34 | 19,516.55 |
| 335 | 101 | New York 23rd | 7,371.65 | 19,092.59 |
| 334 | 102 | Washington 8th | 7,359.7 | 19,061.64 |
| 333 | 103 | Florida 3rd | 7,306.05 | 18,922.69 |
| 332 | 104 | Colorado 5th | 7,265.72 | 18,818.23 |
| 331 | 105 | Indiana 8th | 7,255.39 | 18,791.48 |
| 330 | 106 | Ohio 6th | 7,215.03 | 18,686.95 |
| 329 | 107 | Kentucky 2nd | 7,177.44 | 18,589.59 |
| 328 | 108 | Texas 36th | 7,125.83 | 18,455.92 |
| 327 | 109 | Georgia 10th | 7,096.22 | 18,379.23 |
| 326 | 110 | Louisiana 3rd | 6,983.32 | 18,086.82 |
| 325 | 111 | Illinois 17th | 6,933.08 | 17,956.7 |
| 324 | 112 | Washington 6th | 6,902.73 | 17,878.09 |
| 323 | 113 | California 24th | 6,883.35 | 17,827.89 |
| 322 | 114 | Missouri 3rd | 6,851.54 | 17,745.51 |
| 321 | 115 | Tennessee 8th | 6,850.53 | 17,742.89 |
| 320 | 116 | North Carolina 11th | 6,838.24 | 17,711.06 |
| 319 | 117 | Wisconsin 8th | 6,806.67 | 17,629.29 |
| 318 | 118 | California 21st | 6,729.94 | 17,430.56 |
| 317 | 119 | New Hampshire 2nd | 6,489 | 16,806.53 |
| 316 | 120 | Tennessee 6th | 6,474.21 | 16,768.22 |
| 315 | 121 | Florida 17th | 6,369.97 | 16,498.24 |
| 314 | 122 | Indiana 4th | 6,352.55 | 16,453.12 |
| 313 | 123 | West Virginia 1st | 6,275.56 | 16,253.72 |
| 312 | 124 | Missouri's 7th | 6,272.84 | 16,246.67 |
| 311 | 125 | Hawaii 2nd | 6,213.4 | 16,092.72 |
| 310 | 126 | Indiana 6th | 6,206.83 | 16,075.71 |
| 309 | 127 | Washington 1st | 6,186.47 | 16,022.97 |
| 308 | 128 | California 3rd | 6,183.59 | 16,015.51 |
| 307 | 129 | North Carolina 7th | 6161.77 | 15,959 |
| 306 | 130 | Alabama 1st | 6,066.83 | 15,713.11 |
| 305 | 131 | Texas 8th | 6,053.76 | 15,679.25 |
| 304 | 132 | Tennessee 4th | 5,984.84 | 15,500.75 |
| 303 | 133 | Virginia 6th | 5,930.02 | 15,358.77 |
| 302 | 134 | Texas 21st | 5,920.89 | 15,335.12 |
| 301 | 135 | California 36th | 5,912.64 | 15,313.75 |
| 300 | 136 | Illinois 13th | 5,793.65 | 15,005.57 |
| 299 | 137 | Pennsylvania 9th | 5,730.09 | 14,840.95 |
| 298 | 138 | Ohio 5th | 5,626.47 | 14,572.57 |
| 297 | 139 | South Carolina 5th | 5,505.54 | 14,259.36 |
| 296 | 140 | North Carolina 1st | 5,494.28 | 14,230.2 |
| 295 | 141 | Arkansas 3rd | 5,400.99 | 13,988.58 |
| 294 | 142 | South Carolina 7th | 5,354.62 | 13,868.48 |
| 293 | 143 | South Carolina 3rd | 5,268.28 | 13,644.86 |
| 292 | 144 | Georgia 9th | 5,210.81 | 13,496.01 |
| 291 | 145 | Oregon 5th | 5,189.73 | 13,441.41 |
| 290 | 146 | New York 22nd | 5,077.45 | 13,150.61 |
| 289 | 147 | Texas 10th | 5,070.95 | 13,133.77 |
| 288 | 148 | Texas 5th | 5,043.85 | 13,063.58 |
| 287 | 149 | Illinois 12th | 5,008.21 | 12,971.28 |
| 286 | 150 | Arkansas 2nd | 4,978.12 | 12,893.34 |
| 285 | 151 | Wisconsin 6th | 4,918.39 | 12,738.64 |
| 284 | 152 | California 20th | 4,874.22 | 12,624.24 |
| 283 | 153 | California 51st | 4,791.61 | 12,410.28 |
| 282 | 154 | Ohio 15th | 4,738.93 | 12,273.84 |
| 281 | 155 | Ohio 4th | 4,664.87 | 12,082.03 |
| 280 | 156 | New Mexico 1st | 4,600.14 | 11,914.37 |
| 279 | 157 | Tennessee 3rd | 4,570.32 | 11,837.14 |
| 278 | 158 | Wisconsin 2nd | 4,536.69 | 11,750.04 |
| 277 | 159 | North Carolina 8th | 4,512.78 | 11,688.11 |
| 276 | 160 | Indiana 9th | 4,486.77 | 11,620.75 |
| 275 | 161 | Kentucky 4th | 4,382.19 | 11,349.88 |
| 274 | 162 | Virginia 4th | 4,310.34 | 11,163.79 |
| 273 | 163 | Kentucky 6th | 4,292.72 | 11,118.16 |
| 272 | 164 | Michigan 7th | 4,227.73 | 10,949.83 |
| 271 | 165 | Indiana 3rd | 4,180.37 | 10,827.17 |
| 270 | 166 | Alabama 6th | 4,170.78 | 10,802.331 |
| 269 | 167 | Tennessee 1st | 4,141.92 | 10,727.58 |
| 268 | 168 | Michigan 10th | 4,140.44 | 10,723.75 |
| 267 | 169 | Louisiana 6th | 4,033.89 | 10,447.79 |
| 266 | 170 | Louisiana 1st | 4,030.23 | 10,438.31 |
| 265 | 171 | Florida 1st | 4,016.3 | 10,402.23 |
| 264 | 172 | Maryland 1st | 3,977.06 | 10,300.6 |
| 263 | 173 | New York 27th | 3,973.13 | 10,290.42 |
| 262 | 174 | Indiana 2nd | 3,958.58 | 10,252.73 |
| 261 | 175 | Ohio 7th | 3,864.76 | 10,009.74 |
| 260 | 176 | Pennsylvania 3rd | 3,850.8 | 9,973.58 |
| 259 | 177 | Georgia 3rd | 3,838.27 | 9,941.13 |
| 258 | 178 | Virginia 1st | 3,684.32 | 9,542.4 |
| 257 | 179 | Alabama 5th | 3,677.31 | 9,524.24 |
| 256 | 180 | North Carolina 6th | 3,674.55 | 9517.09 |
| 255 | 181 | Georgia 14th | 3,623.16 | 9,383.99 |
| 254 | 182 | North Carolina 5th | 3,571.86 | 9,251.13 |
| 253 | 183 | Michigan 6th | 3,546.74 | 9,186.07 |
| 252 | 184 | Pennsylvania 11th | 3,356.48 | 8,693.29 |
| 251 | 185 | Maine 1st | 3,285.52 | 8,509.51 |
| 250 | 186 | Michigan 2nd | 3,281.19 | 8,498.29 |
| 249 | 187 | North Carolina 2nd | 3,246.68 | 8,408.91 |
| 248 | 188 | Florida 25th | 3,232.71 | 8,372.73 |
| 247 | 189 | Ohio 2nd | 3,221.62 | 8,344 |
| 246 | 190 | South Carolina 2nd | 3,022.17 | 7,827.43 |
| 245 | 191 | Oregon 1st | 3007 | 7,788.14 |
| 244 | 192 | Minnesota 6th | 2,882.22 | 7,464.96 |
| 243 | 193 | Nevada 3rd | 2,848.99 | 7,378.89 |
| 242 | 194 | California 16th | 2,839.51 | 7,354.34 |
| 241 | 195 | California 50th | 2,787.35 | 7,219.24 |
| 240 | 196 | Virginia 7th | 2,776.39 | 7,190.86 |
| 239 | 197 | Michigan 3rd | 2,628.74 | 6,808.44 |
| 238 | 198 | North Carolina 10th | 2,575.16 | 6,669.67 |
| 237 | 199 | Utah 4th | 2,550.35 | 6,605.41 |
| 236 | 200 | Florida 11th | 2,509.88 | 6,500.6 |
| 235 | 201 | Florida 6th | 2,506.92 | 6,492.93 |
| 234 | 202 | New Hampshire 1st | 2,463.65 | 6,380.86 |
| 233 | 203 | Ohio 8th | 2,450.49 | 6,346.78 |
| 232 | 204 | Texas 14th | 2,441.39 | 6,323.21 |
| 231 | 205 | Minnesota 2nd | 2,437.91 | 6,314.19 |
| 230 | 206 | Florida 20th | 2,427.42 | 6,287.02 |
| 229 | 207 | Missouri 5th | 2,424.85 | 6,280.37 |
| 228 | 208 | New York 24th | 2,388.56 | 6,186.38 |
| 227 | 209 | Massachusetts 1st | 2,350.29 | 6,087.26 |
| 226 | 210 | Michigan 5th | 2,348.70 | 6,083.14 |
| 225 | 211 | Tennessee 2nd | 2,320.68 | 6,010.57 |
| 224 | 212 | North Carolina 13th | 2,280.59 | 5,906.73 |
| 223 | 213 | Ohio 12th | 2,271.91 | 5,884.25 |
| 222 | 214 | Pennsylvania 12th | 2,163.03 | 5,602.25 |
| 221 | 215 | Texas 31st | 2,154.49 | 5,580.13 |
| 220 | 216 | Texas 6th | 2,148.41 | 5,564.39 |
| 219 | 217 | Florida 26th | 2,098.66 | 5,435.53 |
| 218 | 218 | New Jersey 2nd | 2,092.43 | 5,419.40 |
| 217 | 219 | Oklahoma 5th | 2,073.90 | 5,371.41 |
| 216 | 220 | Pennsylvania 18th | 2,072.79 | 5,368.53 |
| 215 | 221 | Connecticut 2nd | 1,987.68 | 5,148.10 |
| 214 | 222 | Ohio 14th | 1,953.14 | 5,058.64 |
| 213 | 223 | Maryland 6th | 1,950.26 | 5,051.18 |
| 212 | 224 | Delaware At-large | 1,949.00 | 5,047.00 |
| 211 | 225 | Indiana 5th | 1,924.76 | 4,985.13 |
| 210 | 226 | Wisconsin 5th | 1,890.75 | 4,897.05 |
| 209 | 227 | Florida 4th | 1,875.97 | 4,858.77 |
| 208 | 228 | California 10th | 1,818.79 | 4,710.67 |
| 207 | 229 | Florida 8th | 1,752.06 | 4,537.84 |
| 206 | 230 | Pennsylvania 17th | 1,733.22 | 4,489.04 |
| 205 | 231 | California 5th | 1,730.82 | 4,482.83 |
| 204 | 232 | Wisconsin 1st | 1,727.92 | 4,475.32 |
| 203 | 233 | Florida 9th | 1,707.49 | 4,422.40 |
| 202 | 234 | California 25th | 1,690.50 | 4,378.40 |
| 201 | 235 | Oklahoma 1st | 1,631.67 | 4,226.03 |
| 200 | 236 | Massachusetts 2nd | 1,628.00 | 4,216.52 |
| 199 | 237 | Illinois 14th | 1,597.60 | 4,137.79 |
| 198 | 238 | South Carolina 1st | 1,547.86 | 4,008.96 |
| 197 | 239 | Pennsylvania 4th | 1,517.84 | 3,931.21 |
| 196 | 240 | Florida 18th | 1,512.55 | 3,917.51 |
| 195 | 241 | Michigan 8th | 1,503.18 | 3,893.24 |
| 194 | 242 | Maryland 5th | 1,481.24 | 3,836.42 |
| 193 | 243 | Texas 12th | 1,441.16 | 3,732.61 |
| 192 | 244 | Virginia 10th | 1,372.24 | 3,554.11 |
| 191 | 245 | Florida 5th | 1,355.03 | 3,509.53 |
| 190 | 246 | New York 18th | 1,353.42 | 3,505.36 |
| 189 | 247 | South Carolina 4th | 1,299.30 | 3,365.19 |
| 188 | 248 | Pennsylvania 15th | 1,285.03 | 3,328.23 |
| 187 | 249 | Louisiana 2nd | 1,268.48 | 3,285.37 |
| 186 | 250 | Tennessee 5th | 1,248.57 | 3,233.80 |
| 185 | 251 | Connecticut 5th | 1,248.16 | 3,232.74 |
| 184 | 252 | California 9th | 1,245.28 | 3,225.28 |
| 183 | 253 | New York 20th | 1,231.28 | 3,189.02 |
| 182 | 254 | Massachusetts 9th | 1,214.74 | 3,146.18 |
| 181 | 255 | Ohio 16th | 1,205.34 | 3,121.83 |
| 180 | 256 | California 22nd | 1,165.12 | 3,017.66 |
| 179 | 257 | Indiana 1st | 1,157.02 | 2,996.68 |
| 178 | 258 | Ohio 10th | 1,129.76 | 2,926.08 |
| 177 | 259 | Florida 10th | 1,129.32 | 2,924.94 |
| 176 | 260 | Illinois 2nd | 1,080.67 | 2,798.94 |
| 175 | 261 | Oregon 3rd | 1,074.46 | 2,782.85 |
| 174 | 262 | Georgia 11th | 1,071.25 | 2,774.54 |
| 173 | 263 | North Carolina 4th | 1,045.35 | 2,707.46 |
| 172 | 264 | Texas 22nd | 1,032.84 | 2,675.06 |
| 171 | 265 | Washington 2nd | 1,015.02 | 2,628.90 |
| 170 | 266 | Pennsylvania 16th | 997.68 | 2,583.99 |
| 169 | 267 | Virginia 2nd | 991.68 | 2,568.45 |
| 168 | 268 | New Jersey 5th | 991.30 | 2,567.47 |
| 167 | 269 | New Jersey 7th | 970.19 | 2,512.79 |
| 166 | 270 | Virginia 3rd | 947.10 | 2,452.99 |
| 165 | 271 | California 26th | 939.12 | 2,432.32 |
| 164 | 272 | California 42nd | 935.96 | 2,424.14 |
| 163 | 273 | California 19th | 915.34 | 2,370.73 |
| 162 | 274 | Texas 26th | 907.15 | 2,349.52 |
| 161 | 275 | New Jersey 3rd | 899.70 | 2,330.23 |
| 160 | 276 | Ohio 13th | 894.30 | 2,316.24 |
| 159 | 277 | Florida 12th | 883.75 | 2,288.91 |
| 158 | 278 | Florida 16th | 875.33 | 2,267.11 |
| 157 | 279 | Pennsylvania 7th | 862.56 | 2,234.03 |
| 156 | 280 | Pennsylvania 6th | 860.47 | 2,228.62 |
| 155 | 281 | Maryland 8th | 859.85 | 2,227.01 |
| 154 | 282 | North Carolina 9th | 856.93 | 2,219.45 |
| 153 | 283 | Washington 10th | 826.67 | 2,141.08 |
| 152 | 284 | Florida 15th | 818.51 | 2,119.94 |
| 151 | 285 | Rhode Island 2nd | 765.32 | 1,982.18 |
| 150 | 286 | Massachusetts 3rd | 757.86 | 1,962.86 |
| 149 | 287 | Kansas 3rd | 757.20 | 1,961.15 |
| 148 | 288 | Florida 19th | 750.37 | 1,943.46 |
| 147 | 289 | Georgia 13th | 714.95 | 1,851.72 |
| 146 | 290 | Texas 16th | 710.35 | 1,839.81 |
| 145 | 291 | Pennsylvania 8th | 706.93 | 1,830.95 |
| 144 | 292 | California 27th | 699.90 | 1,812.74 |
| 143 | 293 | California 18th | 696.12 | 1,802.95 |
| 142 | 294 | New Jersey 4th | 691.88 | 1,791.97 |
| 141 | 295 | Ohio 1st | 686.96 | 1,779.23 |
| 140 | 296 | Connecticut 1st | 675.45 | 1,749.42 |
| 139 | 297 | Massachusetts 4th | 668.27 | 1,730.82 |
| 138 | 298 | New York 1st | 650.02 | 1,683.55 |
| 137 | 299 | Arizona 6th | 625.07 | 1,618.93 |
| 136 | 300 | California 15th | 599.45 | 1,552.58 |
| 135 | 301 | Texas 35th | 593.77 | 1,537.87 |
| 134 | 302 | California 49th | 553.08 | 1,432.48 |
| 133 | 303 | North Carolina 12th | 549.66 | 1,423.62 |
| 132 | 304 | California 7th | 548.65 | 1,421.00 |
| 131 | 305 | Arizona 8th | 539.66 | 1,397.72 |
| 130 | 306 | Minnesota 3rd | 527.05 | 1,365.06 |
| 129 | 307 | Massachusetts 6th | 526.79 | 1,364.39 |
| 128 | 308 | Florida 7th | 513.58 | 1,330.17 |
| 127 | 309 | New York 25th | 510.19 | 1,321.39 |
| 126 | 310 | Nebraska 2nd | 509.74 | 1,320.23 |
| 125 | 311 | New Jersey 11th | 504.97 | 1,307.87 |
| 124 | 312 | Georgia 4th | 496.6 | 1,286.20 |
| 123 | 313 | California 11th | 493.61 | 1,278.45 |
| 122 | 314 | Maryland 7th | 488.03 | 1,264.00 |
| 121 | 315 | Tennessee 9th | 483.39 | 1,251.98 |
| 120 | 316 | Texas 3rd | 480.88 | 1,245.48 |
| 119 | 317 | Colorado 6th | 474.66 | 1,229.37 |
| 118 | 318 | Connecticut 3rd | 470.34 | 1,218.18 |
| 117 | 319 | Missouri 2nd | 465.76 | 1,206.32 |
| 116 | 320 | Ohio 9th | 464.65 | 1,203.44 |
| 115 | 321 | Connecticut 4th | 460.73 | 1,193.29 |
| 114 | 322 | Michigan 11th | 419.26 | 1,085.88 |
| 113 | 323 | New Jersey 12th | 412.23 | 1,067.68 |
| 112 | 324 | Michigan 12th | 403.21 | 1,044.31 |
| 111 | 325 | Georgia 7th | 392.61 | 1,016.86 |
| 110 | 326 | New York 17th | 382.63 | 991.01 |
| 109 | 327 | Illinois 6th | 378.78 | 981.04 |
| 108 | 328 | Texas 30th | 356.27 | 922.74 |
| 107 | 329 | New Jersey 1st | 350.02 | 906.55 |
| 106 | 330 | Maryland 2nd | 348.88 | 903.6 |
| 105 | 331 | Colorado 7th | 342.11 | 886.07 |
| 104 | 332 | Minnesota 4th | 332.49 | 861.15 |
| 103 | 333 | California 45th | 330.39 | 855.71 |
| 102 | 334 | Massachusetts 8th | 326.37 | 845.3 |
| 101 | 335 | Kentucky 3rd | 319.34 | 827.09 |
| 100 | 336 | California 41st | 316.54 | 819.84 |
| 99 | 337 | Texas 2nd | 308.75 | 799.66 |
| 98 | 338 | Maryland 3rd | 304.14 | 787.72 |
| 97 | 339 | Indiana 7th | 303.84 | 786.95 |
| 96 | 340 | Illinois 10th | 299.78 | 776.43 |
| 95 | 341 | Georgia 6th | 298.76 | 773.79 |
| 94 | 342 | Maryland 4th | 297.81 | 771.33 |
| 93 | 343 | Arizona 5th | 293.47 | 760.09 |
| 92 | 344 | California 33rd | 288.58 | 747.42 |
| 91 | 345 | Illinois 11th | 280.95 | 727.66 |
| 90 | 346 | Rhode Island 1st | 268.49 | 695.39 |
| 89 | 347 | California 52nd | 267 | 691.53 |
| 88 | 348 | Florida 14th | 265.4 | 687.39 |
| 87 | 349 | Massachusetts 5th | 265.08 | 686.56 |
| 86 | 350 | Georgia 5th | 264.91 | 686.12 |
| 85 | 351 | Texas 24th | 262.76 | 680.55 |
| 84 | 352 | Florida 21st | 260.97 | 675.91 |
| 83 | 353 | California 14th | 259.5 | 672.11 |
| 82 | 354 | Illinois 1st | 258.38 | 669.2 |
| 81 | 355 | New York 3rd | 254.92 | 660.24 |
| 80 | 356 | Ohio 11th | 244.46 | 633.15 |
| 79 | 357 | Illinois 3rd | 237.18 | 614.3 |
| 78 | 358 | Texas 18th | 235.2 | 609.17 |
| 77 | 359 | Ohio 3rd | 228 | 590.52 |
| 76 | 360 | Missouri 1st | 225.36 | 583.68 |
| 75 | 361 | New York 26th | 219.13 | 567.55 |
| 74 | 362 | California 28th | 218.45 | 565.79 |
| 73 | 363 | California 31st | 218.24 | 565.24 |
| 72 | 364 | California 47th | 216.21 | 559.98 |
| 71 | 365 | New Jersey 6th | 215.55 | 558.28 |
| 70 | 366 | Texas 33rd | 211.94 | 548.93 |
| 69 | 367 | Pennsylvania 14th | 209.29 | 542.06 |
| 68 | 368 | Hawaii 1st | 209.22 | 541.88 |
| 67 | 369 | Florida 27th | 208.84 | 540.9 |
| 66 | 370 | Illinois 8th | 205.52 | 532.3 |
| 65 | 371 | Arizona 7th | 205.12 | 531.26 |
| 64 | 372 | California 39th | 204.4 | 529.4 |
| 63 | 373 | Texas 20th | 199.68 | 517.17 |
| 62 | 374 | Colorado 1st | 189.62 | 491.12 |
| 61 | 375 | Texas 29th | 187.07 | 484.51 |
| 60 | 376 | Florida 13th | 186.03 | 481.82 |
| 59 | 377 | Michigan 14th | 185.73 | 481.04 |
| 58 | 378 | Texas 32nd | 185.66 | 480.86 |
| 57 | 379 | Virginia 11th | 185.09 | 479.38 |
| 56 | 380 | California 17th | 184.85 | 478.76 |
| 55 | 381 | Michigan 13th | 184.85 | 478.76 |
| 54 | 382 | Michigan 9th | 183.59 | 475.5 |
| 53 | 383 | Washington 9th | 183.43 | 475.08 |
| 52 | 384 | New York 2nd | 182.01 | 471.41 |
| 51 | 385 | California 6th | 175.04 | 453.35 |
| 50 | 386 | Florida 22nd | 172.88 | 447.76 |
| 49 | 387 | Florida 23rd | 169.1 | 437.97 |
| 48 | 388 | California 35th | 168.88 | 437.4 |
| 47 | 389 | Texas 9th | 165.64 | 429.01 |
| 46 | 390 | Arizona 9th | 164.79 | 426.81 |
| 45 | 391 | Texas 7th | 161.94 | 419.43 |
| 44 | 392 | Pennsylvania 13th | 155.18 | 401.92 |
| 43 | 393 | Virginia 8th | 149.24 | 386.53 |
| 42 | 394 | California 48th | 145.47 | 376.77 |
| 41 | 395 | Washington 7th | 144.13 | 373.3 |
| 40 | 396 | California 30th | 135.94 | 352.08 |
| 39 | 397 | Minnesota 5th | 135.66 | 351.36 |
| 38 | 398 | California 53rd | 135.43 | 350.76 |
| 37 | 399 | Wisconsin 4th | 128.35 | 332.43 |
| 36 | 400 | California 32nd | 124.23 | 321.76 |
| 35 | 401 | New York 4th | 110.85 | 287.1 |
| 34 | 402 | Florida 24th | 106.08 | 274.75 |
| 33 | 403 | Illinois 9th | 91.85 | 237.89 |
| 32 | 404 | Nevada 1st | 104.5 | 270.66 |
| 31 | 405 | California 38th | 101.46 | 262.78 |
| 30 | 406 | California 13th | 96.79 | 250.69 |
| 29 | 407 | Illinois 5th | 95.71 | 247.89 |
| 28 | 408 | New Jersey 9th | 95.34 | 246.93 |
| 27 | 409 | California 29th | 66.27 | 171.64 |
| 26 | 410 | California 44th | 66.00 | 170.94 |
| 25 | 411 | New York 16th | 78.37 | 202.98 |
| 24 | 412 | Pennsylvania 1st | 77.91 | 201.79 |
| 23 | 413 | New Jersey 10th | 75.92 | 196.63 |
| 22 | 414 | Pennsylvania 2nd | 74.14 | 192.02 |
| 21 | 415 | California 43rd | 72.03 | 186.56 |
| 20 | 416 | California 46th | 71.72 | 185.75 |
| 19 | 417 | New York 11th | 65.83 | 170.5 |
| 18 | 418 | Massachusetts 7th | 62.67 | 162.32 |
| 17 | 419 | Illinois 7th | 62.52 | 161.93 |
| — | — | District of Columbia At-large | 61.40 | 159.03 |
| 16 | 420 | California 40th | 57.69 | 149.42 |
| 15 | 421 | California 37th | 55.26 | 143.12 |
| 14 | 422 | New Jersey 8th | 54.69 | 141.65 |
| 13 | 423 | Illinois 4th | 52.45 | 135.85 |
| 12 | 424 | New York 5th | 51.88 | 134.37 |
| 11 | 425 | California 34th | 47.66 | 123.44 |
| 10 | 426 | California 12th | 38.97 | 100.93 |
| 9 | 427 | New York 6th | 29.78 | 77.13 |
| 8 | 428 | New York 8th | 29.66 | 76.82 |
| 7 | 429 | New York 14th | 28.29 | 73.27 |
| 6 | 430 | New York 7th | 16.16 | 41.85 |
| 5 | 431 | New York 9th | 15.54 | 40.25 |
| 4 | 432 | New York 12th | 14.79 | 38.31 |
| 3 | 433 | New York 15th | 14.54 | 37.66 |
| 2 | 434 | New York 10th | 14.25 | 36.91 |
| 1 | 435 | New York 13th | 10.25 | 26.55 |
See also
| This article is part of a series on the |
| Politics of the United States of America |
|---|
 |
|
Legislature
|
- Representation
- United States Census Bureau
- Better Know A District - A recurring segment on The Colbert Report, in which Stephen Colbert profiled a congressional district and interviewed its Representative. Described by Colbert as a "435-part series".
Comparisons
- Constituency
- Australia
- Canada
- European Parliament
- Ireland
- Singapore: Group Representation Constituency, Non-Constituency Member of Parliament
- United Kingdom
References
- 1 2 3 4 "Congressional Apportionment: 2010 Census Briefs" (PDF). census.gov. United States Census Bureau. November 2011. Retrieved February 2, 2014.
- ↑ "Rhode Island congressional districts by urban and rural population and land area". United States Census Bureau. Retrieved December 11, 2014.
- ↑ United States Census Bureau. "Congressional Districts by Land Area (National)" (ASCII text). Retrieved November 11, 2006.
- 1 2 3 4 Maine used to be part of Massachusetts. After the 1810 census, Massachusetts was allocated 20 districts. Seven districts (numbers 14 through 20) were credited to Maine soon after it became a state in 1820.
- ↑ https://www.census.gov/geo/maps-data/data/cd_state.html
- "United States Census 2010". U.S. Census Bureau. Retrieved October 25, 2013.
- Martis, Kenneth C. (1989). The Historical Atlas of Political Parties in the United States Congress, 1789–1989. Macmillan Publishing. ISBN 0029201705.
External links
| Wikimedia Commons has media related to Congressional district maps of the United States. |
- Find a Senator or Representative via Govtrack.us
- United States Census Bureau:
- National Atlas Printable District Maps
- Jeffrey B. Lewis; et al. (2013). "Digital Boundary Definitions of United States Congressional Districts, 1789–2012". University of California, Los Angeles.