California's 41st congressional district
| California's 41st congressional district | ||
|---|---|---|
.tif.png) | ||
| Current Representative | Mark Takano (D–Riverside) | |
| Ethnicity | 26.1% White, 9.5% Black, 5.9% Asian, 55.9% Hispanic, 2.6[1]% other | |
| Cook PVI | D+9 | |
California's 41st congressional district is a congressional district in western Riverside County, in the U.S. state of California.
The district is currently represented by Democrat Mark Takano. It includes the cities of Moreno Valley, Perris, and Riverside, located in the Inland Empire region of Southern California.
Historic boundaries
San Diego County's 41st
In the 1980s, the 41st Congressional District was one of four that divided San Diego County, formerly located in the North County region. The district had been held for 12 years by Republican Bill Lowery and was considered the most Republican district in the San Diego area. The 41st District was renumbered as California's 51st Congressional District after the 1990 U.S. Census in which it became the Inland Empire's 41st.
San Bernardino County's 41st
From 2003 to 2013 the district included large portions of the cavernous San Bernardino County and a small portion of Riverside County. The district formerly represented parts of the Inland Empire region, San Bernardino Mountains, and Mojave Desert, stretching from portions of the city of San Bernardino north to the Nevada border and east to the Colorado River. Redlands was the largest city in that district; other cities included: Loma Linda, Yucaipa, Victorville, Barstow, Hesperia, Highland, Big Bear Lake and Needles.
List of representatives
| Representative | Party | Dates | Notes | Counties |
|---|---|---|---|---|
| District created | January 3, 1973 | |||
 Lionel Van Deerlin Lionel Van Deerlin |
Democratic | January 3, 1973 – January 3, 1975 | Redistricted from the 37th district Redistricted to the 42nd district |
San Diego (southern City of San Diego) |
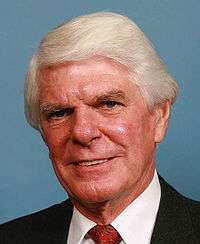
.jpg) Bob Wilson Bob Wilson |
Republican | January 3, 1975 – January 3, 1981 | Redistricted to the 40th district Retired |
San Diego (San Diego City northern half) |
 Bill Lowery Bill Lowery |
Republican | January 3, 1981 – January 3, 1983 | ||
| January 3, 1983 – January 3, 1993 | Retired | San Diego (northern suburbs) | ||
 Jay Kim Jay Kim |
Republican | January 3, 1993 – January 3, 1999 | Lost re-nomination | Southeastern Los Angeles, northeastern Orange, southwestern San Bernardino |
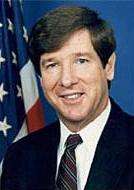
 Gary Miller Gary Miller |
Republican | January 3, 1999 – January 3, 2003 | Redistricted to the 42nd district | |
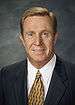
 Jerry Lewis Jerry Lewis |
Republican | January 3, 2003 – January 3, 2013 | Redistricted from the 40th district Retired |
San Bernardino |
 Mark Takano Mark Takano |
Democratic | January 3, 2013 – present | Inland Empire (Moreno Valley, Perris, and Riverside) | |
Voting
| Election results from statewide races | ||
|---|---|---|
| Year | Office | Results |
| 2012 | President | Obama 61.5 - 36.3% |
| Senator | ||
| 2010 | Governor | Whitman 53.2 - 38.2% |
| Senator | Fiorina 57.3 - 34.8% | |
| 2008 | President[2] | McCain 54.2 - 43.7% |
| 2006 | Governor[3] | Schwarzenegger 68.6 - 26.6% |
| Senator[4] | Mountjoy 50.8 - 43.5% | |
| 2004 | President[5] | Bush 61.8 - 36.9% |
| Senator[6] | Jones 51.8 - 43.5% | |
| 2003 | Recall[7][8] | Yes 73.6 - 26.4% |
| Schwarzenegger 64.0 - 17.1% | ||
| 2002 | Governor[9] | Simon 55.5 - 35.5% |
| 2000 | President[10] | Bush 50.2 - 46.5% |
| Senator[11] | Feinstein 48.3 - 44.8% | |
| 1998 | Governor | |
| Senator | ||
| 1996 | President | |
| 1994 | Governor | |
| Senator | ||
| 1992 | President | Bush 42.7 - 35.0% |
| Senator | Herschensohn 55.7 - 34.8% | |
| Senator | Seymour 48.5 - 42.8% | |
Election results
|
1972 • 1974 • 1976 • 1978 • 1980 • 1982 • 1984 • 1986 • 1988 • 1990 • 1992 • 1994 • 1996 • 1998 • 2000 • 2002 • 2004 • 2006 • 2008 • 2010 • 2012 • 2014 |
1972
| Party | Candidate | Votes | % | |
|---|---|---|---|---|
| Democratic | Lionel Van Deerlin (inc.) | 115,634 | 74.1 | |
| Republican | D. Richard "Dick" Kau | 40,514 | 25.9 | |
| Total votes | 156,148 | 100.0 | ||
| Voter turnout | % | |||
| Democratic hold | ||||
1974
| Party | Candidate | Votes | % | |
|---|---|---|---|---|
| Republican | Bob Wilson (incumbent) | 93,461 | 54.5 | |
| Democratic | Colleen Marie O'Connor | 73,954 | 43.0 | |
| American Independent | Robert W. Franson | 4,312 | 2.5 | |
| Total votes | 171,727 | 100.0 | ||
| Voter turnout | % | |||
| Republican hold | ||||
1976
| Party | Candidate | Votes | % | |
|---|---|---|---|---|
| Republican | Bob Wilson (incumbent) | 128,784 | 57.7 | |
| Democratic | King Golden, Jr. | 94,590 | 42.3 | |
| Total votes | 223,374 | 100.0 | ||
| Voter turnout | % | |||
| Republican hold | ||||
1978
| Party | Candidate | Votes | % | |
|---|---|---|---|---|
| Republican | Bob Wilson (incumbent) | 107,685 | 58.1 | |
| Democratic | King Golden, Jr. | 77,540 | 41.9 | |
| Total votes | 185,225 | 100.0 | ||
| Voter turnout | % | |||
| Republican hold | ||||
1980
| Party | Candidate | Votes | % | |
|---|---|---|---|---|
| Republican | Bill Lowery | 123,187 | 52.7 | |
| Democratic | Bob Wilson | 101,101 | 43.2 | |
| Libertarian | Joseph D. Alldredge | 9,630 | 4.1 | |
| Total votes | 233,918 | 100.0 | ||
| Voter turnout | % | |||
| Republican hold | ||||
1982
| Party | Candidate | Votes | % | |
|---|---|---|---|---|
| Republican | Bill Lowery (incumbent) | 140,130 | 68.9 | |
| Democratic | Tony Brandenburg | 58,677 | 28.8 | |
| Libertarian | Everett Hale | 4,654 | 2.3 | |
| Total votes | 203,461 | 100.0 | ||
| Voter turnout | % | |||
| Republican hold | ||||
1984
| Party | Candidate | Votes | % | |
|---|---|---|---|---|
| Republican | Bill Lowery (incumbent) | 161,068 | 63.5 | |
| Democratic | Bob Simmons | 85,475 | 33.7 | |
| Libertarian | Sara Baase | 7,303 | 2.9 | |
| Total votes | 253,846 | 100.0 | ||
| Voter turnout | % | |||
| Republican hold | ||||
1986
| Party | Candidate | Votes | % | |
|---|---|---|---|---|
| Republican | Bill Lowery (incumbent) | 133,566 | 67.8 | |
| Democratic | Daniel F. "Dan" Kripke | 59,816 | 30.4 | |
| Libertarian | Richard "Dick" Rider | 3,541 | 1.8 | |
| Total votes | 196,923 | 100.0 | ||
| Voter turnout | % | |||
| Republican hold | ||||
1988
| Party | Candidate | Votes | % | |
|---|---|---|---|---|
| Republican | Bill Lowery (incumbent) | 187,380 | 64.8 | |
| Democratic | Daniel F. "Dan" Kripke | 88,192 | 31.5 | |
| Libertarian | Richard "Dick" Rider | 5,336 | 1.9 | |
| Peace and Freedom | C. T. Weber | 4,853 | 1.7 | |
| Total votes | 285,761 | 100.0 | ||
| Voter turnout | % | |||
| Republican hold | ||||
1990
| Party | Candidate | Votes | % | |
|---|---|---|---|---|
| Republican | Bill Lowery (incumbent) | 105,723 | 49.2 | |
| Democratic | Daniel F. "Dan" Kripke | 93,586 | 43.6 | |
| Peace and Freedom | Karen S.R. Works | 15,428 | 7.2 | |
| Total votes | 214,737 | 100.0 | ||
| Voter turnout | % | |||
| Republican hold | ||||
1992
| Party | Candidate | Votes | % | ||
|---|---|---|---|---|---|
| Republican | Jay Kim | 101,753 | 59.6 | ||
| Democratic | Bob Baker | 58,777 | 34.4 | ||
| Peace and Freedom | James Michael "Mike" Noonan | 10,136 | 5.9 | ||
| Total votes | 170,666 | 100.0 | |||
| Voter turnout | % | ||||
| Republican win (new seat) | |||||
1994
| Party | Candidate | Votes | % | |
|---|---|---|---|---|
| Republican | Jay Kim (incumbent) | 82,100 | 62.13 | |
| Democratic | Ed Tessier | 50,043 | 37.87 | |
| Total votes | 132,143 | 100.0 | ||
| Voter turnout | % | |||
| Republican hold | ||||
1996
| Party | Candidate | Votes | % | |
|---|---|---|---|---|
| Republican | Jay Kim (incumbent) | 83,934 | 58.5 | |
| Democratic | Richard Waldron | 47,346 | 33.0 | |
| Libertarian | Richard Newhouse | 7,135 | 5.0 | |
| Natural Law | David Kramer | 5,030 | 3.5 | |
| Republican | Marjorie Mikels (write-in) | 120 | 0.0 | |
| Total votes | 143,565 | 100.0 | ||
| Voter turnout | % | |||
| Republican hold | ||||
1998
| Party | Candidate | Votes | % | |
|---|---|---|---|---|
| Republican | Gary Miller | 68,310 | 53.20 | |
| Democratic | Eileen R. Ansari | 52,264 | 40.70 | |
| Green | Cynthia Allaire | 3,597 | 2.80 | |
| Libertarian | Kenneth E. Valentine | 2,529 | 1.97 | |
| Natural Law | David F. Kramer | 1,714 | 1.33 | |
| Total votes | 128,414 | 100.0 | ||
| Voter turnout | % | |||
| Republican hold | ||||
2000
| Party | Candidate | Votes | % | |
|---|---|---|---|---|
| Republican | Gary Miller (incumbent) | 104,695 | 59.0 | |
| Democratic | Rodolfo G. Favila | 66,361 | 37.4 | |
| Natural Law | David Kramer | 6,607 | 3.6 | |
| Total votes | 177,616 | 100.0 | ||
| Voter turnout | % | |||
| Republican hold | ||||
2002
| Party | Candidate | Votes | % | |
|---|---|---|---|---|
| Republican | Jerry Lewis (incumbent) | 91,326 | 67.4 | |
| Democratic | Keith A. Johnson | 40,155 | 29.7 | |
| Libertarian | Kevin Craig | 4,052 | 2.9 | |
| Total votes | 135,533 | 100.0 | ||
| Voter turnout | % | |||
| Republican hold | ||||
2004
| Party | Candidate | Votes | % | |
|---|---|---|---|---|
| Republican | Jerry Lewis (incumbent) | 181,605 | 83.0 | |
| Libertarian | Peymon Mottahedek | 37,332 | 17.0 | |
| Total votes | 218,937 | 100.0 | ||
| Voter turnout | % | |||
| Republican hold | ||||
2006
| Party | Candidate | Votes | % | |
|---|---|---|---|---|
| Republican | Jerry Lewis (incumbent) | 109,761 | 67.0 | |
| Democratic | Louie A. Contreras | 54,235 | 33.0 | |
| No party | Carol Petersen (write-in) | 48 | 0.0% | |
| Total votes | 164,044 | 100.0 | ||
| Voter turnout | % | |||
| Republican hold | ||||
2008
| Party | Candidate | Votes | % | |
|---|---|---|---|---|
| Republican | Jerry Lewis (incumbent) | 159,486 | 61.65 | |
| Democratic | Tim Prince | 99,214 | 38.35 | |
| Total votes | 258,700 | 100.00 | ||
| Voter turnout | % | |||
| Republican hold | ||||
2010
| Party | Candidate | Votes | % | |
|---|---|---|---|---|
| Republican | Jerry Lewis (incumbent) | 127,857 | 63% | |
| Democratic | Pat Meagher | 74,394 | 37% | |
| Total votes | 202,251 | 100% | ||
| Voter turnout | % | |||
| Republican hold | ||||
2012
| Party | Candidate | Votes | % | ||
|---|---|---|---|---|---|
| Democratic | Mark Takano | 103,578 | 59% | ||
| Republican | John Tavaglione | 72,074 | 41% | ||
| Total votes | 175,652 | 100% | |||
| Voter turnout | % | ||||
| Democratic win (new seat) | |||||
2014
| Party | Candidate | Votes | % | |
|---|---|---|---|---|
| Democratic | Mark Takano | 46,948 | 57% | |
| Republican | Steve Adams | 35,936 | 43% | |
| Total votes | 82,884 | 100% | ||
| Voter turnout | % | |||
| Democratic hold | ||||
Living former Members
As of April 2015, there are four former members of the U.S. House of Representatives from California's 41st congressional district that are currently living.
| Representative | Term in office | Date of birth (and age) |
|---|---|---|
| Bill Lowery | 1981 - 1993 | May 2, 1947 |
| Jay Kim | 1993 - 1999 | March 27, 1939 |
| Gary Miller | 1999 - 2003 | October 16, 1948 |
| Jerry Lewis | 2003 - 2013 | October 21, 1934 |
Historical district boundaries

See also
References
- ↑ http://www.latimes.com/la-redistricting-map-july-2011,0,5339409.htmlstory#39.71057374407184,-118.14590136718749,5,usCongress,,,current
- ↑ (2008 President)
- ↑ Statement of Vote (2006 Governor)
- ↑ Statement of Vote (2006 Senator)
- ↑ Statement of Vote (2004 President)
- ↑ Statement of Vote (2004 Senator)
- ↑ Statement of Vote (2003 Recall Question)
- ↑ Statement of Vote (2003 Governor)
- ↑ Statement of Vote (2002 Governor)
- ↑ Statement of Vote (2000 President)
- ↑ Statement of Vote (2000 Senator)
- ↑ 1972 election results
- ↑ 1974 election results
- ↑ 1976 election results
- ↑ 1978 election results
- ↑ 1980 election results
- ↑ 1982 election results
- ↑ 1984 election results
- ↑ 1986 election results
- ↑ 1988 election results
- ↑ 1990 election results
- ↑ 1992 election results
- ↑ 1994 election results
- ↑ 1996 election results
- ↑ 1998 election results
- ↑ 2000 election results
- ↑ 2002 general election results Archived February 3, 2009, at the Wayback Machine.
- ↑ 2004 general election results
- ↑ 2006 general election results Archived November 27, 2008, at the Wayback Machine.
- ↑ 2008 general election results
- ↑ 2010 general election results
- ↑ 2012 general election results Archived October 19, 2013, at the Wayback Machine.
- ↑ 2014 general election results
External links
- GovTrack.us: California's 41st congressional district
- RAND California Election Returns: District Definitions
- California Voter Foundation map - CD41
Coordinates: 34°36′N 116°00′W / 34.6°N 116°W