Chippis
| Chippis | ||
|---|---|---|
|
Chippis village | ||
| ||
 Chippis | ||
|
Location of Chippis 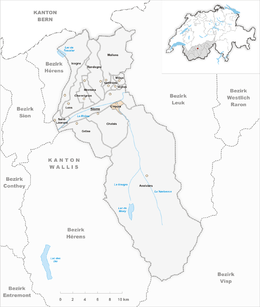 | ||
| Coordinates: 46°17′N 7°32′E / 46.283°N 7.533°ECoordinates: 46°17′N 7°32′E / 46.283°N 7.533°E | ||
| Country | Switzerland | |
| Canton | Valais | |
| District | Sierre | |
| Government | ||
| • Mayor | Christian Zufferey | |
| Area[1] | ||
| • Total | 1.98 km2 (0.76 sq mi) | |
| Elevation | 532 m (1,745 ft) | |
| Population (Dec 2015[2]) | ||
| • Total | 1,632 | |
| • Density | 820/km2 (2,100/sq mi) | |
| Postal code | 3965 | |
| SFOS number | 6235 | |
| Surrounded by | Chalais, Anniviers, Sierre | |
| Website |
www SFSO statistics | |


Chippis is a municipality in the district of Sierre in the canton of Valais in Switzerland.
History
Chippis is first mentioned in the 11th century as Sepils.[3]
Geography
Chippis has an area, as of 2009, of 2 square kilometers (0.77 sq mi). Of this area, 0.11 km2 (0.042 sq mi) or 5.6% is used for agricultural purposes, while 1.17 km2 (0.45 sq mi) or 59.1% is forested. Of the rest of the land, 0.48 km2 (0.19 sq mi) or 24.2% is settled (buildings or roads), 0.07 km2 (17 acres) or 3.5% is either rivers or lakes and 0.17 km2 (0.066 sq mi) or 8.6% is unproductive land.[4]
Of the built up area, industrial buildings made up 6.6% of the total area while housing and buildings made up 10.1% and transportation infrastructure made up 4.5%. Power and water infrastructure as well as other special developed areas made up 1.5% of the area while parks, green belts and sports fields made up 1.5%. Out of the forested land, 57.6% of the total land area is heavily forested and 1.5% is covered with orchards or small clusters of trees. Of the agricultural land, 0.0% is used for growing crops and 3.5% is pastures, while 2.0% is used for orchards or vine crops. All the water in the municipality is flowing water. Of the unproductive areas, 3.0% is unproductive vegetation and 5.6% is too rocky for vegetation.[4]
The municipality is located in the Sierre district, on the left bank of the Rhone river.
Coat of arms
The blazon of the municipal coat of arms is Per fess by a bar wavy Argent chief per pale by a pallet wavy of the same, Gules a Cog-wheel of the first, Azure a church of the first and Gules three Mullets of Five of the first.[5]
Demographics
Chippis has a population (as of December 2015) of 1,632.[2] As of 2008, 38.3% of the population are resident foreign nationals.[6] Over the last 10 years (2000–2010 ) the population has changed at a rate of 2.6%. It has changed at a rate of -0.8% due to migration and at a rate of 2.1% due to births and deaths.[7]
Most of the population (as of 2000) speaks French (1,156 or 77.5%) as their first language, German is the second most common (107 or 7.2%) and Italian is the third (91 or 6.1%). There is 1 person who speaks Romansh.[8]
As of 2008, the population was 51.8% male and 48.2% female. The population was made up of 462 Swiss men (29.2% of the population) and 357 (22.6%) non-Swiss men. There were 486 Swiss women (30.8%) and 275 (17.4%) non-Swiss women.[9] Of the population in the municipality, 512 or about 34.3% were born in Chippis and lived there in 2000. There were 465 or 31.2% who were born in the same canton, while 91 or 6.1% were born somewhere else in Switzerland, and 376 or 25.2% were born outside of Switzerland.[8]
As of 2000, children and teenagers (0–19 years old) make up 25.5% of the population, while adults (20–64 years old) make up 59.4% and seniors (over 64 years old) make up 15.1%.[7]
As of 2000, there were 587 people who were single and never married in the municipality. There were 742 married individuals, 83 widows or widowers and 79 individuals who are divorced.[8]
As of 2000, there were 576 private households in the municipality, and an average of 2.5 persons per household.[7] There were 158 households that consist of only one person and 51 households with five or more people. In 2000, a total of 557 apartments (89.4% of the total) were permanently occupied, while 44 apartments (7.1%) were seasonally occupied and 22 apartments (3.5%) were empty.[10] The vacancy rate for the municipality, in 2010, was 0.61%.[7]
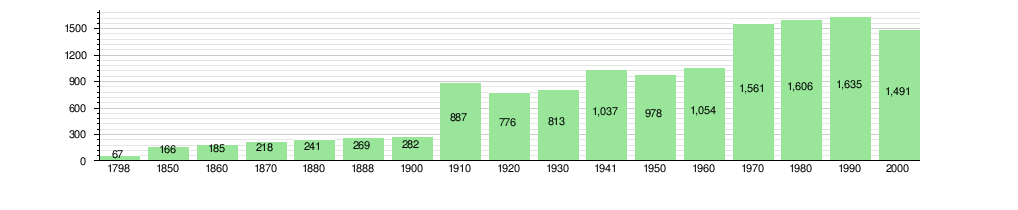
The historical population is given in the following chart:[3][11]
Politics
In the 2007 federal election the most popular party was the CVP which received 31.08% of the vote. The next three most popular parties were the SP (27.89%), the FDP (18.31%) and the SVP (13.19%). In the federal election, a total of 533 votes were cast, and the voter turnout was 65.3%.[12]
In the 2009 Conseil d'Etat/Staatsrat election a total of 528 votes were cast, of which 33 or about 6.3% were invalid. The voter participation was 66.6%, which is much more than the cantonal average of 54.67%.[13] In the 2007 Swiss Council of States election a total of 521 votes were cast, of which 27 or about 5.2% were invalid. The voter participation was 65.3%, which is much more than the cantonal average of 59.88%.[14]
Economy
As of 2010, Chippis had an unemployment rate of 5%. As of 2008, there were 46 people employed in the primary economic sector and about 16 businesses involved in this sector. 399 people were employed in the secondary sector and there were 17 businesses in this sector. 118 people were employed in the tertiary sector, with 33 businesses in this sector.[7] There were 713 residents of the municipality who were employed in some capacity, of which females made up 42.9% of the workforce.
In 2008 the total number of full-time equivalent jobs was 509. The number of jobs in the primary sector was 29, all of which were in agriculture. The number of jobs in the secondary sector was 389 of which 290 or (74.6%) were in manufacturing and 54 (13.9%) were in construction. The number of jobs in the tertiary sector was 91. In the tertiary sector; 23 or 25.3% were in wholesale or retail sales or the repair of motor vehicles, 9 or 9.9% were in the movement and storage of goods, 20 or 22.0% were in a hotel or restaurant, 1 was the insurance or financial industry, 3 or 3.3% were technical professionals or scientists, 11 or 12.1% were in education.[15]
In 2000, there were 884 workers who commuted into the municipality and 504 workers who commuted away. The municipality is a net importer of workers, with about 1.8 workers entering the municipality for every one leaving.[16] Of the working population, 9.4% used public transportation to get to work, and 64.2% used a private car.[7]
Religion
From the 2000 census, 1,182 or 79.3% were Roman Catholic, while 50 or 3.4% belonged to the Swiss Reformed Church. Of the rest of the population, there were 61 members of an Orthodox church (or about 4.09% of the population), and there were 2 individuals (or about 0.13% of the population) who belonged to another Christian church. There was 1 individual who was Jewish, and 65 (or about 4.36% of the population) who were Islamic. There were 1 individual who belonged to another church. 50 (or about 3.35% of the population) belonged to no church, are agnostic or atheist, and 79 individuals (or about 5.30% of the population) did not answer the question.[8]
Education
In Chippis about 448 or (30.0%) of the population have completed non-mandatory upper secondary education, and 86 or (5.8%) have completed additional higher education (either university or a Fachhochschule). Of the 86 who completed tertiary schooling, 59.3% were Swiss men, 27.9% were Swiss women, 9.3% were non-Swiss men.[8]
As of 2000, there were 17 students in Chippis who came from another municipality, while 114 residents attended schools outside the municipality.[16]
References
- ↑ Arealstatistik Standard - Gemeindedaten nach 4 Hauptbereichen
- 1 2 Swiss Federal Statistical Office - STAT-TAB, online database – Ständige und nichtständige Wohnbevölkerung nach institutionellen Gliederungen, Geburtsort und Staatsangehörigkeit (German) accessed 30 August 2016
- 1 2 Chippis in German, French and Italian in the online Historical Dictionary of Switzerland.
- 1 2 Swiss Federal Statistical Office-Land Use Statistics 2009 data (German) accessed 25 March 2010
- ↑ Flags of the World.com accessed 23-September-2011
- ↑ Swiss Federal Statistical Office - Superweb database - Gemeinde Statistics 1981-2008 Archived June 28, 2010, at the Wayback Machine. (German) accessed 19 June 2010
- 1 2 3 4 5 6 Swiss Federal Statistical Office Archived January 5, 2016, at the Wayback Machine. accessed 23-September-2011
- 1 2 3 4 5 STAT-TAB Datenwürfel für Thema 40.3 - 2000 Archived April 9, 2014, at the Wayback Machine. (German) accessed 2 February 2011
- ↑ Ständige Wohnbevolkerung nach Geschlecht und Heimat am 31.12.2009.xls (German) (French) accessed 24 August 2011
- ↑ Swiss Federal Statistical Office STAT-TAB - Datenwürfel für Thema 09.2 - Gebäude und Wohnungen Archived September 7, 2014, at the Wayback Machine. (German) accessed 28 January 2011
- ↑ Swiss Federal Statistical Office STAT-TAB Bevölkerungsentwicklung nach Region, 1850-2000 Archived September 30, 2014, at the Wayback Machine. (German) accessed 29 January 2011
- ↑ Swiss Federal Statistical Office, Nationalratswahlen 2007: Stärke der Parteien und Wahlbeteiligung, nach Gemeinden/Bezirk/Canton Archived May 14, 2015, at the Wayback Machine. (German) accessed 28 May 2010
- ↑ Staatsratswahlen vom 1. März 2009 (German) accessed 24 August 2011
- ↑ Ständeratswahl 2007 (German) accessed 24 August 2011
- ↑ Swiss Federal Statistical Office STAT-TAB Betriebszählung: Arbeitsstätten nach Gemeinde und NOGA 2008 (Abschnitte), Sektoren 1-3 Archived December 25, 2014, at the Wayback Machine. (German) accessed 28 January 2011
- 1 2 Swiss Federal Statistical Office - Statweb (German) accessed 24 June 2010
External links
| Wikimedia Commons has media related to Chippis. |
- Official website (French)
- Chippis in German, French and Italian in the online Historical Dictionary of Switzerland.