Corcelles-sur-Chavornay
| Corcelles-sur-Chavornay | ||
|---|---|---|
|
Village church in Corcelles-sur-Chavornay | ||
| ||
 Corcelles-sur-Chavornay | ||
|
Location of Corcelles-sur-Chavornay  | ||
| Coordinates: 46°42′N 06°36′E / 46.700°N 6.600°ECoordinates: 46°42′N 06°36′E / 46.700°N 6.600°E | ||
| Country | Switzerland | |
| Canton | Vaud | |
| District | Jura-Nord Vaudois | |
| Government | ||
| • Mayor |
Syndic Heinz Gass | |
| Area[1] | ||
| • Total | 5.48 km2 (2.12 sq mi) | |
| Elevation | 560 m (1,840 ft) | |
| Population (Dec 2015[2]) | ||
| • Total | 353 | |
| • Density | 64/km2 (170/sq mi) | |
| Demonym(s) | Les Hirondelles | |
| Postal code | 1374 | |
| SFOS number | 5751 | |
| Surrounded by | Suchy, Essertines-sur-Yverdon, Vuarrens, Penthéréaz, Chavornay | |
| Website |
www Profile (French), SFSO statistics | |


Corcelles-sur-Chavornay is a municipality in the district of Jura-Nord Vaudois in the canton of Vaud in Switzerland.
History
Corcelles-sur-Chavornay is first mentioned in 885 as Corceles.[3]
Geography
Corcelles-sur-Chavornay has an area, as of 2009, of 5.5 square kilometers (2.1 sq mi). Of this area, 3.6 km2 (1.4 sq mi) or 65.7% is used for agricultural purposes, while 1.6 km2 (0.62 sq mi) or 29.2% is forested. Of the rest of the land, 0.25 km2 (0.097 sq mi) or 4.6% is settled (buildings or roads), 0.01 km2 (2.5 acres) or 0.2% is either rivers or lakes.[4]
Of the built up area, housing and buildings made up 2.6% and transportation infrastructure made up 1.8%. Out of the forested land, all of the forested land area is covered with heavy forests. Of the agricultural land, 53.6% is used for growing crops and 9.1% is pastures, while 2.9% is used for orchards or vine crops. All the water in the municipality is flowing water.[4]
The municipality was part of the Orbe District until it was dissolved on 31 August 2006, and Corcelles-sur-Chavornay became part of the new district of Jura-Nord Vaudois.[5]
The municipality is located east of the Orbe river, above the Orbe valley.
Coat of arms
The blazon of the municipal coat of arms is Or, five swallows two, two and one Sable.[6]
Demographics
Corcelles-sur-Chavornay has a population (as of December 2015) of 353.[7] As of 2008, 10.9% of the population are resident foreign nationals.[8] Over the last 10 years (1999–2009 ) the population has changed at a rate of 4.8%. It has changed at a rate of 6.1% due to migration and at a rate of -1.6% due to births and deaths.[9]
Most of the population (as of 2000) speaks French (283 or 92.8%), with German being second most common (15 or 4.9%) and Spanish being third (3 or 1.0%). There is 1 person who speaks Italian.[10]
The age distribution, as of 2009, in Corcelles-sur-Chavornay is; 35 children or 10.8% of the population are between 0 and 9 years old and 49 teenagers or 15.1% are between 10 and 19. Of the adult population, 37 people or 11.4% of the population are between 20 and 29 years old. 41 people or 12.6% are between 30 and 39, 52 people or 16.0% are between 40 and 49, and 43 people or 13.2% are between 50 and 59. The senior population distribution is 30 people or 9.2% of the population are between 60 and 69 years old, 22 people or 6.8% are between 70 and 79, there are 15 people or 4.6% who are between 80 and 89, and there is 1 person who is 90 and older.[11]
As of 2000, there were 135 people who were single and never married in the municipality. There were 144 married individuals, 12 widows or widowers and 14 individuals who are divorced.[10]
As of 2000, there were 110 private households in the municipality, and an average of 2.6 persons per household.[9] There were 24 households that consist of only one person and 9 households with five or more people. Out of a total of 116 households that answered this question, 20.7% were households made up of just one person and there was 1 adult who lived with their parents. Of the rest of the households, there are 34 married couples without children, 39 married couples with children There were 6 single parents with a child or children. There were 6 households that were made up of unrelated people and 6 households that were made up of some sort of institution or another collective housing.[10]
In 2000 there were 38 single family homes (or 48.7% of the total) out of a total of 78 inhabited buildings. There were 13 multi-family buildings (16.7%), along with 22 multi-purpose buildings that were mostly used for housing (28.2%) and 5 other use buildings (commercial or industrial) that also had some housing (6.4%).[12]
In 2000, a total of 108 apartments (86.4% of the total) were permanently occupied, while 16 apartments (12.8%) were seasonally occupied and one apartment was empty.[12] As of 2009, the construction rate of new housing units was 0 new units per 1000 residents.[9] The vacancy rate for the municipality, in 2010, was 2.27%.[9]
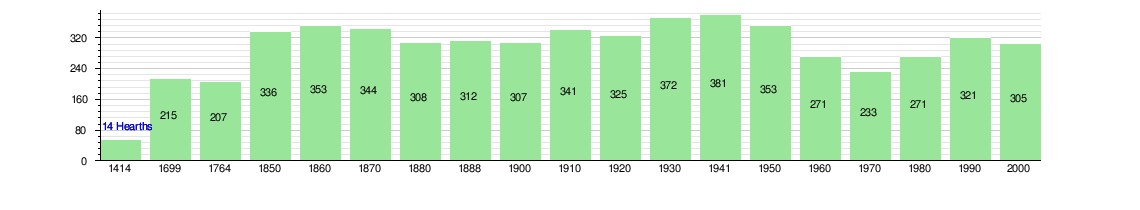
The historical population is given in the following chart:[3][13]
Politics
In the 2007 federal election the most popular party was the SVP which received 22.18% of the vote. The next three most popular parties were the SP (21.16%), the Green Party (20.13%) and the PdA Party (13.2%). In the federal election, a total of 93 votes were cast, and the voter turnout was 44.9%.[14]
Economy
As of 2010, Corcelles-sur-Chavornay had an unemployment rate of 4.1%. As of 2008, there were 40 people employed in the primary economic sector and about 12 businesses involved in this sector. No one was employed in the secondary sector. 39 people were employed in the tertiary sector, with 11 businesses in this sector.[9] There were 148 residents of the municipality who were employed in some capacity, of which females made up 48.6% of the workforce.
In 2008 the total number of full-time equivalent jobs was 61. The number of jobs in the primary sector was 30, of which 16 were in agriculture and 14 were in forestry or lumber production. There were no jobs in the secondary sector. The number of jobs in the tertiary sector was 31. In the tertiary sector; 7 or 22.6% were in wholesale or retail sales or the repair of motor vehicles, 3 or 9.7% were in a hotel or restaurant, 1 was in the information industry, 3 or 9.7% were technical professionals or scientists, 4 or 12.9% were in education and 11 or 35.5% were in health care.[15]
In 2000, there were 19 workers who commuted into the municipality and 102 workers who commuted away. The municipality is a net exporter of workers, with about 5.4 workers leaving the municipality for every one entering.[16] Of the working population, 4.7% used public transportation to get to work, and 67.6% used a private car.[9]
Religion
From the 2000 census, 45 or 14.8% were Roman Catholic, while 181 or 59.3% belonged to the Swiss Reformed Church. Of the rest of the population, there was 1 individual who belongs to the Christian Catholic Church, and there was 1 individual who belongs to another Christian church. There were 2 individuals who were Buddhist, 1 person who was Hindu and 3 individuals who belonged to another church. 46 (or about 15.08% of the population) belonged to no church, are agnostic or atheist, and 25 individuals (or about 8.20% of the population) did not answer the question.[10]
Education
In Corcelles-sur-Chavornay about 89 or (29.2%) of the population have completed non-mandatory upper secondary education, and 49 or (16.1%) have completed additional higher education (either university or a Fachhochschule). Of the 49 who completed tertiary schooling, 46.9% were Swiss men, 38.8% were Swiss women and 12.2% were non-Swiss women.[10]
In the 2009/2010 school year there were a total of 43 students in the Corcelles-sur-Chavornay school district. In the Vaud cantonal school system, two years of non-obligatory pre-school are provided by the political districts.[17] During the school year, the political district provided pre-school care for a total of 578 children of which 359 children (62.1%) received subsidized pre-school care. The canton's primary school program requires students to attend for four years. There were 26 students in the municipal primary school program. The obligatory lower secondary school program lasts for six years and there were 17 students in those schools.[18]
As of 2000, there were 10 students in Corcelles-sur-Chavornay who came from another municipality, while 44 residents attended schools outside the municipality.[16]
References
- ↑ Arealstatistik Standard - Gemeindedaten nach 4 Hauptbereichen
- ↑ Swiss Federal Statistical Office - STAT-TAB, online database – Ständige und nichtständige Wohnbevölkerung nach institutionellen Gliederungen, Geburtsort und Staatsangehörigkeit (German) accessed 30 August 2016
- 1 2 Corcelles-sur-Chavornay in German, French and Italian in the online Historical Dictionary of Switzerland.
- 1 2 Swiss Federal Statistical Office-Land Use Statistics 2009 data (German) accessed 25 March 2010
- ↑ Nomenklaturen – Amtliches Gemeindeverzeichnis der Schweiz (German) accessed 4 April 2011
- ↑ Flags of the World.com accessed 27-July-2011
- ↑ Swiss Federal Statistical Office - STAT-TAB, online database – Ständige und nichtständige Wohnbevölkerung nach institutionellen Gliederungen, Geburtsort und Staatsangehörigkeit (German) accessed 30 August 2016
- ↑ Swiss Federal Statistical Office - Superweb database - Gemeinde Statistics 1981-2008 Archived June 28, 2010, at the Wayback Machine. (German) accessed 19 June 2010
- 1 2 3 4 5 6 Swiss Federal Statistical Office Archived January 5, 2016, at the Wayback Machine. accessed 27-July-2011
- 1 2 3 4 5 STAT-TAB Datenwürfel für Thema 40.3 - 2000 Archived April 9, 2014, at the Wayback Machine. (German) accessed 2 February 2011
- ↑ Canton of Vaud Statistical Office (French) accessed 29 April 2011
- 1 2 Swiss Federal Statistical Office STAT-TAB - Datenwürfel für Thema 09.2 - Gebäude und Wohnungen Archived September 7, 2014, at the Wayback Machine. (German) accessed 28 January 2011
- ↑ Swiss Federal Statistical Office STAT-TAB Bevölkerungsentwicklung nach Region, 1850-2000 Archived September 30, 2014, at the Wayback Machine. (German) accessed 29 January 2011
- ↑ Swiss Federal Statistical Office, Nationalratswahlen 2007: Stärke der Parteien und Wahlbeteiligung, nach Gemeinden/Bezirk/Canton Archived May 14, 2015, at the Wayback Machine. (German) accessed 28 May 2010
- ↑ Swiss Federal Statistical Office STAT-TAB Betriebszählung: Arbeitsstätten nach Gemeinde und NOGA 2008 (Abschnitte), Sektoren 1-3 Archived December 25, 2014, at the Wayback Machine. (German) accessed 28 January 2011
- 1 2 Swiss Federal Statistical Office - Statweb (German) accessed 24 June 2010
- ↑ Organigramme de l'école vaudoise, année scolaire 2009-2010 (French) accessed 2 May 2011
- ↑ Canton of Vaud Statistical Office - Scol. obligatoire/filières de transition (French) accessed 2 May 2011
| Wikimedia Commons has media related to Corcelles-sur-Chavornay. |