D'Autray Regional County Municipality
| D'Autray | |
|---|---|
| Regional county municipality | |
 | |
| Coordinates: 46°10′N 73°10′W / 46.167°N 73.167°WCoordinates: 46°10′N 73°10′W / 46.167°N 73.167°W[1] | |
| Country |
|
| Province |
|
| Region | Lanaudière |
| Effective | January 1, 1982 |
| County seat | Berthierville |
| Government[2] | |
| • Type | Prefecture |
| • Prefect | Gaétan Gravel |
| Area[2][3] | |
| • Total | 1,352.00 km2 (522.01 sq mi) |
| • Land | 1,247.55 km2 (481.68 sq mi) |
| Population (2011)[3] | |
| • Total | 41,650 |
| • Density | 33.4/km2 (87/sq mi) |
| • Pop 2006-2011 |
|
| • Dwellings | 19,924 |
| Time zone | EST (UTC−5) |
| • Summer (DST) | EDT (UTC−4) |
| Area code(s) | 450 and 579 |
| Website |
www |
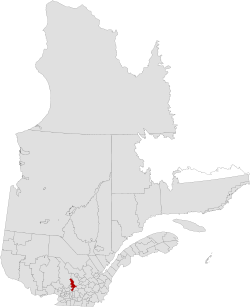
D'Autray is a regional county municipality in the Lanaudière region of Quebec, Canada. Its seat is Berthierville.
The municipality has a land area of 1,247.55 km² and a Canada 2011 Census population of 41,650 inhabitants. Its largest community is the city of Lavaltrie.
Subdivisions
There are 15 subdivisions within the RCM:[2]
|
|
|
Demographics
Population
| Canada census – D'Autray Regional County Municipality community profile | |||
|---|---|---|---|
| 2011 | 2006 | 2001 | |
| Population: | 41,650 (+3.3% from 2006) | 40,321 (+4.9% from 2001) | 38,347 (+2.1% from 1996) |
| Land area: | 1,247.55 km2 (481.68 sq mi) | 1,246.67 km2 (481.34 sq mi) | 1,100.00 km2 (424.71 sq mi) |
| Population density: | 33.4/km2 (87/sq mi) | 32.3/km2 (84/sq mi) | 34.9/km2 (90/sq mi) |
| Median age: | 45.1 (M: 44.5, F: 45.6) | 42.7 (M: 42.2, F: 43.3) | 39.7 (M: 39.1, F: 40.5) |
| Total private dwellings: | 19,924 | 18,747 | 17,733 |
| Median household income: | $49,313 | $41,784 | $37,737 |
| References: 2011[4] 2006[5] 2001[6] | |||
| Historical Census Data - D'Autray Regional County Municipality, Quebec[7] | |||||||||||||||||||||||||||||
|---|---|---|---|---|---|---|---|---|---|---|---|---|---|---|---|---|---|---|---|---|---|---|---|---|---|---|---|---|---|
|
|
| |||||||||||||||||||||||||||
(A) adjusted figure due to boundary change. | |||||||||||||||||||||||||||||
Language
| Canada Census Mother Tongue - D'Autray Regional County Municipality, Quebec[7] | ||||||||||||||||||
|---|---|---|---|---|---|---|---|---|---|---|---|---|---|---|---|---|---|---|
| Census | Total | French |
English |
French & English |
Other | |||||||||||||
| Year | Responses | Count | Trend | Pop % | Count | Trend | Pop % | Count | Trend | Pop % | Count | Trend | Pop % | |||||
| 2011 |
41,190 |
40,175 | |
0.00% | 425 | |
0.00% | 185 | |
0.00% | 405 | |
0.00% | |||||
| 2006 |
39,800 |
38,600 | |
96.98% | 485 | |
1.22% | 80 | |
0.20% | 635 | |
1.60% | |||||
| 2001 |
37,585 |
36,555 | |
97.26% | 495 | |
1.32% | 185 | |
0.49% | 350 | |
0.93% | |||||
| 1996 |
36,840 |
36,210 | n/a | 98.29% | 280 | n/a | 0.76% | 135 | n/a | 0.37% | 215 | n/a | 0.58% | |||||
Transportation
Access Routes
Highways and numbered routes that run through the municipality, including external routes that start or finish at the county border:[8]
|
See also
References
- ↑ Reference number 141108 of the Commission de toponymie du Québec (French)
- 1 2 3 Geographic code 520 in the official Répertoire des municipalités (French)
- 1 2 "(Code 2452) Census Profile". 2011 census. Statistics Canada. 2012.
- ↑ "2011 Community Profiles". Canada 2011 Census. Statistics Canada. July 5, 2013. Retrieved 2014-03-01.
- ↑ "2006 Community Profiles". Canada 2006 Census. Statistics Canada. March 30, 2011. Retrieved 2014-03-01.
- ↑ "2001 Community Profiles". Canada 2001 Census. Statistics Canada. February 17, 2012. Retrieved 2014-03-01.
- 1 2 Statistics Canada: 1996, 2001, 2006, 2011 census
- ↑ Official Transport Quebec Road Map
External links
 |
Matawinie RCM | | ||
| Joliette RCM | |
Maskinongé RCM | ||
| ||||
| | ||||
| L'Assomption RCM | Lake Saint Pierre Pierre-De Saurel RCM |
| Regional county municipalities and equivalent territories | |
|---|---|
| Municipalities | |
This article is issued from Wikipedia - version of the 9/12/2016. The text is available under the Creative Commons Attribution/Share Alike but additional terms may apply for the media files.