Debt-to-GDP ratio
In economics, the debt-to-GDP ratio is the ratio between a country's government debt (a cumulative amount) and its gross domestic product (GDP) (measured in years). A low debt-to-GDP ratio indicates an economy that produces and sells goods and services sufficient to pay back debts without incurring further debt. Geopolitical and economic considerations - including interest rates, war, recessions, and other variables - influence the borrowing practices of a nation and the choice to incur further debt.[1]
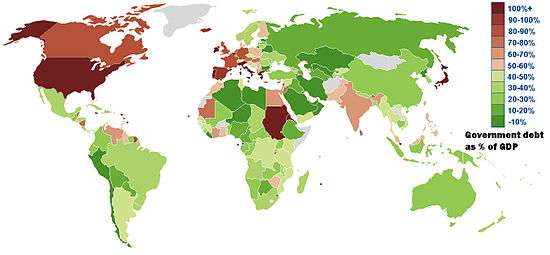
Global trends
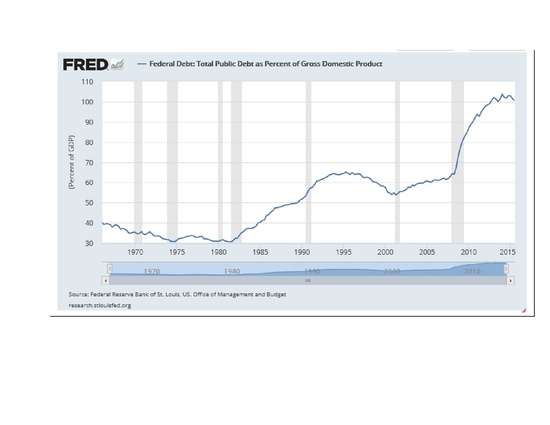
In 2016, United States public debt-to-GDP ratio was estimated at 71.8%[2] or 104.5%, including external debt.[3] The level of public debt in Japan 2013 was 243.2% of GDP, in China 22.4% and in India 66.7%, according to the IMF,[4] while the public debt-to-GDP ratio at the end of the 2nd quarter of 2016 was at 70.1% of GDP in Germany, 89.1% in the United Kingdom, 98.2% in France and 135.5% in Italy, according to Eurostat.[5]
Two thirds of US public debt is owned by US citizens, banks, corporations, and the Federal Reserve Bank;[6] approximately one third of US public debt is held by foreign countries - particularly China and Japan. Conversely, less than 5% of Japanese public debt is held by foreign countries.
Particularly in macroeconomics, various debt-to-GDP ratios can be calculated. The most commonly used ratio is the Government debt divided by the gross domestic product (GDP), which reflects the government's finances, while another common ratio is the total debt to GDP, which reflects the finances of the nation as a whole.
Units
The debt-to-GDP ratio is generally expressed as a percentage, but properly has units of years, as below.
By dimensional analysis these quantities are the ratio of a stock (with dimensions of currency) by a flow (with dimensions of currency/time), so[note 1] they have dimensions of time. With currency units of US dollars (or any other currency) and time units of years (GDP per annum), this yields the ratio as having units of years, which can be interpreted as "the number of years to pay off debt, if all of GDP is devoted to debt repayment".
This interpretation must be tempered by the understanding that GDP cannot be entirely devoted to debt repayment — some must be spent on survival, at the minimum, and in general only 5–10% will be devoted to debt repayment, even during episodes such as the Great Depression, which have been interpreted as debt-deflation — and thus actual "years to repay" is debt-to-GDP divided by "fraction of GDP devoted to repayment", which will generally be 10 times as long or more than simple debt-to-GDP.
Changes
The change in debt-to-GDP is approximately "net increase in debt as percentage of GDP"; for government debt, this is deficit or (surplus) as percentage of GDP.
This is only approximate as GDP changes from year to year, but generally year-on-year GDP changes are small (say, 3%), and thus this is approximately correct.
However, in the presence of significant inflation, or particularly hyperinflation, GDP may increase rapidly in nominal terms; if debt is nominal, then its ratio to GDP will decrease rapidly. A period of deflation would have the opposite effect.
A government's debt-to-GDP ratio can be analysed by looking at how it changes or, in other words, how the debt is evolving over time:

The left hand side of the equation demonstrates the dynamics of the government's debt. is the debt-to-GDP at the end of the period t, and is the debt-to-GDP ratio at the end of the previous period (t-1). Hence, the left side of the equation shows the change in the debt-to-GDP ratio. The right hand side of the equation shows the causes of the government's debt. is the interest payments on the stock of debt as a ratio of GDP so far, and shows the primary deficit-to-GDP ratio.


If the government has the ability to print money, and therefore monetize the outstanding debt, the budget constraint becomes:

The term is the change in money balances (i.e. money growth). By printing money the government is able to increase nominal money balances to pay off the debt (consequently acting in the debt way that debt financing does, in order to balance the government's expenditures). However, the effect that an increase in nominal money balances has on seignorage is ambiguous, as while it increases the amount of money within the economy, the real value of each unit of money decreases due to inflationary effects. This inflationary effect from money printing is called an inflation tax.

Applications
Debt-to-GDP measures the financial leverage of an economy.
One of the Euro convergence criteria was that government debt-to-GDP be below 60%.
The World Bank and the IMF hold that “a country can be said to achieve external debt sustainability if it can meet its current and future external debt service obligations in full, without recourse to debt rescheduling or the accumulation of arrears and without compromising growth.” According to these two institutions, external debt sustainability can be obtained by a country “by bringing the net present value (NPV) of external public debt down to about 150 percent of a country’s exports or 250 percent of a country’s revenues.” High external debt is believed to have harmful effects on an economy.[7]
In 2013 Herndon, Ash, and Pollin reviewed an influential, widely cited research paper entitled, "Growth in a time of debt",[8] by two Harvard economists Carmen Reinhart and Kenneth Rogoff. Herndon, Ash and Pollin argued that "coding errors, selective exclusion of available data, and unconventional weighting of summary statistics lead to serious errors that inaccurately represent the relationship between public debt and GDP growth among 20 advanced economies in the post-war period."[9][10] Their research had significant basic computation errors that, when corrected, undermined the central claim of the book that too much debt causes recession.[11][12] Rogoff and Reinhardt claimed that their fundamental conclusions were accurate, despite the errors.[13][14]
There is a difference between external debt denominated in domestic currency, and external debt denominated in foreign currency. A nation can service external debt denominated in domestic currency by tax revenues, but to service foreign currency debt it has to convert tax revenues in foreign exchange market to foreign currency, which puts downward pressure on the value of its currency. So all of the money used to service foreign currency debt has to come from a country's balance of payments transfers.
See also
- Credit bubble
- Debt levels and flows
- Leverage (finance)
- List of countries by public debt
- List of countries by external debt
- List of countries by tax revenue as percentage of GDP
Notes
- ↑ Currency/(Currency/Time) = Time
References
| Wikimedia Commons has media related to Debt-to-GDP ratio. |
- ↑ "Budget Deficits and Interest Rates: What is the Link?". Federal Bank of St. Louis.
- ↑ https://www.cia.gov/library/publications/the-world-factbook/rankorder/2186rank.html
- ↑ International Monetary Fund: All countries Government finance>General government gross debt(Percent of GDP)
- ↑ International Monetary Fund: All countries Government finance>General government gross debt(Percent of GDP)
- ↑ Eurostat - News release: Government debt fell to 91.2% of GDP in euro area 24 October 2016.
- ↑ "America's Foreign Creditors". New York Times. 19 July 2011.
- ↑ Bivens, L. Josh (December 14, 2004). Debt and the dollar Economic Policy Institute. Retrieved on July 8, 2007. p. 2, "US external debt obligations."
- ↑ Krudy, Edward (18 April 2013). "How a student took on eminent economists on debt issue - and won". Reuters.
- ↑ Herndon, Thomas; Ash, Michael; Pollin, Robert (15 April 2013). "Does High Public Debt Consistently Stifle Economic Growth? A Critique of Reinhart and Rogoff" (PDF). Political Economy Research Institute, University of Massachusetts Amherst. Retrieved 18 April 2013.
- ↑ Goldstein, Steve (April 16, 2013). "The spreadsheet error in Reinhart and Rogoff's famous paper on debt sustainability". MarketWatch. Retrieved April 18, 2013.
- ↑ Alexander, Ruth (19 April 2013). "Reinhart, Rogoff... and Herndon: The student who caught out the profs". BBC News. Retrieved 20 April 2013.
- ↑ "How Much Unemployment Was Caused by Reinhart and Rogoff's Arithmetic Mistake?". Center for Economic and Policy Research. April 16, 2013. Retrieved April 18, 2013.
- ↑ Harding, Robin (16 April 2013). "Reinhart-Rogoff Initial Response". Financial Times.
- ↑ Inman, Phillip (April 17, 2013). "Rogoff and Reinhart defend their numbers". The Guardian. Retrieved April 18, 2013.