England and Wales mayoral referendums
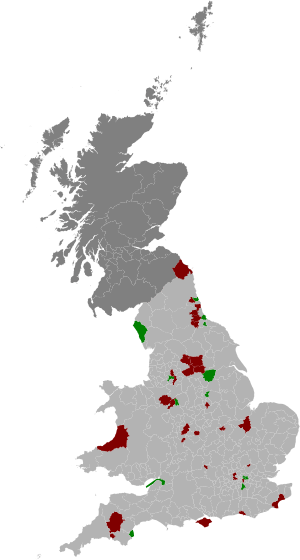
Map showing referendum results by authority.
As of October 2016, there have been 53 referendums on the question of changing executive arrangements to a model with a directly elected mayor. Of these, 16 have resulted in the establishment of a new mayoralty and 37 have been rejected by voters. Referendums are triggered by council resolution, local petition or central government intervention.
Change to elected mayor?
"Yes" majority shown in green, "No" majority shown in red.
| Local authority | Date | Yes votes | Yes vote % | No votes | No vote % | Turnout % |
|---|---|---|---|---|---|---|
| Berwick-upon-Tweed | 7 June 2001 | 3,617 | 26 | 10,212 | 74 | 64 |
| Cheltenham | 28 June 2001 | 8,083 | 33 | 16,602 | 67 | 32 |
| Gloucester | 28 June 2001 | 7,731 | 32 | 16,317 | 68 | 31 |
| Watford | 12 July 2001 | 7,636 | 52 | 7,140 | 48 | 25 |
| Doncaster | 20 September 2001 | 35,453 | 65 | 19,398 | 35 | 25 |
| Kirklees | 4 October 2001 | 10,169 | 27 | 27,977 | 73 | 13 |
| Sunderland | 11 October 2001 | 9,375 | 43 | 12,209 | 57 | 10 |
| Brighton & Hove | 18 October 2001 | 22,724 | 38 | 37,214 | 62 | 32 |
| Hartlepool | 18 October 2001 | 10,667 | 51 | 10,294 | 49 | 34 |
| Lewisham | 18 October 2001 | 16,822 | 51 | 15,914 | 49 | 18 |
| Middlesbrough | 18 October 2001 | 29,067 | 84 | 5,422 | 16 | 34 |
| North Tyneside | 18 October 2001 | 30,262 | 58 | 22,296 | 42 | 36 |
| Sedgefield | 18 October 2001 | 10,628 | 47 | 11,869 | 53 | 33 |
| Redditch | 8 November 2001 | 7,250 | 44 | 9,198 | 56 | 28 |
| Durham | 20 November 2001 | 8,327 | 41 | 11,974 | 59 | 29 |
| Harrow | 6 December 2001 | 17,502 | 43 | 23,554 | 57 | 26 |
| Plymouth | 24 January 2002 | 29,559 | 41 | 42,811 | 59 | 40 |
| Harlow | 24 January 2002 | 5,296 | 25 | 15,490 | 75 | 25 |
| Newham | 31 January 2002 | 27,263 | 68 | 12,687 | 32 | 26 |
| Southwark | 31 January 2002 | 6,054 | 31 | 13,217 | 69 | 11 |
| West Devon | 31 January 2002 | 3,555 | 23 | 12,190 | 77 | 42 |
| Shepway | 31 January 2002 | 11,357 | 44 | 14,438 | 56 | 36 |
| Bedford | 21 February 2002 | 11,316 | 67 | 5,537 | 33 | 16 |
| Hackney | 2 May 2002 | 24,697 | 59 | 10,547 | 41 | 32 |
| Mansfield | 2 May 2002 | 8,973 | 55 | 7,350 | 45 | 21 |
| Newcastle-under-Lyme | 2 May 2002 | 12,912 | 44 | 16,468 | 56 | 31.5 |
| Oxford | 2 May 2002 | 14,692 | 44 | 18,686 | 56 | 34 |
| Stoke-on-Trent | 2 May 2002 | 28,601 | 58 | 20,578 | 42 | 27 |
| Corby | 1 October 2002 | 5,351 | 46 | 6239 | 54 | 31 |
| Ealing | 12 December 2002 | 9,454 | 45 | 11,655 | 55 | 10 |
| Ceredigion | 20 May 2004 | 5,308 | 27 | 14,013 | 73 | 36 |
| Isle of Wight | 5 May 2005 | 28,786 | 43.7 | 37,097 | 56.3 | 60.4 |
| Fenland | 14 July 2005 | 5,509 | 24.2 | 17,296 | 75.8 | 33.6 |
| Torbay | 14 July 2005 | 18,074 | 55.2 | 14,682 | 44.8 | 32.1 |
| Crewe and Nantwich | 4 May 2006 | 11,808 | 38.2 | 18,768 | 60.8 | 35.3 |
| Darlington | 27 September 2007 | 7,981 | 41.6 | 11,226 | 58.4 | 24.6 |
| Bury | 3 July 2008 | 10,338 | 40.1 | 15,425 | 59.9 | 18.3 |
| Tower Hamlets | 6 May 2010 | 60,758 | 60.3 | 39,857 | 39.7 | 62.1 |
| Great Yarmouth | 5 May 2011 | 10,051 | 39.2 | 15,595 | 60.8 | 36 |
| Salford | 26 January 2012 | 17,344 | 56.0 | 13,653 | 44.0 | 18.1 |
| Birmingham | 3 May 2012 | 88,085 | 42.2 | 120,611 | 57.8 | 28.35 |
| Bradford | 3 May 2012 | 53,949 | 44.9 | 66,283 | 55.1 | 35 |
| Bristol | 3 May 2012 | 41,032 | 53 | 35,880 | 47 | 24 |
| Coventry | 3 May 2012 | 22,619 | 36.4 | 39,483 | 63.6 | 26.6 |
| Leeds | 3 May 2012 | 62,440 | 36.7 | 107,910 | 63.3 | 31 |
| Manchester | 3 May 2012 | 42,677 | 46.8 | 48,593 | 53.2 | 25.3 |
| Newcastle upon Tyne | 3 May 2012 | 24,630 | 38.1 | 40,089 | 61.9 | |
| Nottingham | 3 May 2012 | 20,943 | 42.5 | 28,320 | 57.5 | 23.9 |
| Sheffield | 3 May 2012 | 44,571 | 35.0 | 82,890 | 65.0 | |
| Wakefield | 3 May 2012 | 27,610 | 37.8 | 45,357 | 62.2 | |
| Copeland | 22 May 2014 | 12,671 | 69.8 | 5,489 | 30.2 | 33.9 |
| Bath and North East Somerset | 10 March 2016 | 8,504 | 21.8 | 30,557 | 78.1 | 28.9 |
| Guildford | 13 October 2016 | 4,948 | 19.3 | 20,369 | 80.6 | 24.9 |
Referendums on removal of mayor
There have been six referendums on the question of removing the post of elected mayor. Three mayoral posts have been disestablished following a vote and three retained.
"Retain" majority shown in green, "Remove" majority shown in red.
| Local authority | Date | Retain votes | Retain vote % | Remove votes | Remove vote % | Turnout % |
|---|---|---|---|---|---|---|
| Stoke-on-Trent | 23 October 2008 | 14,592 | 41 | 21,231 | 59 | 19.2 |
| Doncaster | 3 May 2012 | 42,196 | 61.7 | 25,879 | 37.8 | 30.7 |
| Hartlepool | 3 May 2012 | 5,177 | 41.3 | 7,366 | 58.7 | 18 |
| Middlesbrough | 26 September 2013 | 8,674 | 57.3 | 6,455 | 42.7 | 15 |
| North Tyneside | 5 May 2016 | 32,546 | 57.8 | 23,730 | 42.2 | 36.4 |
| Torbay | 5 May 2016 | 9,511 | 37.5 | 15,846 | 62.5 | 25.3 |
See also
Devolution in the United Kingdom | |||||||||||||||||||||||
|---|---|---|---|---|---|---|---|---|---|---|---|---|---|---|---|---|---|---|---|---|---|---|---|
| Devolved areas |
| ||||||||||||||||||||||
| Referendums1 | |||||||||||||||||||||||
| Heads of devolved governments | |||||||||||||||||||||||
| Devolved legislatures2 | |||||||||||||||||||||||
| Devolved administrations3 | |||||||||||||||||||||||
| Organisations and laws of the legislatures and governments of the UK and the devolved areas |
| ||||||||||||||||||||||
| Elections | |||||||||||||||||||||||
| Related articles |
| ||||||||||||||||||||||
1. Rejected referendums are italicised. The others were fully or partially approved. 2. There is no law-making body for any regionally devolved area. 3. Administrations of regionally devolved areas are omitted. | |||||||||||||||||||||||
This article is issued from Wikipedia - version of the 10/20/2016. The text is available under the Creative Commons Attribution/Share Alike but additional terms may apply for the media files.