Ethnic and religious composition of Austria-Hungary
The ethno-linguistic composition of Austria-Hungary according to the census of 31 December 1910 was as follows:[1]
Population
| Area | Number | % |
|---|---|---|
| Cisleithania | 28,571,934 | 55.6 |
| Transleithania | 20,886,487 | 40.6 |
| Bosnia and Herzegovina (Austro-Hungarian condominium) | 1,931,802 | 3.8 |
| Total | 51,390,223 | 100.0 |
Languages
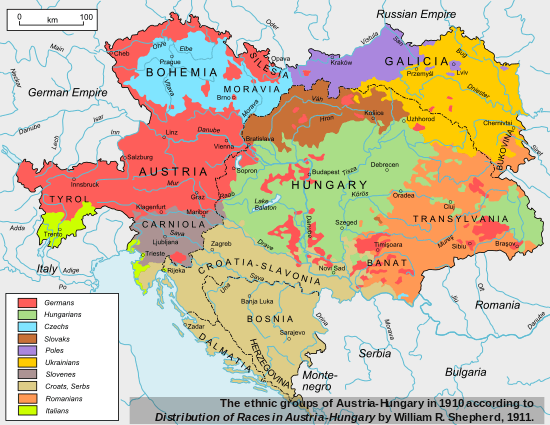
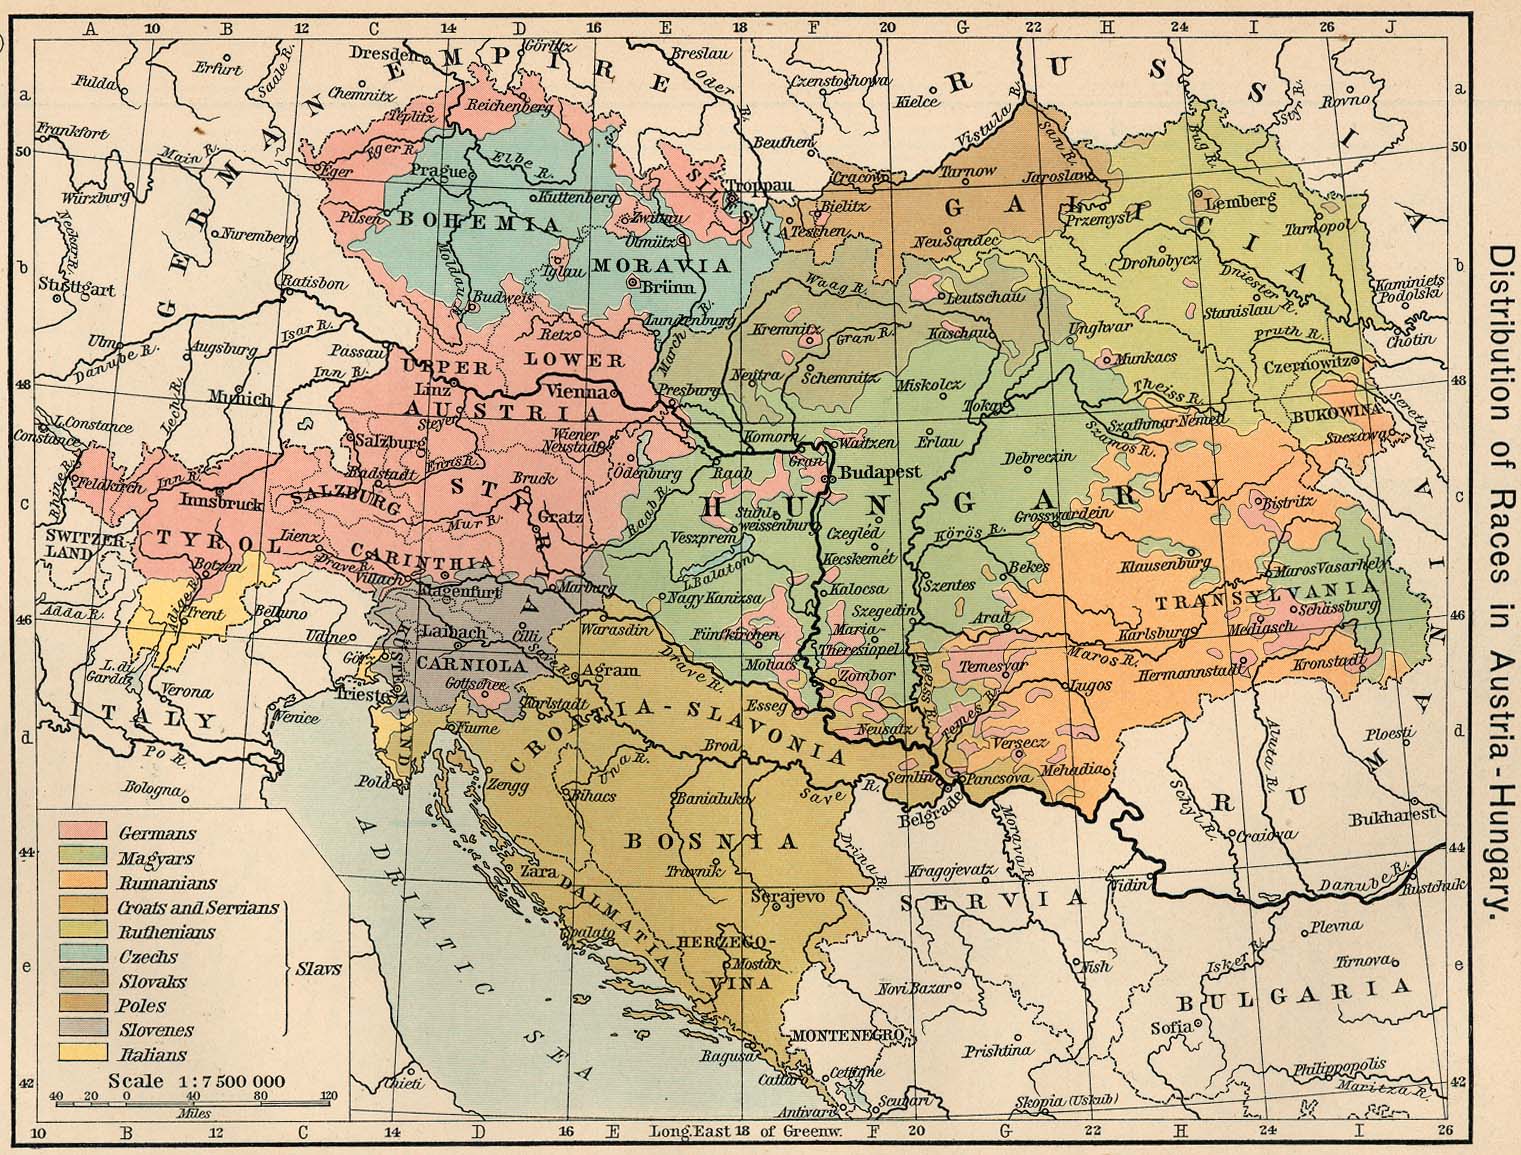
Ethno-linguistic map of Austria-Hungary, 1910
The census of 1911 recorded Umgangssprache, everyday language. Jews and those using German in offices often stated German as their Umgangssprache, even when having a different Muttersprache. In "Hungary proper", 5% of the population were Jews, who were included in speakers of the Hungarian language.[2]
| Language | Number | % |
|---|---|---|
| German | 12,006,521 | 23.36 |
| Hungarian | 10,056,315 | 19.57 |
| Czech | 6,442,133 | 12.54 |
| Polish | 4,976,804 | 9.68 |
| Croatian | 4,380,891 | 8.52 |
| Ruthenian (Ukrainian) | 3,997,831 | 7.78 |
| Romanian | 3,224,147 | 6.27 |
| Slovak | 1,967,970 | 3.83 |
| Slovene | 1,255,620 | 2.44 |
| Italian | 768,422 | 1.50 |
| Other | 2,313,569 | 4.51 |
| Total | 51,390,223 | 100.00 |
Cisleithanian states
| Land | Main language | others (if more than 2%) |
|---|---|---|
| Bohemia | Czech (63.2%) | German (36.8%) |
| Dalmatia | Croatian (96.2%) | Italian (2.8%) |
| Galicia | Polish (58.6%) | Ukrainian (40.2%) |
| Lower Austria | German (95.9%) | Czech (3.8%) |
| Upper Austria | German (99.7%) | |
| Bukovina | Ukrainian (38.4%) | Romanian (34.4%), German (21.2%), Polish (4.6%) |
| Carinthia | German (78.6%) | Slovenian (21.2%) |
| Carniola | Slovenian (94.4%) | German (5.4%) |
| Salzburg | German (99.7%) | |
| Austrian Silesia | German (43.9%) | Polish (31.7%), Czech (24.3%) |
| Styria | German (70.5%) | Slovenian (29.4%) |
| Moravia | Czech (71.8%) | German (27.6%) |
| County of Tyrol | German (57.3%) | Italian (42.1%) |
| Austrian Littoral | Slovenian (37.3%) | Italian (34.5%), Croatian (24.4%), German (2.5%) |
| Vorarlberg | German (95.4%) | Italian (4.4%) |
Transleithanian states
| Land | Main language | others (if more than 2%) |
|---|---|---|
| Kingdom of Hungary | Hungarian (54%) | Romanian (16.1%), Slovak (10.5%), German (10.4%), Ruthenian (2.5%), Serbian (2.5%) |
| Kingdom of Croatia-Slavonia | Croatian (62.5%) | Serbian (24.6%), German (5.0%), Hungarian (4.1%) |
Historical regions
| |
|
|
|
| Transylvania | Romanian – 2,819,467 (54%) | 1,658,045 (31.7%) | German – 550,964 (10.5%) |
| Slovakia | Slovak – 1,688,413 (57.9%) | 881,320 (30.2%) | German – 198,405 (6.8%) |
| Vojvodina | Serbo-Croatian – 601,770 (39.8%) | 425,672 (28.1%) | German – 324,017 (21.4%) |
| Transcarpathia | Ruthenian or Ukrainian – 330,010 (54.5%) | 185,433 (30.6%) | German – 64,257 (10.6%) |
| Fiume | Italian – 24,212 (48.6%) | 6,493 (13%) | Croatian and Serbian – 13,351 (26.8%) Slovene - 2,336 (4.7%) German - 2,315 (4.6%) |
| Burgenland | German – 217,072 (74.4%) | 26,225 (9%) | Croatian – 43,633 (15%) |
| Prekmurje | Slovene – 74,199 (80.4%) – in 1921 | 14,065 (15.2%) – in 1921 | German – 2,540 (2.8%) – in 1921 |
Religions
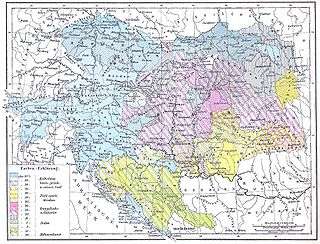
Map of religions, from Andrees Allgemeiner Handatlas
| Religions/Confessions | in all of Austria-Hungary | Austrian part |
Hungarian part |
Bosnia and Herzegovina |
|---|---|---|---|---|
| Catholics | 76.6% | 90.9% | 61.8% | 22.9% |
| Protestants | 8.9% | 2.1% | 19.0% | 0.3% |
| Orthodox | 8.7% | 2.3% | 14.3% | 43.5% |
| Jews | 4.4% | 4.7% | 4.9% | 0.6% |
| Muslims | 1.3% | 0% | 0% | 32.7% |
See also
References
- William R. Shepherd: "Distribution of Races in Austria-Hungary", Historical Atlas, 1911
This article is issued from Wikipedia - version of the 7/12/2016. The text is available under the Creative Commons Attribution/Share Alike but additional terms may apply for the media files.