French departmental elections, 2015

Party affiliation of the Departemental Council Presidents
 |
| This article is part of a series on the politics and government of France |
|
|
Related topics |
| France portal |
Departmental elections to elect the membership of the departmental councils of France's 100 departments was held on 22 and 29 March 2015.
In 2015, the term departmental elections replaced cantonal elections, and the term departmental council replaced the general council.
Electoral system
Like the previous cantonal elections, the departmental elections used a two-round system similar to that employed in the country's legislative elections. One change was that the election adopted paired voting.
- 2 councillors (a man and a woman) were elected from single-member constituencies (the new cantons adopted in 2014).
- A pair securing the votes of at least 25% of the canton's registered voters and more than 50% of the total number of votes actually cast in the first round of voting would be thereby elected. If no candidate satisfies these conditions, then a second round of voting would be held one week later.
- Entitled to present themselves in the second round were the two pairs who received the highest number of votes in the first round, plus any other candidate or candidates who received the votes of at least 12.5% of those registered to vote in the canton.[1]
- In the second round, the pair receiving the highest number of votes would be elected.
Neither the city of Paris, the Lyon métropole, nor Martinique and French Guiana took part in this election due to their particular statuses.
Opinion polls
| Date | Source | LO and NPA | FG | EELV | PS | MoDem | UDI | UMP | FN | Others |
|---|---|---|---|---|---|---|---|---|---|---|
| 12 December 2014 | Odoxa | 2% | 9% | 7% | 17% | 5% | 7% | 25% | 28% | - |
| 27 January 2015 | Odoxa | 1% | 10% | 7% | 20% | 6% | 7% | 23% | 26% | - |
| 30 January 2015 | BVA | 2% | 9% | 7% | 18% | 8% | 5% | 25% | 26% | - |
| 13 February 2015 | Ifop | 2% | 7% | 6% | 21% | 6% | 29% | 2% | ||
| 20 February 2015 | Ifop | 2% | 6% | 7% | 20% | see others | 30% | 7% | ||
| 27 February 2015 | Odoxa | 2% | 9% | 4% | 19% | see others | 33% | 6% | ||
| 4 March 2015 | CSA | 0.5% | 6% | 2% | 21% | 25% | 29% | 12% | ||
| 5 March 2015 | Opinion Way | see others | 7% | 2% | 21% | see others | 28% | 13% | ||
| 5 March 2015 | Harris Interactive | 1% | 6% | 4% | 21% | 3% | 30% | 7% | ||
| 6 March 2015 | Odoxa | 1% | 8% | 4% | 20% | see others | 31% | 7% | ||
| 11 March 2015 | Harris Interactive | 0.5% | 7% | 3% | 26% | 0.5% | 29% | 2% | ||
| 13 March 2015 | Ifop | see others | 6% | 3% | 19% | see others | 30% | 13% | ||
| 17 March 2015 | Ipsos | see others | 7% | 2% | 21% | 0,5% | 29% | 14% | ||
| 18 March 2015 | Harris Interactive | see others | 7% | 2% | 19% | 1% | 29% | 14% | ||
| 19 March 2015 | Opinion Way | see others | 6% | 3% | 22% | 0.5% | 29% | 10.5% | ||
Results
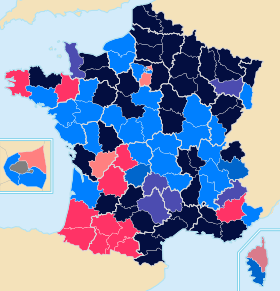
Leading single party or grouping after the first round in Metropolitan France, broken down by department. Colour key:
National Front
Union for a Popular Movement
Union of the Right
Miscellaneous right
Socialist Party
Union of the Left
Miscellaneous left
No election
| Party | First round | Second round | Total seats | |||||
|---|---|---|---|---|---|---|---|---|
| Votes | % | Seats | Votes | % | Seats | |||
| Left Front (Front de Gauche) | 962,394 | 4.72 | 1 | 266,896 | 1.44 | 7 | 19 | |
| Union of the Left (Union de la Gauche) [Socialist Party and its allies] | 1,667,533 | 8,19 | - | 1,679,890 | 9,09 | - | - | |
| Socialist Party (Parti socialiste) | 2,708,427 | 13.30 | 24 | 2,967,883 | 16.06 | 925 | 954 | |
| Europe Écologie – Les Verts | 412,729 | 2.03 | 0 | 29,888 | 0.16 | 35 | 35 | |
| Communist Party (Parti communiste français) | 269,285 | 1.32 | 5 | 100,413 | 0.54 | 167 | 121 | |
| Miscellaneous left (Divers gauche) | 1,383,318 | 6.79 | 27 | 828,537 | 4.48 | 376 | 403 | |
| Radical Party of the Left (Parti radical de gauche) | 62,372 | 0.31 | 4 | 64 110 | 0.35 | 59 | 63 | |
| Left Party (Parti de gauche) | 12,027 | 0.06 | 0 | 2,498 | 0.01 | 2 | 2 | |
| Union for a Popular Movement (Union pour un Mouvement Populaire) | 1,339,412 | 6.57 | 74 | 1,596,391 | 8.64 | 1006 | 1080 | |
| Miscellaneous right (Divers droite) | 1,386,466 | 6.81 | 115 | 1,279,623 | 6.92 | 784 | 899 | |
| Union of Democrats and Independents (Union des Démocrates Indépendants) | 263,209 | 1.29 | 30 | 247,714 | 1.34 | 334 | 364 | |
| Union of the Right (Union de la Droite) [Union pour un Mouvement Populaire and its allies] | 4,254,050 | 20.88 | - | 5,102,317 | 27.61 | - | - | |
| National Front (Front national) | 5,141,897 | 25.24 | 8 | 4 108 404 | 22.23 | 54 | 62 | |
| Others (Divers) | 271,065 | 1.33 | 4 | 98,781 | 0.53 | 45 | 49 | |
| Democratic Movement (Mouvement démocrate) | 72,410 | 0.36 | 1 | 48,038 | 0.26 | 47 | 48 | |
| Far-right (Extrême droite) | 13,382 | 0.07 | 0 | 12,851 | 0.07 | 4 | 4 | |
| Totals | 21,419,393 | 50.17 | 528 | 20,160,862 | 49.98 | |||
| Turnout | ||||||||
References
- ↑ "How the French elections work". The Connexion. Retrieved 4 October 2016.
External links
| Presidential | |
|---|---|
| Parliamentary |
|
| Regional | |
| Departemental | |
| Municipal | |
| European | |
| Referendums | |
| |
This article is issued from Wikipedia - version of the 10/5/2016. The text is available under the Creative Commons Attribution/Share Alike but additional terms may apply for the media files.