Gamma spectroscopy
Gamma-ray spectroscopy is the quantitative study of the energy spectra of gamma-ray sources, in such as the nuclear industry, geochemical investigation, and astrophysics.
Most radioactive sources produce gamma rays, which are of various energies and intensities. When these emissions are detected and analyzed with a spectroscopy system, a gamma-ray energy spectrum can be produced.
A detailed analysis of this spectrum is typically used to determine the identity and quantity of gamma emitters present in a gamma source, and is a vital tool in radiometric assay. The gamma spectrum is characteristic of the gamma-emitting nuclides contained in the source, just as in optical spectroscopy, the optical spectrum is characteristic of the material contained in a sample.
Gamma ray characteristics
Gamma rays are the highest-energy form of electromagnetic radiation, being physically the same as all other forms (e.g., X rays, visible light, infrared, radio) but having (in general) higher photon energy due to their shorter wavelength. Because of this, the energy of gamma-ray photons can be resolved individually, and a gamma-ray spectrometer can measure and display the energies of the gamma-ray photons detected.
Radioactive nuclei (radionuclides) commonly emit gamma rays in the energy range from a few keV to ~10 MeV, corresponding to the typical energy levels in nuclei with reasonably long lifetimes. Such sources typically produce gamma-ray "line spectra" (i.e., many photons emitted at discrete energies), whereas much higher energies (upwards of 1 TeV) may occur in the continuum spectra observed in astrophysics and elementary particle physics. The boundary between gamma rays and X rays is somewhat blurred, as X rays typically refer to the high energy electronic emission of atoms, which may extend to over 100 keV, whereas the lowest energy emissions of nuclei are typically termed gamma rays, even though their energies may be below 20 keV.
System components and principle of operation in components
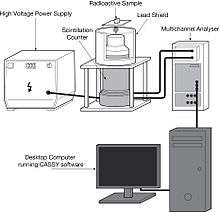
The equipment used in gamma spectroscopy includes an energy-sensitive radiation detector, electronics to process detector signals produced by the detector, such as a pulse sorter (i.e., multichannel analyzer), and associated amplifiers and data readout devices to generate, display, and store the spectrum. Other components, such as rate meters and peak position stabilizers, may also be included.
The most common detectors include sodium iodide (NaI) scintillation counters and high-purity germanium detectors.
Gamma spectroscopy detectors are passive materials that wait for a gamma interaction to occur in the detector volume. The most important interaction mechanisms are the photoelectric effect, the Compton effect, and pair production. The photoelectric effect is preferred, as it absorbs all of the energy of the incident gamma ray. Full energy absorption is also possible when a series of these interaction mechanisms take place within the detector volume. When a gamma ray undergoes a Compton interaction or pair production, and a portion of the energy escapes from the detector volume without being absorbed, the background rate in the spectrum is increased by one count. This count will appear in a channel below the channel that corresponds to the full energy of the gamma ray. Larger detector volumes reduce this effect.
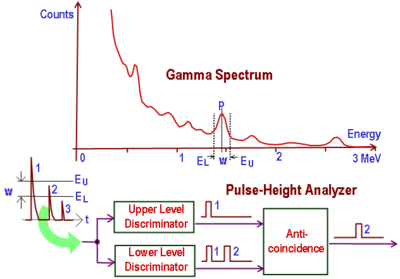
The voltage pulse produced by the detector (or by the photomultiplier in a scintillation counter) is shaped by a multichannel analyzer (MCA). The multichannel analyzer takes the very small voltage signal produced by the detector, reshapes it into a Gaussian or trapezoidal shape, and converts that signal into a digital signal. In some systems, the analog-to-digital conversion is performed before the peak is reshaped. The analog-to-digital converter (ADC) also sorts the pulses by their height. ADCs have specific numbers of "bins" into which the pulses can be sorted; these bins represent the channels in the spectrum. The number of channels can be changed in most modern gamma spectroscopy systems by modifying software or hardware settings. The number of channels is typically a power of two; common values include 512, 1024, 2048, 4096, 8192, or 16384 channels. The choice of number of channels depends on the resolution of the system and the energy range being studied.
The multichannel analyzer output is sent to a computer, which stores, displays, and analyzes the data. A variety of software packages are available from several manufacturers, and generally include spectrum analysis tools such as energy calibration, peak area and net area calculation, and resolution calculation.
Detector performance
Gamma spectroscopy systems are selected to take advantage of several performance characteristics. Two of the most important include detector resolution and detector efficiency.
Detector resolution
Gamma rays detected in a spectroscopic system produce peaks in the spectrum. These peaks can also be called lines by analogy to optical spectroscopy. The width of the peaks is determined by the resolution of the detector, a very important characteristic of gamma spectroscopic detectors, and high resolution enables the spectroscopist to separate two gamma lines that are close to each other. Gamma spectroscopy systems are designed and adjusted to produce symmetrical peaks of the best possible resolution. The peak shape is usually a Gaussian distribution. In most spectra the horizontal position of the peak is determined by the gamma ray's energy, and the area of the peak is determined by the intensity of the gamma ray and the efficiency of the detector.
The most common figure used to express detector resolution is full width at half maximum (FWHM). This is the width of the gamma ray peak at half of the highest point on the peak distribution. Resolution figures are given with reference to specified gamma ray energies. Resolution can be expressed in absolute (i.e., eV or MeV) or relative terms. For example, a sodium iodide (NaI) detector may have a FWHM of 9.15 keV at 122 keV, and 82.75 keV at 662 keV. These resolution values are expressed in absolute terms. To express the resolution in relative terms, the FWHM in eV or MeV is divided by the energy of the gamma ray and usually shown as percentage. Using the preceding example, the resolution of the detector is 7.5% at 122 keV, and 12.5% at 662 keV. A germanium detector may give resolution of 560 eV at 122 keV, yielding a relative resolution of 0.46%.
Detector efficiency
Not all gamma rays emitted by the source that pass through the detector will produce a count in the system. The probability that an emitted gamma ray will interact with the detector and produce a count is the efficiency of the detector. High-efficiency detectors produce spectra in less time than low-efficiency detectors. In general, larger detectors have higher efficiency than smaller detectors, although the shielding properties of the detector material are also important factors. Detector efficiency is measured by comparing a spectrum from a source of known activity to the count rates in each peak to the count rates expected from the known intensities of each gamma ray.
Efficiency, like resolution, can be expressed in absolute or relative terms. The same units are used (i.e., percentages); therefore, the spectroscopist must take care to determine which kind of efficiency is being given for the detector. Absolute efficiency values represent the probability that a gamma ray of a specified energy passing through the detector will interact and be detected. Relative efficiency values are often used for germanium detectors, and compare the efficiency of the detector at 1332 keV to that of a 3 in × 3 in NaI detector (i.e., 1.2×10 −3 cps/Bq at 25 cm). Relative efficiency values greater than one hundred percent can therefore be encountered when working with very large germanium detectors.
The energy of the gamma rays being detected is an important factor in the efficiency of the detector. An efficiency curve can be obtained by plotting the efficiency at various energies. This curve can then be used to determine the efficiency of the detector at energies different from those used to obtain the curve. High-purity germanium (HPGe) detectors typically have higher sensitivity.
Scintillation detectors
Scintillation detectors use crystals that emit light when gamma rays interact with the atoms in the crystals. The intensity of the light produced is proportional to the energy deposited in the crystal by the gamma ray. The mechanism is similar to that of a thermoluminescent dosimeter. The detectors are joined to photomultipliers that convert the light into electrons and then amplify the electrical signal provided by those electrons. Common scintillators include thallium-doped sodium iodide (NaI(Tl))—often simplified to sodium iodide (NaI) detectors—and bismuth germanate (BGO). Because photomultipliers are also sensitive to ambient light, scintillators are encased in light-tight coverings.
Scintillation detectors can also be used to detect alpha- and beta-radiation.
Sodium iodide-based detectors
Cs
)

Co
)
Thallium-doped sodium iodide (NaI(Tl)) has two principal advantages:
- It can be produced in large crystals, yielding good efficiency, and
- it produces intense bursts of light compared to other spectroscopic scintillators.
NaI(Tl) is also convenient to use, making it popular for field applications such as the identification of unknown materials for law enforcement purposes.
Electron hole recombination will emit light that can re-excite the crystal, however thallium in NaI(Tl) provides energy states within the band gap between the conduction and valence bands. Following excitation, some electrons in the conduction band will migrate to the activator states; the downward transitions from the activator states will not re-excite the crystal, so the crystal is transparent to this radiation.
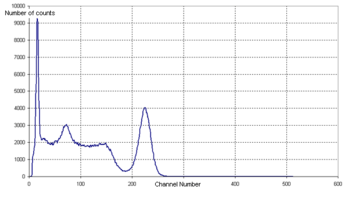
An example of a NaI spectrum is the gamma spectrum of the caesium isotope 137
Cs
—see Figure 1. 137
Cs
emits a single gamma line of 662 keV. It should be noted that the 662 keV line shown is actually produced by 137m
Ba
, the decay product of 137
Cs
, which is in secular equilibrium with 137
Cs
.
The spectrum in Figure 1 was measured using a NaI-crystal on a photomultiplier, an amplifier, and a multichannel analyzer. The figure shows the number of counts within the measuring period versus channel number. The spectrum indicates the following peaks (from left to right):
- low energy x radiation (due to internal conversion of the gamma ray),
- backscatter at the low energy end of the Compton distribution, and
- a photopeak (full energy peak) at an energy of 662 keV
The Compton distribution is a continuous distribution that is present up to channel 150 in Figure 1. The distribution arises because of primary gamma rays undergoing Compton scattering within the crystal: Depending on the scattering angle, the Compton electrons have different energies and hence produce pulses in different energy channels.
If many gamma rays are present in a spectrum, Compton distributions can present analysis challenges. To reduce gamma rays, an anticoincidence shield can be used—see Compton suppression. Gamma ray reduction techniques are especially useful for small lithium-doped germanium (Ge(Li)) detectors.
The gamma spectrum shown in Figure 2 is of the cobalt isotope 60
Co
, with two gamma rays with 1.17 MeV and 1.33 MeV respectively. (See the decay scheme article for the decay scheme of cobalt-60.) The two gamma lines can be seen well-separated; the peak to the left of channel 200 most likely indicates a strong background radiation source that has not been subtracted. A backscatter peak can be seen at channel 150, similar to the second peak in Figure 1.
Sodium iodide systems, as with all scintillator systems, are sensitive to changes in temperature. Changes in the operating temperature caused by changes in environmental temperature will shift the spectrum on the horizontal axis. Peak shifts of tens of channels or more are commonly observed. Such shifts can be prevented by using spectrum stabilizers.
Because of the poor resolution of NaI-based detectors, they are not suitable for the identification of complicated mixtures of gamma ray-producing materials. Scenarios requiring such analyses require detectors with higher resolution.
Semiconductor-based detectors
Semiconductor detectors, also called solid-state detectors, are fundamentally different from scintillation detectors: They rely on detection of the charge carriers (electrons and holes) generated in semiconductors by energy deposited by gamma ray photons.
In semiconductor detectors, an electric field is applied to the detector volume. An electron in the semiconductor is fixed in its valence band in the crystal until a gamma ray interaction provides the electron enough energy to move to the conduction band. Electrons in the conduction band can respond to the electric field in the detector, and therefore move to the positive contact that is creating the electrical field. The gap created by the moving electron is called a "hole," and is filled by an adjacent electron. This shuffling of holes effectively moves a positive charge to the negative contact. The arrival of the electron at the positive contact and the hole at the negative contact produces the electrical signal that is sent to the preamplifier, the MCA, and on through the system for analysis. The movement of electrons and holes in a solid-state detector is very similar to the movement of ions within the sensitive volume of gas-filled detectors such as ionization chambers.
Common semiconductor-based detectors include germanium, cadmium telluride, and cadmium zinc telluride.
Germanium detectors provide significantly improved energy resolution in comparison to sodium iodide detectors, as explained in the preceding discussion of resolution. Germanium detectors produce the highest resolution commonly available today. However, a disadvantage is the requirement of cryogenic temperatures for the operation of germanium detectors, typically by cooling with liquid nitrogen.
Interpretation of measurements
Backscatter peak
In a real detector setup, some photons can and will undergo one or potentially more Compton scattering processes (e.g. in the housing material of the radioactive source, in shielding material or material otherwise surrounding the experiment) before entering the detector material. This leads to a peak structure that can be seen in the above shown energy spectrum of 137
Cs
(Figure 1, the first peak left of the Compton edge), the so-called backscatter peak.
The detailed shape of backscatter peak structure is influenced by many factors, such as the geometry of the experiment (source geometry, relative position of source, shielding and detector) or the type of the surrounding material (giving rise to different ratios of the cross sections of Photo- and Compton-effect).
The basic principle, however, is as follows:
- Gamma-ray sources emit photons isotopically[1]
- Some photons will undergo a Compton scattering process in e.g. the shielding material or the housing of the source with a scattering angle close to 180° and some of these photons will subsequently be detected by the detector.
- The result is a peak structure with approximately the energy of the incident photon minus the energy of the Compton edge.
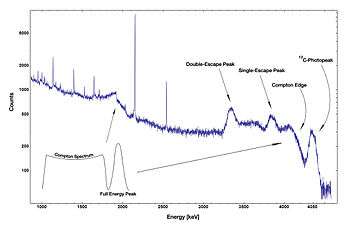
Single escape and double escape peaks
For incident photon energies E larger than two times the rest mass of the electron (1.022 MeV), pair production can happen and the hereby produced positron annihilates with one of the surrounding electrons, typically producing two photons with 511 keV. In a real detector (i.e. a detector of finite size) it is possible that after the annihilation:
- Both photons deposit their energy in the detector.
- One of the two photons escapes the detector and only one of the photons deposits its energy in the detector, resulting in a peak with E - 511 keV, the single escape peak.
- Both photons escape the detector, resulting in a peak with E - 2*511 keV, the double escape peak.
The above Am-Be-source spectrum shows an example of single and double escape peak in a real measurement.
Calibration and background radiation
If a gamma spectrometer is used for identifying samples of unknown composition, its energy scale must be calibrated first. Calibration is performed by using the peaks of a known source, such as caesium-137 or cobalt-60. Because the channel number is proportional to energy, the channel scale can then be converted to an energy scale. If the size of the detector crystal is known, one can also perform an intensity calibration, so that not only the energies but also the intensities of an unknown source—or the amount of a certain isotope in the source—can be determined.
Because some radioactivity is present everywhere (i.e., background radiation), the spectrum should be analyzed when no source is present. The background radiation must then be subtracted from the actual measurement. Lead absorbers can be placed around the measurement apparatus to reduce background radiation.
See also
- Gamma ray spectrometer
- Alpha-particle spectroscopy
- Liquid scintillation counting
- Scintillation counter
- Gamma Probe
- Mass spectrometry
- X-ray spectroscopy
- Isomeric shift
- Pandemonium effect
- Total absorption spectroscopy
Works cited
- Gilmore G, Hemingway J. Practical Gamma-Ray Spectrometry. John Wiley & Sons, Chichester: 1995, ISBN 0-471-95150-1.
- Knoll G, Radiation Detection and Measurement. John Wiley & Sons, Inc. NY:2000, ISBN 0-471-07338-5.
- Nucleonica Wiki. Gamma Spectrum Generator. Accessed 8 October 2008.