Raman spectroscopy
Raman spectroscopy (/ˈrɑːmən/; named after Sir C. V. Raman) is a spectroscopic technique used to observe vibrational, rotational, and other low-frequency modes in a system.[1] Raman spectroscopy is commonly used in chemistry to provide a fingerprint by which molecules can be identified.
It relies on inelastic scattering, or Raman scattering, of monochromatic light, usually from a laser in the visible, near infrared, or near ultraviolet range. The laser light interacts with molecular vibrations, phonons or other excitations in the system, resulting in the energy of the laser photons being shifted up or down. The shift in energy gives information about the vibrational modes in the system. Infrared spectroscopy yields similar, but complementary, information.
Typically, a sample is illuminated with a laser beam. Electromagnetic radiation from the illuminated spot is collected with a lens and sent through a monochromator. Elastic scattered radiation at the wavelength corresponding to the laser line (Rayleigh scattering) is filtered out by either a notch filter, edge pass filter, or a band pass filter, while the rest of the collected light is dispersed onto a detector.
Spontaneous Raman scattering is typically very weak, and as a result the main difficulty of Raman spectroscopy is separating the weak inelastically scattered light from the intense Rayleigh scattered laser light. Historically, Raman spectrometers used holographic gratings and multiple dispersion stages to achieve a high degree of laser rejection. In the past, photomultipliers were the detectors of choice for dispersive Raman setups, which resulted in long acquisition times. However, modern instrumentation almost universally employs notch or edge filters for laser rejection and spectrographs either axial transmissive (AT), Czerny–Turner (CT) monochromator, or FT (Fourier transform spectroscopy based), and CCD detectors.
There are a number of advanced types of Raman spectroscopy, including surface-enhanced Raman, resonance Raman, tip-enhanced Raman, polarized Raman, stimulated Raman (analogous to stimulated emission), transmission Raman, spatially offset Raman, and hyper Raman.
Theoretical basis
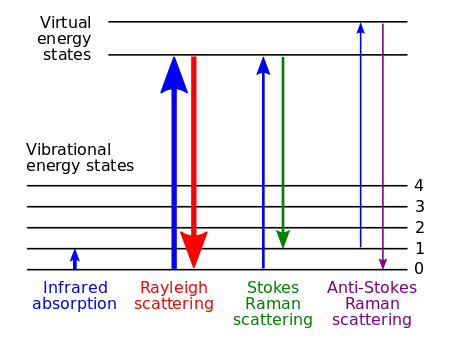
The Raman effect occurs when electromagnetic radiation impinges on a molecule and interacts with the polarizable electron density and the bonds of the molecule in the phase (solid, liquid or gaseous) and environment in which the molecule finds itself. For the spontaneous Raman effect, which is a form of inelastic light scattering, a photon (electromagnetic radiation of a specific wavelength) excites (interacts with) the molecule in either the ground rovibronic state (lowest rotational and vibrational energy level of the ground electronic state) or an excited rovibronic state. This results in the molecule being in a so-called virtual energy state for a short period of time before an inelastically scattered photon results. The resulting inelastically scattered photon which is "emitted"/"scattered" can be of either lower (Stokes) or higher (anti-Stokes) energy than the incoming photon. In Raman scattering the resulting rovibronic state of the molecule is a different rotational or vibrational state than the one in which the molecule was originally, before interacting with the incoming photon (electromagnetic radiation). The difference in energy between the original rovibronic state and this resulting rovibronic state leads to a shift in the emitted photon's frequency away from the excitation wavelength, the so-called Rayleigh line. The Raman effect is due to inelastic scattering and should not be confused with emission (fluorescence or phosphorescence) where a molecule in an excited electronic state emits a photon of energy and returns to the ground electronic state, in many cases to a vibrationally excited state on the ground electronic state potential energy surface.
If the final vibrational state of the molecule is more energetic than the initial state, the inelastically scattered photon will be shifted to a lower frequency for the total energy of the system to remain balanced. This shift in frequency is designated as a Stokes shift. If the final vibrational state is less energetic than the initial state, then the inelastically scattered photon will be shifted to a higher frequency, and this is designated as an anti-Stokes shift. Raman scattering is an example of inelastic scattering because the energy and momentum transfer between the photons and the molecules during the interaction results in a difference in energy between the incident and scattered photons. In particular, the difference is equal to the difference in energy between the initial and final (rovibronic) states. This contrasts with infrared absorption, where the energy of the single absorbed photon matches this difference in energy (between those same two states). Rayleigh scattering is an example of elastic scattering, where the frequency (wavelength) of the Rayleigh scattered light is the same as that of the incoming electromagnetic radiation.
A change in the molecular electric dipole-electric dipole polarizability with respect to the vibrational coordinate corresponding to the rovibronic state is required for a molecule to exhibit a Raman effect. The intensity of the Raman scattering is proportional to the electric dipole-electric dipole polarizability change. The Raman spectra (Raman scattering intensity as a function of the Stokes and anti-Stokes frequency shifts) is dependent on the rovibronic (rotational and vibrational energy levels of the ground electronic state) states of the sample. This dependence on the electric dipole-electric dipole polarizability derivative differs from infrared spectroscopy where the interaction between the molecule and light is determined by the electric dipole moment derivative, the so-called atomic polar tensor (APT); this contrasting feature allows one to analyze transitions that might not be IR active via Raman spectroscopy, as exemplified by the rule of mutual exclusion in centrosymmetric molecules. Bands which have large Raman intensities in many cases have weak infrared intensities and vice versa. For very symmetric molecules, certain vibrations may be both infrared and Raman inactive (within the harmonic approximation). In those instances, one can use a technique called inelastic incoherent neutron scattering to determine the vibrational frequencies. The selection rules for inelastic incoherent neutron scattering (IINS) are different from those of both infrared and Raman scattering. Hence the three types of vibrational spectroscopy are complementary, all giving in theory the same frequency for a given vibrational transition, but the relative intensities giving different information due to the types of interaction between the molecule and the electromagnetic radiation for infrared and Raman spectroscopy and with the neutron beam for IINS.
History
Although the inelastic scattering of light was predicted by Adolf Smekal in 1923,[2] it was not until 1928 that it was observed in practice. The Raman effect was named after one of its discoverers, the Indian scientist Sir C. V. Raman who observed the effect by means of sunlight (1928, together with K. S. Krishnan and independently by Grigory Landsberg and Leonid Mandelstam).[1] Raman won the Nobel Prize in Physics in 1930 for this discovery accomplished using sunlight, a narrow band photographic filter to create monochromatic light, and a "crossed filter" to block this monochromatic light. He found that a small amount of light had changed frequency and passed through the "crossed" filter.
Systematic pioneering theory of the Raman effect was developed by Czechoslovak physicist George Placzek between 1930 and 1934.[3] The mercury arc became the principal light source, first with photographic detection and then with spectrophotometric detection.
In the years following its discovery, Raman spectroscopy was used to provide the first catalog of molecular vibrational frequencies. Originally, heroic measures were required to obtain Raman spectra due to the low sensitivity of the technique. Typically, the sample was held in a long tube and illuminated along its length with a beam of filtered monochromatic light generated by a gas discharge lamp. The photons that were scattered by the sample were collected through an optical flat at the end of the tube. To maximize the sensitivity, the sample was highly concentrated (1 M or more) and relatively large volumes (5 mL or more) were used. Consequently, the use of Raman spectroscopy dwindled when commercial IR spectrophotometers became available in the 1940s. However, the advent of the laser in the 1960s resulted in simplified Raman spectroscopy instruments and also boosted the sensitivity of the technique. This has revived the use of Raman spectroscopy as a common analytical technique.
Raman shift
Raman shifts are typically reported in wavenumbers, which have units of inverse length, as this value is directly related to energy. In order to convert between spectral wavelength and wavenumbers of shift in the Raman spectrum, the following formula can be used:

where is the Raman shift expressed in wavenumber, λ0 is the excitation wavelength, and λ1 is the Raman spectrum wavelength. Most commonly, the unit chosen for expressing wavenumber in Raman spectra is inverse centimeters (cm−1). Since wavelength is often expressed in units of nanometers (nm), the formula above can scale for this unit conversion explicitly, giving


Applications
Raman spectroscopy is commonly used in chemistry, since vibrational information is specific to the chemical bonds and symmetry of molecules. Therefore, it provides a fingerprint by which the molecule can be identified. For instance, the vibrational frequencies of SiO, Si2O2, and Si3O3 were identified and assigned on the basis of normal coordinate analyses using infrared and Raman spectra.[4] The fingerprint region of organic molecules is in the (wavenumber) range 500–2000 cm−1. Another way that the technique is used is to study changes in chemical bonding, as when a substrate is added to an enzyme.
Raman spectroscopy is a very efficient and non-destructive method for investigation of works of art.[5] Identification of individual pigments and their degradation products leads to insights into the working method of the artist and allows to gain information about the original state of the painting at the time of its creation in cases where the pigments were degraded with age.[6]
Raman gas analyzers have many practical applications. For instance, they are used in medicine for real-time monitoring of anesthetic and respiratory gas mixtures during surgery.
In solid state chemistry and the bio-pharmaceutical industry, Raman spectroscopy can be used to not only identify (ID) active pharmaceutical ingredients (APIs), but in the case of multiple polymorphic forms, it can also be used to identify the polymorphic form of the API. For example, there are 4 different polymorphic forms of the API (aztreonam) in Cayston, a drug marketed by Gilead Sciences for cystic fibrosis.[7] Both infrared and Raman spectroscopy can be used to identify and characterize the API which is used in the formulation of Cayston. In bio-pharmaceutical formulations, one must use not only the correct molecule, but the correct polymorphic form, as different polymorphic forms have different physical properties, for example, solubility, melting point, and Raman/infrared spectra.
In solid-state physics, spontaneous Raman spectroscopy is used to, among other things, characterize materials, measure temperature, and find the crystallographic orientation of a sample. As with single molecules, a given solid material has characteristic phonon modes that can help an experimenter identify it. In addition, Raman spectroscopy can be used to observe other low frequency excitations of the solid, such as plasmons, magnons, and superconducting gap excitations. The spontaneous Raman signal gives information on the population of a given phonon mode in the ratio between the Stokes (downshifted) intensity and anti-Stokes (upshifted) intensity.
Raman scattering by an anisotropic crystal gives information on the crystal orientation. The polarization of the Raman scattered light with respect to the crystal and the polarization of the laser light can be used to find the orientation of the crystal, if the crystal structure (to be specific, its point group) is known.
Raman spectroscopy is the basis for distributed temperature sensing (DTS) along optical fibers, which uses the Raman-shifted backscatter from laser pulses to determine the temperature along optical fibers.
Raman active fibers, such as aramid and carbon, have vibrational modes that show a shift in Raman frequency with applied stress. Polypropylene fibers also exhibit similar shifts. The radial breathing mode is a commonly used technique to evaluate the diameter of carbon nanotubes. In nanotechnology, a Raman microscope can be used to analyze nanowires to better understand the composition of the structures.
Spatially offset Raman spectroscopy (SORS), which is less sensitive to surface layers than conventional Raman, can be used to discover counterfeit drugs without opening their packaging, and for non-invasive monitoring of biological tissue.[8] Raman spectroscopy can be used to investigate the chemical composition of historical documents such as the Book of Kells and contribute to knowledge of the social and economic conditions at the time the documents were produced.[9] This is especially helpful because Raman spectroscopy offers a non-invasive way to determine the best course of preservation or conservation treatment for such materials.
Several research projects demonstrated usage of Raman spectroscopy as a means to detect explosives using laser beams from safe distance (Portendo, 2008,[10] TU Vienna, 2012[11]).[12]
Raman spectroscopy has also been used to confirm the prediction of existence of low-frequency phonons[13] in proteins and DNA,[14][15][16][17] greatly stimulating the studies of low-frequency collective motion in proteins and DNA and their biological functions.[18][19]
Raman reporter molecules with olefin or alkyne moieties are being developed to allow for tissue imaging with SERS-labeled antibodies.[20] Raman spectroscopy has also been used as a noninvasive technique for real-time, in situ biochemical characterization of healing wounds and multivariate analysis of Raman spectra has enabled a quantitative measure of wound healing progress.[21] Raman spectroscopy has a wide usage in studies of biominerals.[22]
Microspectroscopy
Raman spectroscopy offers several advantages for microscopic analysis. Since it is a scattering technique, specimens do not need to be fixed or sectioned. Raman spectra can be collected from a very small volume (< 1 µm in diameter); these spectra allow the identification of species present in that volume. Water does not generally interfere with Raman spectral analysis. Thus, Raman spectroscopy is suitable for the microscopic examination of minerals, materials such as polymers and ceramics, cells, proteins and forensic trace evidence. A Raman microscope begins with a standard optical microscope, and adds an excitation laser, a monochromator, and a sensitive detector (such as a charge-coupled device (CCD), or photomultiplier tube (PMT)). FT-Raman has also been used with microscopes. Ultraviolet microscopes and UV enhanced optics must be used when a UV laser source is used for Raman microspectroscopy.
In direct imaging, the whole field of view is examined for scattering over a small range of wavenumbers (Raman shifts). For instance, a wavenumber characteristic for cholesterol could be used to record the distribution of cholesterol within a cell culture.
The other approach is hyperspectral imaging or chemical imaging, in which thousands of Raman spectra are acquired from all over the field of view. The data can then be used to generate images showing the location and amount of different components. Taking the cell culture example, a hyperspectral image could show the distribution of cholesterol, as well as proteins, nucleic acids, and fatty acids. Sophisticated signal- and image-processing techniques can be used to ignore the presence of water, culture media, buffers, and other interference.
Raman microscopy, and in particular confocal microscopy, has very high spatial resolution. For example, the lateral and depth resolutions were 250 nm and 1.7 µm, respectively, using a confocal Raman microspectrometer with the 632.8 nm line from a helium–neon laser with a pinhole of 100 µm diameter. Since the objective lenses of microscopes focus the laser beam to several micrometres in diameter, the resulting photon flux is much higher than achieved in conventional Raman setups. This has the added benefit of enhanced fluorescence quenching. However, the high photon flux can also cause sample degradation, and for this reason some setups require a thermally conducting substrate (which acts as a heat sink) in order to mitigate this process.
Another approach called global Raman imaging[24] uses complete monochromatic images instead of reconstruction of images from acquired spectra. This technique is being used for the characterization of large scale devices, mapping of different compounds and dynamics study. It has already been use for the characterization of graphene layers,[25] J-aggregated dyes inside carbon nanotubes[26] and multiple other 2D materials such as MoS2 and WSe2. Since the excitation beam is dispersed over the whole field of view, those measurements can be done without damaging the sample.
By using Raman microspectroscopy, in vivo time- and space-resolved Raman spectra of microscopic regions of samples can be measured. As a result, the fluorescence of water, media, and buffers can be removed. Consequently, in vivo time- and space-resolved Raman spectroscopy is suitable to examine proteins, cells and organs.
Raman microscopy for biological and medical specimens generally uses near-infrared (NIR) lasers (785 nm diodes and 1064 nm Nd:YAG are especially common). The use of these lower energy wavelengths reduces the risk of damaging the specimen. However, the intensity of NIR Raman is low (owing to the ω4 dependence of Raman scattering intensity), and most detectors require very long collection times. Recently, more sensitive detectors have become available, making the technique better suited to general use. Raman microscopy of inorganic specimens, such as rocks and ceramics and polymers, can use a broader range of excitation wavelengths.[27]
Polarized analysis
The polarization of the Raman scattered light also contains useful information. This property can be measured using (plane) polarized laser excitation and a polarization analyzer. Spectra acquired with the analyzer set at both perpendicular and parallel to the excitation plane can be used to calculate the depolarization ratio. Study of the technique is useful in teaching the connections between group theory, symmetry, Raman activity, and peaks in the corresponding Raman spectra.[28] Polarized light only gives access to some of the Raman active modes. By rotating the polarization you can gain access to the other modes. Each mode is separated according to its symmetry.[29]
The spectral information arising from this analysis gives insight into molecular orientation and vibrational symmetry. In essence, it allows the user to obtain valuable information relating to the molecular shape, for example in synthetic chemistry or polymorph analysis. It is often used to understand macromolecular orientation in crystal lattices, liquid crystals or polymer samples.[30]
It is convenient in polarised Raman spectroscopy to describe the propagation and polarisation directions using Porto's notation,[31] described by and named after Brazilian physicist Sergio Pereira da Silva Porto.
Variants
Several variations of Raman spectroscopy have been developed. The usual purpose is to enhance the sensitivity (e.g., surface-enhanced Raman), to improve the spatial resolution (Raman microscopy), or to acquire very specific information (resonance Raman).
- Surface-enhanced Raman spectroscopy (SERS) – Normally done in a silver or gold colloid or a substrate containing silver or gold. Surface plasmons of silver and gold are excited by the laser, resulting in an increase in the electric fields surrounding the metal. Given that Raman intensities are proportional to the electric field, there is large increase in the measured signal (by up to 1011). This effect was originally observed by Martin Fleischmann but the prevailing explanation was proposed by Van Duyne in 1977.[32] A comprehensive theory of the effect was given by Lombardi and Birke.[33]
- Resonance Raman spectroscopy – The excitation wavelength is matched to an electronic transition of the molecule or crystal, so that vibrational modes associated with the excited electronic state are greatly enhanced. This is useful for studying large molecules such as polypeptides, which might show hundreds of bands in "conventional" Raman spectra. It is also useful for associating normal modes with their observed frequency shifts.[34]
- Surface-enhanced resonance Raman spectroscopy (SERRS) – A combination of SERS and resonance Raman spectroscopy that uses proximity to a surface to increase Raman intensity, and excitation wavelength matched to the maximum absorbance of the molecule being analysed.
- Angle-resolved Raman spectroscopy – Not only are standard Raman results recorded but also the angle with respect to the incident laser. If the orientation of the sample is known then detailed information about the phonon dispersion relation can also be gleaned from a single test.[35]
- Hyper Raman – A non-linear effect in which the vibrational modes interact with the second harmonic of the excitation beam. This requires very high power, but allows the observation of vibrational modes that are normally "silent". It frequently relies on SERS-type enhancement to boost the sensitivity.[36]
- Spontaneous Raman spectroscopy (SRS) – Used to study the temperature dependence of the Raman spectra of molecules.
- Optical tweezers Raman spectroscopy (OTRS) – Used to study individual particles, and even biochemical processes in single cells trapped by optical tweezers.
- Stimulated Raman spectroscopy – A spatially coincident, two color pulse (with polarization either parallel or perpendicular) transfers the population from ground to a rovibrationally excited state, if the difference in energy corresponds to an allowed Raman transition, and if neither frequency corresponds to an electronic resonance. Two photon UV ionization, applied after the population transfer but before relaxation, allows the intra-molecular or inter-molecular Raman spectrum of a gas or molecular cluster (indeed, a given conformation of molecular cluster) to be collected. This is a useful molecular dynamics technique.
- Spatially offset Raman spectroscopy (SORS) – The Raman scattering beneath an obscuring surface is retrieved from a scaled subtraction of two spectra taken at two spatially offset points
- Coherent anti-Stokes Raman spectroscopy (CARS) – Two laser beams are used to generate a coherent anti-Stokes frequency beam, which can be enhanced by resonance.
- Raman optical activity (ROA) – Measures vibrational optical activity by means of a small difference in the intensity of Raman scattering from chiral molecules in right- and left-circularly polarized incident light or, equivalently, a small circularly polarized component in the scattered light.[37]
- Transmission Raman – Allows probing of a significant bulk of a turbid material, such as powders, capsules, living tissue, etc. It was largely ignored following investigations in the late 1960s (Schrader and Bergmann, 1967)[38] but was rediscovered in 2006 as a means of rapid assay of pharmaceutical dosage forms.[39] There are medical diagnostic applications particularly in the detection of cancer.[12][40][41]
- Inverse Raman spectroscopy.
- Tip-enhanced Raman spectroscopy (TERS) – Uses a metallic (usually silver-/gold-coated AFM or STM) tip to enhance the Raman signals of molecules situated in its vicinity. The spatial resolution is approximately the size of the tip apex (20–30 nm). TERS has been shown to have sensitivity down to the single molecule level and holds some promise for bioanalysis applications.[42]
- Surface plasmon polariton enhanced Raman scattering (SPPERS) – This approach exploits apertureless metallic conical tips for near field excitation of molecules. This technique differs from the TERS approach due to its inherent capability of suppressing the background field. In fact, when an appropriate laser source impinges on the base of the cone, a TM0 mode[43] (polaritonic mode) can be locally created, namely far away from the excitation spot (apex of the tip). The mode can propagate along the tip without producing any radiation field up to the tip apex where it interacts with the molecule. In this way, the focal plane is separated from the excitation plane by a distance given by the tip length, and no background plays any role in the Raman excitation of the molecule.[44][45][46][47]
- Micro-cavity substrates – A method that improves the detection limit of conventional Raman spectra using micro-Raman in a micro-cavity coated with reflective Au or Ag. The micro-cavity has a radius of several micrometers and enhances the entire Raman signal by providing multiple excitations of the sample and couples the forward-scattered Raman photons toward the collection optics in the back-scattered Raman geometry.[48]
- Stand-off remote Raman. In standoff Raman, the sample is measured at a distance from the Raman spectrometer, usually by using a telescope for light collection. Remote Raman spectroscopy was proposed in the 1960s[49] and initially developed for the measurement of atmospheric gases.[50] The technique was extended In 1992 by Angel et al. for standoff Raman detection of hazardous inorganic and organic compounds.[51] Standoff Raman detection offers a fast-Raman mode of analyzing large areas such as a football field in minutes. A pulsed laser source and gated detector allow Raman spectra measurements in the daylight[52] and reduces the long-lived fluorescent background generated by transition ions and rare earth ions. Another way to avoid fluorescence, first demonstrated by Sandy Asher in 1984, is to use a UV laser probe beam. At wavelengths of 260 nm, there is effectively no fluorescence interference and the UV signal is inherently strong.[12][53][54] A 10X beam expander mounted in front of the laser allows focusing of the beam and a telescope is directly coupled through the camera lens for signal collection. With the system's time-gating capability it is possible to measure remote Raman of your distant target and the atmosphere between the laser and target.[12]
See also
References
- 1 2 Gardiner, D.J. (1989). Practical Raman spectroscopy. Springer-Verlag. ISBN 978-0-387-50254-0.
- ↑ Smekal, A. (1923). "Zur Quantentheorie der Dispersion". Die Naturwissenschaften. 11 (43): 873–875. doi:10.1007/BF01576902.
- ↑ Placzek G. (1934) "Rayleigh Streuung und Raman Effekt", In: Hdb. der Radiologie, Vol. VI., 2, p. 209
- ↑ Khanna, R.K. (1981). "Raman-spectroscopy of oligomeric SiO species isolated in solid methane". Journal of Chemical Physics. 74 (4): 2108. Bibcode:1981JChPh..74.2108K. doi:10.1063/1.441393.
- ↑ Howell G. M. Edwards, John M. Chalmers, Raman Spectroscopy in Archaeology and Art History, Royal Society of Chemistry, 2005
- ↑ Raman Spectroscopy at ColourLex
- ↑ "FDA approves Gilead cystic fibrosis drug Cayston". BusinessWeek. February 23, 2010. Retrieved 2010-03-05.
- ↑ "Fake drugs caught inside the pack". BBC News. 2007-01-31. Retrieved 2008-12-08.
- ↑ Quinn, Eamon (May 28, 2007) Irish classic is still a hit (in calfskin, not paperback). New York Times
- ↑ Ben Vogel (29 August 2008). "Raman spectroscopy portends well for standoff explosives detection". Jane's. Archived from the original on 2008-12-03. Retrieved 2008-08-29.
- ↑ "Finding explosives with laser beams", a TU Vienna press-release
- 1 2 3 4 Misra, Anupam K.; Sharma, Shiv K.; Acosta, Tayro E.; Porter, John N.; et al. (2012). "Single-Pulse Standoff Raman Detection of Chemicals from 120 m Distance During Daytime". Applied Spectroscopy. 66 (11): 1279–85. doi:10.1366/12-06617. PMID 23146183.
- ↑ Chou, Kuo-Chen; Chen, Nian-Yi (1977). "The biological functions of low-frequency phonons". Scientia Sinica. 20 (3): 447–457.
- ↑ Urabe, H.; Tominaga, Y.; Kubota, K. (1983). "Experimental evidence of collective vibrations in DNA double helix Raman spectroscopy". Journal of Chemical Physics. 78 (10): 5937–5939. Bibcode:1983JChPh..78.5937U. doi:10.1063/1.444600.
- ↑ Chou, K.C. (1983). "Identification of low-frequency modes in protein molecules". Biochemical Journal. 215 (3): 465–469. doi:10.1042/bj2150465. PMC 1152424
 . PMID 6362659.
 - ↑ Chou, K.C. (1984). "Low-frequency vibration of DNA molecules". Biochemical Journal. 221 (1): 27–31. doi:10.1042/bj2210027. PMC 1143999. PMID 6466317.
- ↑ Urabe, H.; Sugawara, Y.; Ataka, M.; Rupprecht, A. (1998). "Low-frequency Raman spectra of lysozyme crystals and oriented DNA films: dynamics of crystal water". Biophys J. 74 (3): 1533–1540. doi:10.1016/s0006-3495(98)77865-8. PMC 1299499. PMID 9512049.
- ↑ Chou, Kuo-Chen (1988). "Review: Low-frequency collective motion in biomacromolecules and its biological functions". Biophysical Chemistry. 30 (1): 3–48. doi:10.1016/0301-4622(88)85002-6. PMID 3046672.
- ↑ Chou, K.C. (1989). "Low-frequency resonance and cooperativity of hemoglobin". Trends in Biochemical Sciences. 14 (6): 212–3. doi:10.1016/0968-0004(89)90026-1. PMID 2763333.
- ↑ Schlücker, S.; et al. (2011). "Design and synthesis of Raman reporter molecules for tissue imaging by immuno-SERS microscopy". Journal of Biophotonics. 4 (6): 453–463. doi:10.1002/jbio.201000116. PMID 21298811.
- ↑ Jain, R.; et al. (2014). "Raman Spectroscopy Enables Noninvasive Biochemical Characterization and Identification of the Stage of Healing of a Wound". Analytical Chemistry. 86 (8): 3764–3772. doi:10.1021/ac500513t. PMC 4004186. PMID 24559115.
- ↑ Taylor, P.D.; Vinn, O.; Kudryavtsev, A.; Schopf, J.W. (2010). "Raman spectroscopic study of the mineral composition of cirratulid tubes (Annelida, Polychaeta)". Journal of Structural Biology. 171 (3): 402–405. doi:10.1016/j.jsb.2010.05.010. PMID 20566380. Retrieved 2014-06-10.
- ↑ Li, Xufan; Lin, Ming-Wei; Puretzky, Alexander A.; Idrobo, Juan C.; Ma, Cheng; Chi, Miaofang; Yoon, Mina; Rouleau, Christopher M.; Kravchenko, Ivan I.; Geohegan, David B.; Xiao, Kai (2014). "Controlled Vapor Phase Growth of Single Crystalline, Two-Dimensional Ga Se Crystals with High Photoresponse". Scientific Reports. 4. doi:10.1038/srep05497.
- ↑ Marcet, S.; Verhaegen, M.; Blais-Ouellette, S.; Martel, R. (2012). "Raman Spectroscopy hyperspectral imager based on Bragg Tunable Filters". SPIE Photonics North. Photonics North 2012. 8412: 84121J. doi:10.1117/12.2000479.
- ↑ Robin W. Havener; et al. (December 2011). "High-Throughput Graphene Imaging on Arbitrary Substrates with Widefield Raman Spectroscopy". ACS Nano. 6 (1): 373–80. doi:10.1021/nn2037169. PMID 22206260.
- ↑ Gaufrès, E.; Tang, N. Y.-Wa; Lapointe, F.; Cabana, J.; Nadon, M.-A.; Cottenye, N.; Raymond, F.; Szkopek, T.; Martel, R. (2014). "Giant Raman scattering from J-aggregated dyes inside carbon nanotubes for multispectral imaging". Nature Photonics. 8: 72–78. doi:10.1038/nphoton.2013.309.
- ↑ Ellis DI; Goodacre R (August 2006). "Metabolic fingerprinting in disease diagnosis: biomedical applications of infrared and Raman spectroscopy". Analyst. 131 (8): 875–85. Bibcode:2006Ana...131..875E. doi:10.1039/b602376m. PMID 17028718.
- ↑ Itoh, Yuki; Hasegawa, Takeshi (May 2, 2012). "Polarization Dependence of Raman Scattering from a Thin Film Involving Optical Anisotropy Theorized for Molecular Orientation Analysis". The Journal of Physical Chemistry A. 116 (23): 5560–5570. doi:10.1021/jp301070a. PMID 22551093.
- ↑ Iliev, M. N.; Abrashev, M. V.; Laverdiere, J.; Jandi, S.; et al. (February 16, 2006). "Distortion-dependent Raman spectra and mode mixing in RMnO3 perovskites (R=La,Pr,Nd,Sm,Eu,Gd,Tb,Dy,Ho,Y)". Physical Review B.
- ↑ Khanna, R.K. (1957). Evidence of ion-pairing in the polarized Raman spectra of a Ba2+CrO doped KI single crystal. John Wiley & Sons, Ltd. doi:10.1002/jrs.1250040104.
- ↑ Porto's notation Bilbao Crystallographic → Raman scattering
- ↑ Jeanmaire DL; van Duyne RP (1977). "Surface Raman Electrochemistry Part I. Heterocyclic, Aromatic and Aliphatic Amines Adsorbed on the Anodized Silver Electrode". Journal of Electroanalytical Chemistry. Elsevier Sequouia S.A. 84: 1–20. doi:10.1016/S0022-0728(77)80224-6.
- ↑ Lombardi JR; Birke RL (2008). "A Unified Approach to Surface-Enhanced Raman Spectroscopy". [Journal of Physical Chemistry C]. American Chemical Society. 112 (14): 5605–5617. doi:10.1021/jp800167v.
- ↑ Chao RS; Khanna RK; Lippincott ER (1974). "Theoretical and experimental resonance Raman intensities for the manganate ion". J Raman Spectroscopy. 3 (2–3): 121–131. Bibcode:1975JRSp....3..121C. doi:10.1002/jrs.1250030203.
- ↑ Zachary J. Smith & Andrew J. Berger (2008). "Integrated Raman- and angular-scattering microscopy". Opt. Lett. 3 (7): 714–716. Bibcode:2008OptL...33..714S. doi:10.1364/OL.33.000714.
- ↑ Kneipp K; et al. (1999). "Surface-Enhanced Non-Linear Raman Scattering at the Single Molecule Level". Chem. Phys. 247: 155–162. Bibcode:1999CP....247..155K. doi:10.1016/S0301-0104(99)00165-2.
- ↑ Barron LD; Hecht L; McColl IH; Blanch EW (2004). "Raman optical activity comes of age". Molec. Phys. 102 (8): 731–744. Bibcode:2004MolPh.102..731B. doi:10.1080/00268970410001704399.
- ↑ Schrader, Bernhard; Bergmann, Gerhard (1967). "Die Intensität des Ramanspektrums polykristalliner Substanzen". Fresenius' Zeitschrift für Analytische Chemie. 225 (2): 230–247. doi:10.1007/BF00983673. ISSN 0016-1152.
- ↑ Matousek, P.; Parker, A. W. (2006). "Bulk Raman Analysis of Pharmaceutical Tablets". Applied Spectroscopy. 60 (12): 1353–1357. Bibcode:2006ApSpe..60.1353M. doi:10.1366/000370206779321463. PMID 17217583.
- ↑ Matousek, P.; Stone, N. (2007). "Prospects for the diagnosis of breast cancer by noninvasive probing of calcifications using transmission Raman spectroscopy". Journal of Biomedical Optics. 12 (2): 024008. Bibcode:2007JBO....12b4008M. doi:10.1117/1.2718934. PMID 17477723.
- ↑ Kamemoto, Lori E.; Misra, Anupam K.; Sharma, Shiv K.; Goodman, Hugh Luk; et al. (December 4, 2009). "Near-Infrared Micro-Raman Spectroscopy for in Vitro Detection of Cervical Cancer". Applied Spectroscopy. 64 (3): 255–61. doi:10.1366/000370210790918364. PMC 2880181. PMID 20223058.
- ↑ Hermann, P; Hermeling, A; Lausch, V; Holland, G; Möller, L; Bannert, N; Naumann, D (2011). "Evaluation of tip-enhanced Raman spectroscopy for characterizing different virus strains". Analyst. 136 (2): 1148–1152. doi:10.1039/C0AN00531B.
- ↑ Novotny, L; Hafner, C (1994). "Light propagation in a cylindrical waveguide with a complex, metallic, dielectric function". Physical Review E. 50 (5): 4094–4106. Bibcode:1994PhRvE..50.4094N. doi:10.1103/PhysRevE.50.4094.
- ↑ De Angelis, F; Das, G; Candeloro, P; Patrini, M; et al. (2010). "Nanoscale chemical mapping using three-dimensional adiabatic compression of surface plasmon polaritons". Nature Nanotechnology. 5 (1): 67–72. Bibcode:2010NatNa...5...67D. doi:10.1038/nnano.2009.348. PMID 19935647.
- ↑ De Angelis, F; Proietti Zaccaria, R; Francardi, M; Liberale, C; et al. (2011). "Multi-scheme approach for efficient surface plasmon polariton generation in metallic conical tips on AFM-based cantilevers". Optics Express. 19 (22): 22268. Bibcode:2011OExpr..1922268D. doi:10.1364/OE.19.022268.
- ↑ Proietti Zaccaria, R; Alabastri, A; De Angelis, F; Das, G; et al. (2012). "Fully analytical description of adiabatic compression in dissipative polaritonic structures". Physical Review B. 86 (3): 035410. Bibcode:2012PhRvB..86c5410P. doi:10.1103/PhysRevB.86.035410.
- ↑ Proietti Zaccaria, R; De Angelis, F; Toma, A; Razzari, L; et al. (2012). "Surface plasmon polariton compression through radially and linearly polarized source". Optics Letters. 37 (4): 545. Bibcode:2012OptL...37..545Z. doi:10.1364/OL.37.000545.
- ↑ Misra, Anupam K.; Sharma, Shiv K.; Kamemoto, Lori; Zinin, Pavel V.; et al. (December 8, 2008). "Novel Micro-Cavity Substrates for Improving the Raman Signal from Submicrometer Size Materials". Applied Spectroscopy. 63 (3): 373–7. doi:10.1366/000370209787598988. PMID 19281655.
- ↑ Cooney, J. (1965). Proceedings of the MRI Symposium on Electromagnetic Sensing of the Earth from Satellites, J. Fox, Ed. Missing or empty
|title=(help) - ↑ Leonard, Donald A. (1967). "Observation of Raman Scattering from the Atmosphere using a Pulsed Nitrogen Ultraviolet Laser". Nature. 216 (5111): 142–143. doi:10.1038/216142a0.
- ↑ Angel, S. M.; Kulp, Thomas J.; Vess, Thomas M. (1992). "Remote-Raman Spectroscopy at Intermediate Ranges Using Low-Power cw Lasers". Applied Spectroscopy. 46 (7): 1085–1091. doi:10.1366/0003702924124132.
- ↑ Carter, J. C.; Angel, S. M.; Lawrence-Snyder, M; Scaffidi, J; Whipple, R. E.; Reynolds, J. G. (2005). "Standoff detection of high explosive materials at 50 meters in ambient light conditions using a small Raman instrument". Applied Spectroscopy. 59 (6): 769–75. doi:10.1366/0003702054280612. PMID 16053543.
- ↑ Gaft, M.; Panczer, M.G.; Reisfeld, R.; Uspensky, E. (2001). "Laser-induced timeresolved luminescence as a tool for rare-earth element identification in minerals". Phys. Chem. Minerals. 28 (5): 347–363. doi:10.1007/s002690100163.
- ↑ Waychunas, G.A. (1988). "Luminescence, x-ray emission and new spectroscopies". Reviews in Mineralogy Mineralogical Society of America. 18.
External links
- DoITPoMS Teaching and Learning Package – Raman Spectroscopy – an introduction to Raman spectroscopy, aimed at undergraduate level.
- Raman spectroscopy in analysis of paintings, ColourLex