List of countries by natural gas proven reserves
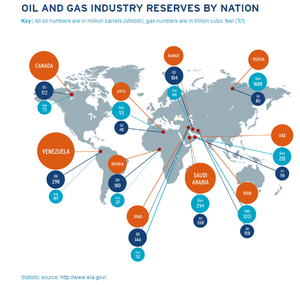

This is a list of countries by natural gas proven reserves based on The World Factbook (when no citation is given).[1] or other authoritative third-party sources (as cited). Based on data from BP, at the end of 2009, proved gas reserves were dominated by three countries: Iran, Russia, and Qatar, which together held nearly half the world's proven reserves.[2]
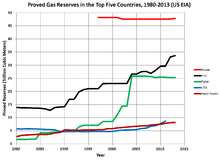
There is some disagreement on which country has the largest proven gas reserves. Sources that consider that Russia has by far the largest proven reserves include the US CIA (47.6 trillion cubic meters),[3] the US Energy Information Administration (49 tcm),[4] and OPEC (48.7 tcm).[5] However, BP credits Russia with only 32.9 tcm,[6] which would place it in second place, slightly behind Iran (33.1 to 33.8 tcm, depending on the source).
Due to constant announcements of shale gas recoverable reserves, as well as drilling in Central Asia, South America and Africa, deepwater drilling, estimates are undergoing frequent updates, mostly increasing. Since 2000, some countries, notably the US and Canada, have seen large increases in proved gas reserves due to development of shale gas, but shale gas deposits in most countries are yet to be added to reserve calculations.
| Rank | Country/Region | Natural gas proven reserves (m³) | Date of information |
|---|---|---|---|
| Total | World | 187,300,000,000,000 | |
| 1 | 48,700,000,000,000 | 12 June 2013 est.[5] | |
| 2 | 33,600,000,000,000 | 12 June 2013 est.[7] | |
| 3 | 24,700,000,000,000 | June 2014.[8] | |
| 4 | 17,500,000,000,000 | June 2014.[8] | |
| 5 | 9,860,000,000,000 | 12 December 2013[9][10] | |
| 6 | 8,600,000,000,000 | June 2014.[8] | |
| 7 | 6,400,000,000,000 | 1 January 2012 est.[11] | |
| 8 | 5,724,500,000,000 | 19 July 2011[12] | |
| 9 | 5,100,000,000,000 | June 2014.[8] | |
| 10 | 4,643,000,000,000 | 1 January 2015[9] | |
| 11 | 4,502,000,000,000 | 1 January 2010 est. | |
| 12 | 4,300,000,000,000 | 1 January 2014 est.[11] | |
| 13 | 3,001,000,000,000 | 1 January 2010 est. | |
| 14 | 2,600,000,000,000 | 1 January 2016 est.[13] | |
| 15 | 2,350,000,000,000 | 1 January 2010 est. | |
| 16 | 2,313,000,000,000 | 1 January 2010 est. | |
| 17 | 2,250,000,000,000 | 1 January 2010 est. | |
| 18 | 1,900,000,000,000 | 12 June 2013 est.[14] | |
| 19 | 1,841,000,000,000 | 1 January 2010 est. | |
| 20 | 1,798,000,000,000 | 1 January 2010 est. | |
| 21 | 1,754,000,000,000 | 1 January 2010 est. | |
| 22 | 1,656,000,000,000 | 1 January 2010 est. | |
| 23 | 1,614,060,000,000 | 1 January 2016 est.[15][16] | |
| 24 | 1,539,000,000,000 | 1 January 2010 est. | |
| 25 | 1,416,000,000,000 | 1 January 2010 est. | |
| 26 | 1,104,000,000,000 | 1 January 2014 est. | |
| 27 | 4,232,000,000,000 | 31 March 2016 est. [17] | |
| 28 | 849,500,000,000 | 1 January 2010 est. | |
| 29 | 754,000,000,000 | 1 January 2014 est.[9] | |
| 30 | 750,400,000,000 | 1 January 2010 est. | |
| 31 | 726,000,000,000 | 1 January 2013 est. | |
| 32 | 478,500,000,000 | 1 January 2010 est. | |
| 33 | 436,100,000,000 | 1 January 2010 est. | |
| 34 | 430,000,000,000 | 1 January 2014 est. | |
| 35 | 390,800,000,000 | 1 January 2010 est. | |
| 36 | 364,200,000,000 | 1 January 2010 est. | |
| 37 | 359,700,000,000 | 1 January 2010 est. | |
| 38 | 342,000,000,000 | 1 January 2010 est. | |
| 39 | 377,000,000,000 | 1 January 2011 est.[18] | |
| 40 | 334,100,000,000 | 1 January 2010 est. | |
| 41 | 292,000,000,000 | 1 January 2010 est. | |
| 42 | 283,200,000,000 | 1 January 2010 est. | |
| 43 | 281,000,000,000 | 1 January 2015[19][20] | |
| 44 | 271,800,000,000 | 1 January 2010 est. | |
| 45 | 240,700,000,000 | 1 January 2010 est. | |
| 46 | 226,500,000,000 | 1 January 2010 est. | |
| 47 | 200,000,000,000 | 1 January 2010 est. | |
| 48 | 199,000,000,000 | 1 January 2015 est.[21] | |
| 49 | 195,400,000,000 | 1 January 2010 est. | |
| 50 | 175,600,000,000 | 1 January 2010 est. | |
| 51 | 165,000,000,000 | 13 May 2013 est.[22] | |
| 52 | 164,800,000,000 | 1 January 2010 est. | |
| 53 | 135,100,000,000 | 1 January 2010 est. | |
| 54 | 127,400,000,000 | 1 January 2010 est. | |
| 55 | 108,700,000,000 | 1 January 2010 est. | |
| 56 | 97,970,000,000 | 1 January 2010 est. | |
| 57 | 92,030,000,000 | 1 January 2010 est. | |
| 58 | 90,610,000,000 | 1 January 2010 est. | |
| 59 | 84,950,000,000 | 1 January 2010 est. | |
| 60 | 70,790,000,000 | 1 January 2010 est. | |
| 61 | 69,830,000,000 | 1 January 2010 est. | |
| 62 | 65,130,000,000 | 1 January 2010 est. | |
| 63 | 62,290,000,000 | 1 January 2010 est. | |
| 64 | 61,300,000,000 | 1 January 2010 est. | |
| 65 | 56,630,000,000 | 1 January 2010 est. | |
| 66 | 50,000,000,000 | 1 January 2010 est. | |
| 67 | 49,550,000,000 | 1 January 2010 est. | |
| 68 | 48,140,000,000 | 1 January 2010 est. | |
| 69 | 36,810,000,000 | 1 January 2010 est. | |
| 70 | 33,980,000,000 | 1 January 2010 est. | |
| 71 | 30,580,000,000 | 1 January 2010 est. | |
| 72 | 28,320,000,000 | 1 January 2010 est. | |
| 73 | 28,320,000,000 | 1 January 2010 est. | |
| 74 | 28,320,000,000 | 1 January 2010 est. | |
| 75 | 24,920,000,000 | 1 January 2010 est. | |
| 76 | 24,800,000,000 | 1 January 2010 est. | |
| 77 | 20,900,000,000 | 1 January 2010 est. | |
| 78 | 14,160,000,000 | 1 January 2010 est. | |
| 79 | 9,911,000,000 | 1 January 2010 est. | |
| 80 | 8,495,000,000 | 1 January 2010 est. | |
| 81 | 8,098,000,000 | 1 January 2010 est. | |
| 82 | 7,985,000,000 | 1 January 2010 est. | |
| 83 | 7,079,000,000 | 1 January 2010 est. | |
| 84 | 6,229,000,000 | 1 January 2010 est. | |
| 85 | 6,088,000,000 | 1 January 2010 est. | |
| 86 | 6,031,000,000 | 1 January 2010 est. | |
| 87 | 5,663,000,000 | 1 January 2010 est. | |
| 88 | 5,663,000,000 | 1 January 2010 est. | |
| 89 | 5,663,000,000 | 1 January 2010 est. | |
| 90 | 5,663,000,000 | 1 January 2010 est. | |
| 91 | 3,072,000,000 | 1 January 2010 est. | |
| 92 | 2,960,000,000 | 1 January 2010 est. | |
| 93 | 2,832,000,000 | 1 January 2010 est. | |
| 94 | 2,548,000,000 | 1 January 2010 est. | |
| 95 | 1,501,000,000 | 1 January 2010 est. | |
| 96 | 1,133,000,000 | 1 January 2010 est. | |
| 97 | 991,100,000 | 1 January 2010 est. | |
| 98 | 991,100,000 | 1 January 2010 est. | |
| 99 | 849,500,000 | 1 January 2010 est. | |
| 100 | 113,300,000 | 1 January 2010 est. | |
| 101 | 27,160,000 | 1 January 2006 est. | |
| 102 | 300,000 | 1 January 2008 est. |
TOTAL: 204.7 trillion cubic meters
- Star denotes includes "recoverable portion of shale reserves"
Comparison of proven natural gas reserves from different sources (billions of cubic meters, as of 31 Dec. 2014/1 Jan. 2015)
| Source | Canada | Iran | Russia | Saudi Arabia | United States | Venezuela |
|---|---|---|---|---|---|---|
| BP[23] | 2,000 | 34,000 | 32,800 | 8,200 | 9,800 | 5,600 |
| OPEC[24] | 2,028 | 34,020 | 49,541 | 8,489 | 9,580 | 5,617 |
| US Energy Information Administration[25] | 2,535 | 42,426 | 59,619 | 10,393 | 10,441 | 6,960 |
See also
- List of countries by natural gas production
- List of natural gas fields
- List of countries by oil proven reserves
References
- ↑ Rank Order - Natural gas - proved reserves. Retrieved June 2014.
- ↑ 2011 report on oil and gas companies, Promoting revenue Transparency Transparency International 2011 page reserves 113
- ↑ Natural gas - proved reserves. Retrieved 1 December 2013.
- ↑ US Energy Information Administration, . Retrieved 23 October 2015.
- 1 2 OPEC, Table 3.2 Natural gas proven reserves by country. Retrieved 1 December 2013.
- ↑ BP, BP Statistical Review of World Energy, June 2013.
- ↑ http://en.apa.az/xeber_bp__iran_ranks_first_for_gas_reserves__t_194696.html
- 1 2 3 4 BP, Statistical Review of World Energy 2014, June 2014
- 1 2 3 US Energy Information Administration, Dry Natural Gas Proved Reserves, 12 December 2013.
- ↑ http://www.eia.gov/naturalgas/crudeoilreserves/
- 1 2 http://www.bp.com/liveassets/bp_internet/globalbp/globalbp_uk_english/reports_and_publications/statistical_energy_review_2011/STAGING/local_assets/pdf/natural_gas_section_2012.pdf
- ↑ "'Reservas de gas de Venezuela ascienden a 195.097 billones de pies cúbicos'". Informe21. 20 July 2011. Retrieved 5 February 2012.
- ↑ World Economic Forum:The future of Azerbaijan's economy
- ↑ http://online.wsj.com/article/BT-CO-20130612-706046.html
- ↑ http://africasacountry.com/2015/05/the-oil-giants-are-coming-to-tanzania/
- ↑ US EIA, Tanzania. Retrieved 3 January 2013.
- ↑ Ministry of Petroleum and Natural Gas - Annual Report 2015-16 Table 2.3, . Retrieved 21 October 2016.
- ↑ "Colombia Gas natural - reservas comprobadas". indexmundi.com. 2 December 2014. Retrieved 2 December 2014.
- ↑ http://www.eia.gov/cfapps/ipdbproject/IEDIndex3.cfm?tid=3&pid=3&aid=6
- ↑ http://www.opec.org/library/Annual%20Statistical%20Bulletin/interactive/current/FileZ/Main.htm
- ↑ US Energy Information Administration, Israel. Retrieved 31 August 2015.
- ↑ "Atuabo gas project to propel more growth". Daily Graphic. graphic.com.gh. 13 May 2013. Archived from the original on 16 May 2014. Retrieved 27 October 2013.
- ↑ BP Statistical Review of World Energy, 2015
- ↑ OPEC Statistical Bulletin, 2015.
- ↑ International Data: Natural Gas Reserves, US EIA. Retrieved 3 July 2016.