Natural gas in the United States

June 2016
Natural gas in the United States was the nation's second-largest source of energy in 2014, after petroleum. Gas provided 29 percent of the energy consumed.[1] Natural gas has been the largest source of electrical generation in the United States since July 2015. In 2012, the US produced 25.3 trillion cubic feet of marketed natural gas, with an average wellhead value of $2.66 per thousand cubic feet, for a total wellhead value of $67.3 billion.[2]
The natural gas industry includes exploration for, production, processing, transportation, storage, and marketing of natural gas and natural gas liquids.[3] The exploration for and production of natural gas and petroleum form a single industry, and many wells produce both oil and gas.
The US has been the world's largest producer of natural gas since 2009, when US production surpassed Russia's. In 2013, the US produced 30.0 trillion cubic feet (TCF) of marketed gas.[4] The leading gas-producing area in the United States in 2013 was Texas (7,545 Billion cubic feet (BCF), followed by Pennsylvania (3,259 BCF), and Louisiana (2,407 BCF).[5]
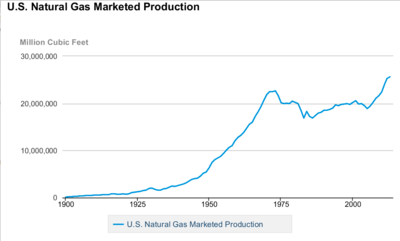
US Natural gas production achieved new record highs for each year from 2011 through 2015. Marketed natural gas production in 2015 was 28.8 trillion cubic feet, a 5.4% increase over 2014, and a 52% increase over the production of 18.9 trillion cubic feet per day in 2005.[6]
Because of the greater supply, consumer prices for natural gas are significantly lower in the US than in Europe and Japan.[7] The low price of natural gas in the US, together with its smaller carbon footprint compared to coal, has encouraged a rapid growth in electricity generated from natural gas.
Between 2005 and 2014, US production of natural gas liquids (NGLs) increased 70%, from 1.74 million barrels per day in 2005 to 2.96 million barrels per day in 2014. The US has been the world's leading producer of natural gas liquids since 2010, when US NGL production passed that of Saudi Arabia.
Although the United States leads the world in natural gas production, it is only fifth in proved reserves of natural gas, behind Russia, Iran, Qatar, and Turkmenistan.
Industry structure
The United States oil and gas industry is often informally divided into "upstream" (exploration and production), "midstream" (transportation and refining), and "downstream" (distribution and marketing. Petroleum and natural gas share a common upstream (exploration and production) sector, but the midstream and downstream sectors are largely separate. All large oil companies in the US produce both oil and gas. However, the relative amounts of oil and gas produced vary greatly. Of the top ten natural gas-producing companies in the US 2009, only three (BP, ConocoPhiillips, and XTO) were also among the top ten oil producers.
Top natural gas producers in the United States, 2009
| Rank | Company | Billion cubic ft./Year |
|---|---|---|
| 1 | BP | 907 |
| 2 | XTO Energy | 855 |
| 3 | ConocoPhillips | 850 |
| 4 | Chesapeake Energy | 835 |
| 5 | Anadarko Petroleum | 817 |
| 6 | Devon Energy | 743 |
| 7 | Encana | 590 |
| 8 | Exxon Mobil | 566 |
| 9 | Williams Companies | 435 |
| 10 | EOG Resources | 422 |
| Annual owned production, 2009. Source:[8] | ||
In 2009, the production owned by the top ten companies was 31% of total US natural gas production.[8]
Natural gas exploration
In 2010, the industry drilled and completed 16,696 wells primarily for gas, slightly more than the number of wells drilled primarily for oil (15,753). Many wells produced both oil and gas, and oil wells produced 18 percent of US gas production in 2013. Of the gas wells, 1,105 were exploratory wells, and 15,591 development wells.[9]
The number of actively drilling gas rigs was once regarded as a reliable leading indicator of near-future gas production. However, the average number of active gas drill rigs has fallen each year for four straight years from 2010 (942 rigs) to 2014 (332 rigs), a drop of 65 percent, even while gas production rose each year for the same period, from 21.3 trillion cubic feet (TCF) in 2010 to 25.7 TCF in 2014, an increase of 21 percent. Remaining proved reserves increased overall, from 301 TCF in 2013 to 338 TCF in 2013 (the last year for which reserves are available), an increase of 11 percent. The rise in gas production despite fewer rigs drilling has been explained by the greater efficiency in drilling, and the greater productivity of shale gas wells.[10]
Natural gas production
Top producing gas fields in the United States, 2013

| Rank | Field | State | Discovery Year | Billion cubic ft./Year |
|---|---|---|---|---|
| 1 | Marcellus natural gas trend | Pennsylvania and West Virginia | 2008 | 2,836 |
| 2 | Newark East Barnett Shale | Texas | 1981 | 1,952 |
| 3 | Haynesville Shale | Louisiana and Texas | 2008 | 1,426 |
| 4 | Eagle Ford Formation | Texas | 1962 | 1,112 |
| 5 | Fayetteville Shale | Arkansas | 2005 | 1,025 |
| 6 | San Juan Basin | New Mexico and Colorado | 1927 | 1,025 |
| 7 | Carthage | Texas | 1936 | 653 |
| 8 | Pinedale Gas Field | Wyoming | 1955 | 568 |
| 9 | Sprayberry | Texas | 1949 | 307 |
| 10 | Wattenberg Gas Field | Colorado | 1970 | 305 |
| Annual production 2013. Source:[11] | ||||
Most oil fields produce some gas, and vice versa, but the ratio of oil and gas varies considerably. Some gas fields, such as coalbed methane wells, and some other gas fields, called "dry gas" fields, produce only gas. Of the top ten as-producing fields in the US, only one, the Eagle Ford trend, is also among the top ten oil fields.
Coalbed methane
Coalbed methane production in the US peaked at 1.97 BCF in 2008, when it made up 7.8 percent of US gas production. By 2013, coalbed methane production had declined to 1.47 BCF.[12]
Shale gas
Since 2000, shale gas has become a key source of natural gas in the US. Production rose sixfold from 2007 to 2013, when shale gas contributed 11.4 TCF, 38 percent of US gas production, and was still increasing.[12]
Gas prices

The most commonly quoted producer price for natural gas is the Louisiana-based Henry Hub price, which is futures-traded on NYMEX.
A barrel of oil releases about 5.8 million BTU when burned, so that 5.8 MCF of gas (at the standard one thousand BTU per cubic foot) releases about the same energy as a barrel of oil. Sometimes gas containing 5.8 million BTU is defined as a "barrel of oil equivalent for energy calculation purposes.[13] When describing reserves or production, however, the oil and gas industry more commonly uses the rounded number of 6 MCF of gas (or 6 million BTU in the natural gas) as equal to one barrel of oil equivalent.[14]
Since the price of natural gas was deregulated in the 1990s, its price has tended to parallel that of oil, with oil usually at a premium on a BTU basis. But starting in the late 2000s, an abundance of natural gas in North America has caused the price of a unit of energy from gas to be much lower than the price of energy from oil.
Natural gas pipelines

When oil and natural gas are brought to the surface, they are usually separated at the wellhead, after which the oil and the gas are treated separately. Gas flows through a gathering system into a pipeline to a gas processing plat. As of 2014, there were 189,000 miles of interstate natural gas pipelines in the United States[15]
Gas processing


Natural gas has a variety of chemical constituents that must be removed or diluted with other gas to achieve consistent pipeline quality. Pipeline gas specifications vary from line to line, but generally the gas must contain no appreciable hydrogen sulfide (which is toxic), less than a few percent carbon dioxide (carbon dioxide reacts with water to form carbonic acid, which is corrosive to iron and steel pipe), and a British thermal unit (BTU) content of 900 or more. Natural gas delivered to consumers generally has a BTU content of about 1020 to 1050 per standard cubic foot, slightly higher than that of pure methane (1010 BTU).[16]
Natural gas liquids
Natural gas is composed primarily of methane, but often contains longer-chain hydrocarbons. Hydrocarbon compounds from hexane (each molecule of which is a simple chain containing six carbon atoms, hence called C6) and heavier generally separate out ("condense") from the gas at the wellhead; this mixture is called condensate, and is usually reported as oil production, and sold to refineries the same as oil. The C2 through C5 hydrocarbons (ethane, propane, butane, and pentane) are known as natural gas liquids (NGLs), and remain in gaseous form until they are extracted at a gas processing plant.[17] The division between the two classes is not perfect: some hexane, and heptane remain in the gas to be separated out as NGLs, while some butane and pentane, may separate out with the condensate.
Natural gas which contains NGLs is called "wet gas." Gas which naturally contains no NGLs, or gas from which the NGLs have been removed, is called "dry gas."
Natural gas liquids are used either for fuel (sold as propane, or liquid petroleum gas (LPG), or for feedstock to the petrochemical industry.
The United States has been the world's top producer of NGLs since 2010, and is far above second place Saudi Arabia, which produced 1.82 million barrels per day in 2015.
Increased production of NGLs since 2000 has lowered the price of NGLs in the North American market, leading to a surge in construction and expansion of petrochemical plants to convert ethane and propane into ethylene and propylene, which are used to make plastics.[18] The United States has the world's largest ethylene-manufacturing capacity, 28.4 million tons per year in 2015, with projects to add another 7.6 million tons from 2015 through 2017.[19] As of 2015, the reduction in NGL prices had turned North America from one of the high-cost places to manufacture petrochemical, into the lowest-cost area outside the Middle East.[20]
Other byproducts
Some natural gas contains enough helium to be extracted as a byproduct.
Sulfur, which must be removed from natural gas for safety, aesthetic, and environmental reasons, is recovered and sold as a byproduct. In 2013, natural gas processing plants recovered 1.02 million metric tons of sulfur, which was 12 percent of US supply of elemental sulfur (the remaining sulfur production came from oil refineries).[21]
Gas storage


Consumption of natural gas in the US is strongly seasonal, higher in the winter than the summer by between 50% to 90%, depending on severity of the winter. To make larger volumes of gas available in the winter, companies have established underground gas storage facilities. There are three types of natural gas storage units currently in service in the US: salt domes, depleted gas reservoirs, and deep aquifers.[23]
The largest volume held in storage was 8.29 trillion cubic feet in October 2012. This was equivalent to 26 percent of the total US production in 2014. The small mid-summer increase shown on the consumption graph is due to increased gas use for electrical power in the summer. Unlike residential, commercial, and industrial use, all of which are higher in winter, electrical power generation uses more gas in the summer.
Natural gas marketing
From the processing plant, natural gas is sold mostly to gas utility companies. In 2014, 46% of the marketed gas was used by commercial and industrial users, 33% by electrical power generators, and 21% by residential consumers.[24]
Natural gas electricity generation
Since 2009, electricity generation has been the largest use of natural gas in the US. Electricity generated by natural gas has been by far the fastest-growing source of electricity in the US since the 1990s. Natural gas became the second-largest source of US electricity in 2006, when it surpassed nuclear power. In late 2015, natural gas surpassed coal as the largest source of electricity generated in the United States.
In the decade 2005 to 2015, electricity generated by natural gas increased by 574 billion kilowatt-hours, more than triple the increase of the second-fastest-growing source, wind energy, which increased 173 billion kilowatt-hours over the same period. Natural gas-generated electricity increased its share of total US electricity from 18.8 percent in 2005, to 32.6 percent in 2015. The increase in gas-generated electricity was mostly at the expense of coal power, which fell from 49.6 percent of US electricity in 2005, to 33.2 percent in 2015. Natural gas surpassed coal as the number one generator of US electricity in late 2015. During the 12-month period through August 2016, natural gas generated 34.5 percent of US electricity, versus 29.8 percent for coal.[25]
Unlike the other sectors of natural gas consumption, the electrical power industry uses more natural gas in the summer, when electricity demand is increased by air conditioning, and when natural gas prices are at seasonal lows.[26]
The increased use of natural gas for electricity is driven by three factors. First, pressure on utilities to decrease greenhouse gas emissions has favored the substitution of coal generation by natural gas generation, which, according to the National Renewable Energy Laboratory,[27] and the IPCC,[28] has significantly less life-cycle GHG emissions than coal-powered electricity. Second, gas power plants are able to ramp up and down quickly, making them well suited to complement intermittent power sources such as wind and solar.[29] Third, since late 2008, the price of natural gas has been relatively cheap on the North American market, especially compared to oil. Electricity from oil-powered generators in the US declined 81 percent from 2005 to 2014.
The states which use the most natural gas for electricity production are, in descending order, Texas, Florida, California, and New York.
Liquified petroleum gas
Liquefied petroleum gas includes the butane and propane natural gas liquids removed in gas processing. They are sold for home heating, cooking, and increasingly for motor fuel. The industry segment is represented by the National Propane Gas Association.
Vehicle fuel
Natural gas, in the forms of compressed natural gas, liquified natural gas, and liquified petroleum gas, is being increasingly used for motor vehicle fuel, especially in fleet vehicles. It has the advantages over gasoline and diesel fuel of being cheaper and emitting less air pollution. It has the disadvantage of having few retail outlets. As of 2011, 262,000 vehicles in the US ran on natural gas. Although natural gas used for vehicle fuel increased 60 percent in the decade 2004-2014, in 2014 it still made up only 3.7 percent on a BTU-basis of fossil fuel use (gasoline, diesel, and natural gas) as transportation fuel in the US.[30] Transportation fuel made up 0.13 percent of natural gas consumption in 2014.
History
Pipeline technology
The natural gas industry in the United States goes back to 1821, when natural gas was discovered and used in Fredonia, New York. From the start, the market for natural gas was limited by pipeline technology. The gas for Fredonia, New York in 1821 was supplied through wooden pipes, which were incapable of carrying gas for long distances.[31]
In the 1800s, residences in most cities were supplied with town gas generated from coal at local "gashouses." The gas was carried in cast iron pipes, introduced in 1843, typically with bell-and-spigot joints sealed with rope and molten lead.[32]
In the 1800s and early 1900s, most natural gas discoveries were made while exploring for oil. Natural gas was usually an unwanted byproduct of oil production. In the 1870s steel pipe replaced cast iron. In 1883, Pittsburgh became the first major city supplied with natural gas.[33] Other cities followed, but only if they were close to natural gas wells. Because natural gas was a byproduct, it was priced cheaply, and, where available, undercut the market for town gas. In 1891, one of the longest pipelines of the time was built, a 120-mile long pipeline from the gas fields of Indiana to Chicago, without compression.
Long-distance high-pressure gas pipelines became feasible after oxyacetylene welding was introduced in 1911, and especially after electric arc welding became popular in the 1920s[31] This allowed remote gas deposits to be supplied to big cities. Natural gas increasingly became a sought-for commodity.
Price regulation
The prices charged by utilities delivering natural gas to customers has always been subject to state regulation. With the construction of interstate gas pipelines in the 1920s and 1930s, city utilities became dependent on natural gas supplies beyond the regulatory power of state and local governments. In 1935, the federal trade commission, believing that interstate pipelines had too much power to control the downstream gas market, recommended federal controls. Congress passed the Natural Gas Act of 1938 to regulate the rates charged by interstate pipelines.
Federal regulations at first included only the rates interstate pipelines charged to carry gas. When the market price of natural gas at the wellhead increased in the 1950s, gas utilities complained that the gas producers should be regulated as well. In 1954, the US Supreme Court ruled in Phillips Petroleum Co. v. Wisconsin that regulation of the wellhead price was within the intent of the Natural Gas Act of 1938 to control prices to utilities, and therefore the federal government could control wellhead prices of any natural gas going into an interstate pipeline.
By the early 1970s, the artificially low price set by the federal government had created a shortage, but only of interstate gas. Gas consumed within the state where it was produced was plentiful, but more expensive. By 1975, about half the natural gas produced went to the intrastate market. In 1975 and 1976, some schools and factories in the Midwest shut down periodically when the local utility could not find any natural gas to buy at the controlled price. The Federal Power Commission tried to allocate the scarce gas by identifying "high-priority" and "low-priority" customers, but this caused extensive litigation.
The federal government responded to gas shortages with the Natural Gas Policy Act of 1978, which both increased federal regulation by extended price controls to all existing natural gas wells, and promised to end price controls on all new wells by 1985.[34] Under the new rules, natural gas was subject to a complicated set of prices, depending on when the well was drilled, the size of the company that owned the well, the permeability of the formation, and the distance of the well from previous wells. Gas production from some types of gas reservoirs received tax subsidies. In 1976, the federal government established the Eastern Gas Shales Project, a large research effort to find ways to produce gas from shale.
Price controls grew even more complex with the Energy Act of 1980, which exempted Devonian gas shales from price controls (but not gas shales other than Devonian), as well as low-permeability formations and coalbed methane. In addition, production from these sources earned tax credits for the producers for qualified wells drilled before January 1, 1992; the tax credits expired at the end of 2002.[35]
The Natural Gas Wellhead Decontrol Act of 1989 mandated that all remaining price controls on natural gas were to be eliminated as of January 1, 1993.
Shortages and surplus
As with petroleum, the future supply of natural gas has long been the subject of concern, and predictions of shortages. In 1952, Dr. Edward Steidle, Dean of the School of Mineral Industries at Pennsylvania State College, predicted that gas production would soon decline significantly from 1952 rates, so that gas would cease to be a significant energy source by 2002, and possibly as early as 1975.[36]
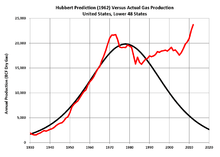
In 1956, M King Hubbert used an estimated ultimate recovery (EUR) of 850 trillion cubic feet (24,000 km3) (an amount postulated by geologist Wallace Pratt) to predict a US production peak of about 14 trillion cubic feet (400 km3) per year to occur "approximately 1970".[37] Pratt, in his EUR estimate (p. 96), explicitly included what he called the "phenomenal discovery rate" that the industry was then experiencing in the offshore Gulf of Mexico.[38]
US marketed gas production reached a peak in 1973 at about 22.6 trillion cubic feet (640 km3), and declined to a low of 16.9 trillion cubic feet (480 km3) in 1986. But then instead of declining further, as predicted by the Hubbert curve, natural gas production rose slowly but steadily for the next 15 years, and reached 20.6 TCF in 2001. Then it dropped again for a few years, and in 2005 was down to 18.9 TCF.
After 2005, natural gas production rose rapidly, exceeded its old 1973 peak, and set new records for high production in each year 2011, 2012, 2013, 2014, and 2015, when marketed production was 28.8 trillion cubic feet (820 km3).[39]
International trade


Natural gas depends on pipelines for economical transport. Without pipeline connections, natural gas must be transported as liquefied natural gas (LNG), an expensive process. For this reason, the price of natural gas tends to differ between regions not connected by gas pipelines. The North American market, consisting of Canada, Mexico, and the United States, all connected by a common pipeline network, has had much lower gas prices in recent years than some other major world gas markets, such as Europe (since 2010), Japan (since 2008), and Korea.
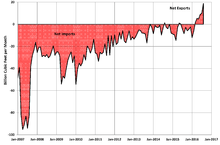
The United States is connected by pipeline to Canada and Mexico. The US has long imported large quantities of gas from Canada, and exported smaller quantities to some parts of eastern Canada. In 2014, the US imported 2,634 BCF from Canada, and exported 769 BCF, so that net imports from Canada totaled 1,865 BCF. The United States has exported increasing volumes to Mexico over the past decade. In 2014, the US exported 728.5 BCF to Mexico, and imported 1.4 BCF, so that net exports to Mexico totaled 727 BCF.
The cost of net imports peaked at US$29.7 billion in 2005; the cost of net imports was $5.9 billion in 2014.
Liquified natural gas

In past years, when experts were projecting gas shortages in North America, utility companies built liquified natural gas (LNG) import terminals along the coast. Net imports of LNG peaked in 2007, but have since decreased. In 2014, the US imported 59 BCF of LNG gas, and exported 16 BCF, so that net LNG imports amounted to 43 BCF. Most imported LNG was from Trinidad and Tobago.
Long-term LNG contracts usually tie the price of LNG to the oil price.
In 2010, after the price of US natural gas fell below that of world markets, US companies have proposed establishing a number of LNG export terminals. A number of these proposals involve converting inactive LNG import terminals to handle LNG exports. Any proposals to export natural gas must be approved by the US Federal Energy Regulatory Commission (FERC), which gives its approval only if the project receives a satisfactory environmental review, and if FERC finds that the export terminal would be in the public interest.[40] As of August 2015, 24 new LNG export terminals have been proposed, of which FERC has so far approved 6.[41] Cheniere Energy expects to begin exporting LNG through its Sabine Pass terminal in January 2016.[42]
As of 2014, the only active LNG export terminal in the US was in Kenai, Alaska. The plant, with a capacity of 0.2 BCF per day, is owned by ConocoPhillips, and has been exporting LNG since 1969.[43][44] Most exported LNG went to Japan.
The New England States are connected by pipeline to the rest of the US and to Canada, but the existing pipelines are insufficient to supply the winter demand. For this reason, a quarter of New England's demand for gas is supplied by more-expensive LNG. Four LNG import terminals serve New England, but most LNG imported to New England arrives through the Everett terminal in Boston, and the Canaport terminal in New Brunswick, Canada.[45] As of 2015, pipelines were under construction to carry cheaper gas from Pennsylvania to New England.
See also
- Energy in the United States
- Hydraulic fracturing in the United States
- Petroleum in the United States
References
- ↑ US Energy Information Administration,Overview, accessed 24 April 2016.
- ↑ Marketed natural gas production, and average wellhead price, US EIA.
- ↑ American Petroleum Institute, , accessed 20 February 2010.
- ↑ US Energy Information Administration
- ↑ US Energy Information Administration
- ↑ US EIA, Natural gas wellhead value and marketed production, accessed 25 April 2015.
- ↑
- 1 2 US Energy Information Administration, Top 100 Operators, 2009, accessed 2 August 2015.
- ↑ Crude oil and natural gas exploratory and development wells, US Energy Information Administration.
- ↑ Rethinking rig count as a predictor of natural gas production, US Energy Information Administration, 28 Oct. 2013.
- ↑ US Energy Information Administration, Top 100 U.S. oil and gas fields, Mar. 2015
- 1 2 Natural gas gross withdrawals, US EIA.
- ↑ Energy units.
- ↑ [ ], US Geological Survey.
- ↑ Christopher E. Smith, "Oil pipelines lead way in strong 2014," Oil & Gas Journal, 7 Sept. 2015, p.111.
- ↑ US EIA, BTU content, accessed 2 August 2015.
- ↑ Schlumberger, Natural gas liquids accessed 2 August 2015
- ↑ Growing US HGL production spurs petrochemical industry investment, US Energy Information Administration, 29 Jan. 2015,
- ↑ Robert Brelsford, "Low-cost feed supports North American ethylene expansion plans," Oil & Gas Journal, 6 July 2015.
- ↑ Mapping North America's petrochemical construction projects, Petrochemical Update, 23 Apr. 2015.
- ↑ Lori E Apodaca, Sulfur, US Geological Survey, Minerals Yearbook, 2013.
- ↑ gas/natural gas/analysis publications/storagebasics/storagebasics.htmlEIA-The Basics of Underground Natural Gas Storage
- ↑ US EIA, The basics of underground natural gas storage, Aug. 2014.
- ↑ US EIA, Natural gas consumption, accessed 4 August 2015.
- ↑ Net generation by energy source, all sectors, US Energy Information Administration, accessed 15 Mar. 2016.
- ↑ Natural gas consumption has two peaks, US EIA, 11 Sept. 2015.
- ↑ US National Renewable Energy Laboratory, Life-cycle analysis harmonization, results and findings, NREL estimates life-cycle greenhouse gas emissions cor coal-fired electricity to be 979 grams CO2 equivalent per kWhr, compared to 450 grams for electricity from conventional gas, and 465 grams for electricity fueled by gas from massive hydraulic fractured gas wells.
- ↑ Intergovernmental Panel on Climate Change, [Climate Change 2014, Chaoter 7], The IPCC estimates life-cycle GHG emissions for coal plants to be between 710 and 950 grams CO2 equivalent per kWhr, and the emissions from gas-fired plants between 410 and 650 grams.
- ↑ April Lee and others, Opportunities for Synergy Between Natural Gas and Renewable Energy in the Electric Power and Transportation Sectors, US National Renewable Energy Laboratory, NREL/TP-6A50-56324, Dec, 2012.
- ↑ Transportation sector, US Energy Information Administration.
- 1 2
- ↑
- ↑ Daniel Yergin, The Prize (New York: Simon & Schuster, 1991) 76.
- ↑ [wells.http://naturalgas.org/regulation/history/ History of natural gas regulation].
- ↑ Dan Seward and Brad Curtis, "Comparison of the Appalachian Basin Devonian shales and Fort Worth Basin Mississippian shale," AAPG Southwest Section, Annual Convention, 13 April 2015.
- ↑ Edward Steidle, Mineral Forecast, 2000 A.D. (State College, Penn.: Pennsylvania State College, 1952) 74.
- ↑ M. King Hubbert (June 1956). "Nuclear Energy and the Fossil Fuels 'Drilling and Production Practice'" (PDF). API. p. figure 22 and p.25,36. Retrieved 18 April 2008.
- ↑ Wallace E. Pratt (1956) "The impact of the peaceful uses of atomic energy on the petroleum industry," in Peaceful Uses of Atomic Energy, US Congress Joint Committee on Atomic Energy, p.89-103.
- ↑ US natural gas production by year, 1900-2014, US EIA.
- ↑ , Government Accountability Office.
- ↑ Approved LNG terminals Federal Energy Regulatory Commission, 6 Aug. 2015.
- ↑ "LNG tanker streams toward U.S. Sabine Pass for inaugural loading," Reuters, 9 Nov. 2015.
- ↑ Kenai liquified natural gas plant and Cook Inlet gas fields, Alaska, ConocoPhillips, April 2014.
- ↑ Alaska LNG terminals, FERC.
- ↑ [LNG.http://www.eia.gov/todayinenergy/detail.cfm?id=4610 Liquified natural gas meets a quarter of New England's average annual natural gas needs], US Energy Information Administration.
External links
- America's Natural Gas Alliance - Natural gas producers
- American Gas Association
- American Public Gas Association - Publicly-owned gas utilities
- Interstate Natural Gas Association of America - Interstate gas pipelines
- Natural Gas Supply Association