Hamilton Centre (provincial electoral district)
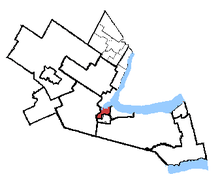
 Hamilton Centre in relation to the other Hamilton area ridings | |||
| Provincial electoral district | |||
| Legislature | Legislative Assembly of Ontario | ||
| MPP |
| ||
| First contested | 2007 | ||
| Last contested | 2014 | ||
| Demographics | |||
| Population (2006) | 117,509 | ||
| Electors (2011) | 81,170 | ||
| Area (km²) | 38 | ||
| Pop. density (per km²) | 3,092.3 | ||
| Census divisions | Hamilton | ||
| Census subdivisions | Hamilton | ||
Hamilton Centre is a provincial electoral district in Ontario, Canada, that is represented in the Legislative Assembly of Ontario.
It was created for the 1926 provincial election but abolished with the 1999 provincial election when the number of constituencies represented in the legislature was reduced. It was re-created for the 2007 election from parts of Hamilton East, Hamilton West and Ancaster—Dundas—Flamborough—Aldershot ridings.
It consists of the part of the City of Hamilton bounded by a line drawn south from the city limit along Ottawa Street, west along the Niagara Escarpment, southwest along James Mountain Road, south along West 5th Street, west along Lincoln M. Alexander Parkway, north along the hydroelectric transmission line situated west of Upper Horning Road, northeast along Highway No. 403, east along the Desjardins Canal to Hamilton Harbour.
Members of Provincial Parliament
Election results
Hamilton Centre, 2007–present
| Ontario general election, 2014 | ||||||||
|---|---|---|---|---|---|---|---|---|
| Party | Candidate | Votes | % | ∆% | ||||
| New Democratic | Andrea Horwath | 18,697 | 52.01 | -9.32 | ||||
| Liberal | Donna Tiqui-Shebib | 8,450 | 23.50 | +6.04 | ||||
| Progressive Conservative | John Vail | 5,173 | 14.39 | +1.22 | ||||
| Green | Peter Ormond | 3,067 | 8.53 | +4.81 | ||||
| Freedom | Peter Melanson | 334 | 0.93 | +0.54 | ||||
| Communist | Bob Mann | 229 | 0.64 | +0.28 | ||||
| Total valid votes | 35,950 | 100.0 | ||||||
| New Democratic hold | Swing | -7.68 | ||||||
| Source: Elections Ontario[1] | ||||||||
| Ontario general election, 2011 | ||||||||
|---|---|---|---|---|---|---|---|---|
| Party | Candidate | Votes | % | ∆% | ||||
| New Democratic | Andrea Horwath | 20,586 | 61.33 | +16.74 | ||||
| Liberal | Donna Tiqui-Shebib | 5,861 | 17.46 | -11.12 | ||||
| Progressive Conservative | Don Sheppard | 4,421 | 13.17 | -1.60 | ||||
| Green | Peter Ormond | 1,249 | 3.72 | -5.90 | ||||
| Libertarian | Robert Kuhlmann | 634 | 1.89 | |||||
| Independent | Micheal Baldasaro | 268 | 0.80 | |||||
| Family Coalition | Steve Passmore | 229 | 0.68 | -0.94 | ||||
| Freedom | Chris Lawson | 130 | 0.39 | |||||
| Communist | Anthony Gracey | 122 | 0.36 | -0.46 | ||||
| Reform | Robert Szajkowski | 67 | 0.20 | |||||
| Total valid votes | 33,567 | 100.0 | ||||||
| Total rejected, unmarked and declined ballots | 177 | 0.52 | ||||||
| Turnout | 33,744 | 42.43 | ||||||
| Eligible voters | 79,524 | |||||||
| New Democratic hold | Swing | +13.93 | ||||||
| Sources: Elections Ontario[2] The Hamilton Spectator[3] The Hamilton Spectator[4] | ||||||||
| Ontario general election, 2007 | ||||||||
|---|---|---|---|---|---|---|---|---|
| Party | Candidate | Votes | % | |||||
| New Democratic | Andrea Horwath | 17,138 | 44.59 | |||||
| Liberal | Steve Ruddick | 10,985 | 28.58 | |||||
| Progressive Conservative | Chris Robertson | 5,678 | 14.77 | |||||
| Green | Peter Ormond | 3,698 | 9.62 | |||||
| Family Coalition | Lynne Scime | 623 | 1.62 | |||||
| Communist | Bob Mann | 314 | 0.82 | |||||
| Total valid votes | 38,436 | 100.0 | ||||||
Hamilton Centre, 1926–1999
| Ontario general election, 1995 | ||||||||
|---|---|---|---|---|---|---|---|---|
| Party | Candidate | Votes | % | ∆% | ||||
| New Democratic | David Christopherson | 8,012 | 36.81 | -18.49 | ||||
| Liberal | Filomena Tassi | 7,322 | 33.64 | +2.84 | ||||
| Progressive Conservative | Angie Tomasic | 5,723 | 26.29 | +17.99 | ||||
| Family Coalition | Tom Wigglesworth | 376 | 1.72 | +0.32 | ||||
| Natural Law | Monique Poudrette | 331 | 1.53 | – | ||||
| Total valid votes | 21,764 | 100.0 | ||||||
| New Democratic hold | Swing | -10.66 | ||||||
2007 electoral reform referendum
| Ontario electoral reform referendum, 2007 | |||
|---|---|---|---|
| Side | Votes | % | |
| First Past the Post | 20,969 | 56.7 | |
| Mixed member proportional | 16,027 | 43.3 | |
| Total valid votes | 36,996 | 100.0 | |
References
- ↑ Elections Ontario (2014). "Official result from the records, 031 Hamilton Centre" (PDF). Retrieved 27 June 2015.
- ↑ Elections Ontario (2011). "Official return from the records / Rapport des registres officiels - Hamilton Centre" (PDF). Retrieved 3 June 2014.
- ↑ "Declared Candidates" (PDF). The Hamilton Spectator. July 23, 2011. p. A6.
- ↑ Pecoskie, Teri (August 22, 2011). "Liberals give lawyer Hamilton Centre nod". The Hamilton Spectator.
External links
Coordinates: 43°14′21″N 79°54′26″W / 43.2393°N 79.9072°W