Kingston and the Islands (provincial electoral district)
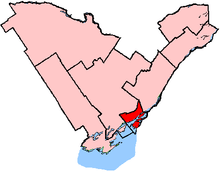
Kingston and the Islands is a provincial electoral district in Ontario, Canada, that has been represented in the Legislative Assembly of Ontario since 1967.
It covers the city of Kingston, Ontario and the nearby areas, including the sparsely populated Frontenac Islands in the St. Lawrence River.
Demographics
- Average family income: $68,494[1] (2001)
- Median household income: $46,310[2]
- Unemployment: 7.4%
- Language, Mother Tongue: English 84%, French 3%, Other 13%
- Religion: Protestant 44%, Catholic 33%, Orthodox Christian 1%, Other Christian 2%, Muslim 1%, Jewish 1%, Non Religious Affiliation 18%, Other 1%[3]
- Visible Minority: Black 1%, Chinese 1%, South Asian 1%, Others 2%
History
The riding was created before the 1967 provincial election.
Members of Provincial Parliament
Election results (since 1977)
| Ontario general election, 2011 |
| Party |
Candidate |
Votes | % | ∆% | Expenditures |
|
Liberal | John Gerretsen | 21,028 | 48.84 | +1.61 | $ 71,020.00 |
|
New Democratic | Mary Rita Holland | 10,241 | 23.79 | +3.24 | 34,982.21 |
|
Progressive Conservative | Rodger James | 9,610 | 22.32 | – | 45,336.00 |
|
Green | Robert Kiley | 1,594 | 3.70 | −5.07 | 15,086.56 |
|
Family Coalition | David Caracciolo | 336 | 0.78 | −0.07 | 2,857.71 |
|
Libertarian | Jamie Shaw | 115 | 0.27 | | 0.00 |
|
Freedom | Paul Busch | 71 | 0.16 | −0.12 | 0.00 |
|
Republican | David Best | 56 | 0.13 | | 0.00 |
| Total valid votes / Expense limit |
43,051 | 100.0 | −12.65 | $ 114,204.30 |
| Total rejected, unmarked and declined ballots |
163 | 0.38 | −0.20 |
| Turnout |
43,214 | 45.03 | −8.93 |
| Eligible voters |
95,966 | | +4.47 |
|
Liberal hold |
Swing |
−0.82 |
|
| Ontario general election, 2007 |
| Party |
Candidate |
Votes | % | ∆% | Expenditures |
|
Liberal | John Gerretsen | 23,277 | 47.23 | −13.05 | $ 64,512.47 |
|
Progressive Conservative | John Rapin | 11,001 | 22.32 | +2.20 | 69,700.00 |
|
New Democratic | Rick Downes | 10,129 | 20.55 | +9.04 | 56,689.54 |
|
Green | Bridget Doherty | 4,321 | 8.77 | +2.22 | 13,098.54 |
|
Family Coalition | Chris Beneteau | 419 | 0.85 | −0.68 | 0.00 |
|
Freedom | Mark Fournier | 137 | 0.28 | | 0.00 |
| Total valid votes/Expense limit |
49,284 | 100.0 | +2.88 | $ 99,207.72 |
| Total rejected ballots |
286 | 0.58 | +0.12 |
| Turnout |
49,570 | 53.96 | −0.33 |
| Eligible voters |
91,859 | | +3.64 |
|
| Ontario general election, 2003 |
| Party |
Candidate |
Votes | % | ∆% | Expenditures |
|
Liberal | John Gerretsen | 28,877 | 60.28 | +5.58 | $ 57,119.88 |
|
Progressive Conservative | Hans Westenberg | 9,640 | 20.12 | −9.94 | 43,307.95 |
|
New Democratic | Janet C. Collins | 5,514 | 11.51 | +0.23 | 23,161.12 |
|
Green | Eric B. Walton | 3,137 | 6.55 | +4.11 | 19,292.20 |
|
Family Coalition | Chris K. Beneteau | 735 | 1.53 | +0.40 | 551.01 |
| Total valid votes/Expense limit |
47,903 | 100.0 | −0.57 | $ 85,086.72 |
| Total rejected ballots |
219 | 0.46 | −0.25 |
| Turnout |
48,122 | 54.29 | −0.22 |
| Eligible voters |
88,634 | | −0.43 |
|
| Ontario general election, 1999 |
| Party |
Candidate |
Votes | % | ∆% | Expenditures |
|
Liberal | John Gerretsen | 26,355 | 54.70 | +17.80 | $ 40,703.00 |
|
Progressive Conservative | Bob Pickering | 14,487 | 30.07 | −0.60 | 65,682.63 |
|
New Democratic | Beth Pater | 5,436 | 11.28 | −17.53 | 26,106.42 |
|
Green | Chris Walker | 1,174 | 2.44 | | 4,848.00 |
|
Family Coalition | Chris K. Beneteau | 546 | 1.13 | −1.94 | 15.00 |
|
Natural Law | Gerard Morris | 182 | 0.38 | −0.17 | 0.00 |
| Total valid votes/Expense limit |
48,180 | 100.0 | +72.38 | $ 85,460.16 |
| Total rejected ballots |
345 | 0.71 | −0.09 |
| Turnout |
48,525 | 54.51 | −6.57 |
| Eligible voters |
89,021 | | +93.00 |
|
| Ontario general election, 1995 |
| Party |
Candidate |
Votes | % | ∆% | Expenditures |
|
Liberal | John Gerretsen | 10,314 | 36.90 | +6.71 | $ 33,086.00 |
|
Progressive Conservative | Sally Barnes | 8,571 | 30.67 | +4.26 | 40,705.44 |
|
New Democratic | Gary Wilson | 8,052 | 28.81 | −9.18 | 30,908.12 |
|
Family Coalition | John Pacheco | 858 | 3.07 | −2.34 | 6,044.53 |
|
Natural Law | Ronald Dunphy | 155 | 0.55 | | 0.00 |
| Total valid votes/Expense limit |
27,950 | 100.0 | −4.26 | $ 45,281.00 |
| Total rejected ballots |
225 | 0.80 |
| Turnout |
28,175 | 61.08 |
| Eligible voters |
46,125 |
|
2007 electoral reform referendum
References
- ↑ "143 Kingston and the Islands". Canada Votes. CBC.ca. Archived from the original on 16 Jun 2004. Retrieved 30 March 2015.
- ↑ "Election 2006". CTV.ca. Retrieved 2 September 2010.
- ↑ "Federal Electoral District Profile of Kingston and the Islands - Kingston et les Îles, Ontario (2003 Representation Order), 2001 Census Map". 2001 Census. Statistics Canada. Retrieved 2 September 2010.
|
|---|
|
| Northern | |
|---|
|
| Eastern | |
|---|
|
| Central | |
|---|
|
| Midwestern | |
|---|
|
| Southwestern | |
|---|
|
Brampton, Mississauga
& Oakville | |
|---|
|
Hamilton, Burlington
& Niagara | |
|---|
|
| Ottawa | |
|---|
|
| South Durham, York | |
|---|
|
| Toronto | |
|---|
|
|