Herefordshire Council elections
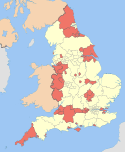
Herefordshire is a unitary authority and ceremonial county in England. It was created on 1 April 1998 replacing Hereford, South Herefordshire, parts of Leominster and Malvern Hills and Hereford and Worcester County Council.
Political control
Since the first election to the council in 1997 political control of the council has been held by the following parties:[1]
| Party in control | Years | |
|---|---|---|
| Liberal Democrats | 1997–2000 | |
| No overall control | 2000–2007 | |
| Conservative | 2007–present | |
Council elections
- Herefordshire Council election, 1997
- Herefordshire Council election, 2000
- Herefordshire Council election, 2003
- Herefordshire Council election, 2007
- Herefordshire Council election, 2011
- Herefordshire Council election, 2015 (boundary changes take effect)
By-election results
| Party | Candidate | Votes | % | ± | |
|---|---|---|---|---|---|
| Independent | 333 | 35.5 | |||
| Liberal Democrat | 284 | 30.3 | |||
| Conservative | 234 | 24.9 | |||
| Labour | 62 | 6.6 | |||
| Green | 25 | 2.4 | |||
| Majority | 49 | 5.2 | |||
| Turnout | 938 | 38.5 | |||
| Independent gain from Liberal Democrat | Swing | ||||
| Party | Candidate | Votes | % | ± | |
|---|---|---|---|---|---|
| Liberal Democrat | 375 | 35.6 | -22.1 | ||
| Labour | 349 | 33.2 | +12.4 | ||
| Conservative | 220 | 20.9 | +0.6 | ||
| Independent | 108 | 10.3 | +10.3 | ||
| Majority | 26 | 2.4 | |||
| Turnout | 1,052 | 19.4 | |||
| Liberal Democrat hold | Swing | ||||
| Party | Candidate | Votes | % | ± | |
|---|---|---|---|---|---|
| Conservative | 736 | 49.5 | +24.0 | ||
| Liberal Democrat | 312 | 21.0 | -5.9 | ||
| Independent | 221 | 14.9 | -9.5 | ||
| Green | 148 | 10.0 | -3.0 | ||
| Labour | 69 | 4.6 | -5.6 | ||
| Majority | 424 | 28.5 | |||
| Turnout | 1,486 | ||||
| Conservative hold | Swing | ||||
| Party | Candidate | Votes | % | ± | |
|---|---|---|---|---|---|
| Conservative | 517 | 53.1 | +31.5 | ||
| Liberal Democrat | 283 | 29.1 | -29.7 | ||
| Labour | 135 | 13.7 | -5.9 | ||
| Green | 39 | 4.0 | +4.0 | ||
| Majority | 234 | 24.0 | |||
| Turnout | 974 | 21.7 | |||
| Conservative gain from Liberal Democrat | Swing | ||||
| Party | Candidate | Votes | % | ± | |
|---|---|---|---|---|---|
| Labour | 743 | 42.5 | +8.7 | ||
| Liberal Democrat | 566 | 32.3 | -6.5 | ||
| Conservative | 296 | 16.9 | +4.0 | ||
| Independent | 145 | 8.3 | +8.3 | ||
| Majority | 177 | 10.2 | |||
| Turnout | 1,750 | ||||
| Labour gain from Liberal Democrat | Swing | ||||
| Party | Candidate | Votes | % | ± | |
|---|---|---|---|---|---|
| Liberal Democrat | Fiona Short | 936 | 37.0 | -7.6 | |
| Conservative | John Ward | 783 | 30.9 | +9.4 | |
| Independent | Julie Woodward | 524 | 20.7 | -13.2 | |
| Labour | John Hitchin | 288 | 11.4 | +11.4 | |
| Majority | 153 | 6.1 | |||
| Turnout | 2,531 | 52.5 | |||
| Liberal Democrat hold | Swing | ||||
| Party | Candidate | Votes | % | ± | |
|---|---|---|---|---|---|
| Liberal Democrat | Elizabeth Taylor | 831 | 44.0 | +8.7 | |
| Conservative | John Perris | 608 | 32.2 | +8.4 | |
| Independent | Guy Griffiths | 274 | 14.5 | -15.4 | |
| Labour | John Oliver | 118 | 6.3 | +6.3 | |
| Independent | Richard Thomas | 56 | 3.0 | +3.0 | |
| Majority | 223 | 11.8 | |||
| Turnout | 1,887 | 27.0 | |||
| Liberal Democrat gain from Independent | Swing | ||||
| Party | Candidate | Votes | % | ± | |
|---|---|---|---|---|---|
| Conservative | John Jarvis | 482 | 41.6 | +8.2 | |
| Liberal Democrat | Paul Truman | 308 | 26.6 | +26.6 | |
| Independent | 249 | 21.5 | -45.1 | ||
| Independent | 119 | 10.3 | +10.3 | ||
| Majority | 174 | 15.0 | |||
| Turnout | 1,158 | 47.2 | |||
| Conservative gain from Independent | Swing | ||||
| Party | Candidate | Votes | % | ± | |
|---|---|---|---|---|---|
| Conservative | Barry Durkin | 422 | 37.9 | -8.1 | |
| Independent | John Gartside | 401 | 36.0 | -1.8 | |
| Liberal Democrat | Josephine Lane | 241 | 21.7 | +5.4 | |
| Green | Adrian Worgan | 49 | 4.4 | +4.4 | |
| Majority | 21 | 1.9 | |||
| Turnout | 1,113 | 46.0 | |||
| Conservative hold | Swing | ||||
References
- ↑ "Council compositions". The Elections Centre. Retrieved 3 May 2016.
External links
| Herefordshire Council | |
|---|---|
| Hereford and Worcester County Council |
|
| Hereford City Council |
|
| Leominster District Council |
|
| Malvern Hills District Council |
|
| South Herefordshire District Council |
|
| |
This article is issued from Wikipedia - version of the 5/8/2016. The text is available under the Creative Commons Attribution/Share Alike but additional terms may apply for the media files.