Hitchin (UK Parliament constituency)
| Hitchin | |
|---|---|
|
Former County constituency for the House of Commons | |
| 1885–1983 | |
| Number of members | one |
| Replaced by | Hertfordshire North and Stevenage[1] |
Hitchin was a parliamentary constituency in Hertfordshire which returned one Member of Parliament to the House of Commons of the Parliament of the United Kingdom from 1885 until it was abolished for the 1983 general election.
Boundaries
1885-1918: The Sessional Divisions of Aldbury (except the civil parishes of Great Hadham and Little Hadham), Buntingford, Hitchin, Odsey, Stevenage, and Welwyn, and the civil parish of Braughing.
1918-1950: The Urban Districts of Baldock, Hitchin, Royston, and Stevenage, the Rural Districts of Ashwell, Buntingford, Hitchin, and Welwyn, and in the Rural District of Hertford the civil parishes of Aston, Bennington, Datchworth, Sacombe, Walkern, and Watton-at-Stone.
1950-1955: The Urban Districts of Baldock, Hitchin, Letchworth, Royston, and Stevenage, the Rural District of Hitchin, in the Rural District of Braughing the civil parishes of Anstey, Ardeley, Aspenden, Broadfield, Buckland, Buntingford, Cottered, Hormead, Meesden, Throcking, Westmilll, and Wyddiall, and in the Rural District of Hertford the civil parishes of Aston, Bennington, Datchworth, Sacombe, Walkern, and Watton-at-Stone.
1955-1974: The Urban Districts of Baldock, Hitchin, Letchworth, Royston, and Stevenage, and the Rural District of Hitchin.
1974-1983: The Urban Districts of Baldock, Hitchin, Letchworth, and Royston, and the Rural District of Hitchin.
Members of Parliament
| Election | Member | Party | |
|---|---|---|---|
| 1885 | Baron Robert Dimsdale a | Conservative | |
| 1892 | George Bickersteth Hudson | Conservative | |
| 1906 | Julius Bertram | Liberal | |
| Jan 1910 | Alfred Peter Hillier | Conservative | |
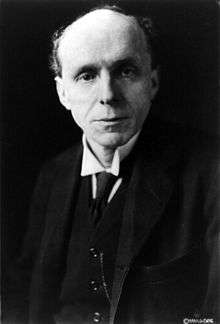
| 1911 by-election | Lord Robert Cecil b | Conservative | |
| 1918 | Coalition Conservative | ||
| 1922 | Conservative | ||
| 1923 | Guy Molesworth Kindersley | Conservative | |
| 1931 | Viscount Knebworth | Conservative | |
| 1933 by-election | Sir Arnold Wilson | Conservative | |
| 1941 by-election | Seymour Berry | Conservative | |
| 1945 | Philip Asterley Jones | Labour | |
| 1950 | Nigel Fisher | Conservative | |
| 1955 | Martin Maddan | Conservative | |
| 1964 | Shirley Williams | Labour | |
| Feb 1974 | Ian Stewart | Conservative | |
| 1983 | constituency abolished | ||
Notes:-
- a Dimsdale was a Baron of the Russian Empire.
- b Cecil associated himself with the non-coalition wing of the Conservative Party, at some point in the 1918-1922 Parliament.
Elections
Elections in the 1880s
| Party | Candidate | Votes | % | ± | |
|---|---|---|---|---|---|
| Conservative | Baron Dimsdale | 4,419 | 60.6 | n/a | |
| Liberal | Henry George Fordham | 2,869 | 39.4 | n/a | |
| Majority | 1,550 | 21.2 | n/a | ||
| Turnout | 81.0 | n/a | |||
| Conservative win (new seat) | |||||
| Party | Candidate | Votes | % | ± | |
|---|---|---|---|---|---|
| Conservative | Baron Dimsdale | unopposed | n/a | n/a | |
| Conservative hold | Swing | n/a | |||
Elections in the 1890s
| Party | Candidate | Votes | % | ± | |
|---|---|---|---|---|---|
| Conservative | George Bickersteth Hudson | 4,187 | 60.5 | n/a | |
| Liberal | John Wattridge | 2,728 | 39.5 | n/a | |
| Majority | 1,459 | 21.0 | n/a | ||
| Turnout | 77.0 | n/a | |||
| Conservative hold | Swing | n/a | |||
| Party | Candidate | Votes | % | ± | |
|---|---|---|---|---|---|
| Conservative | George Bickersteth Hudson | unopposed | n/a | n/a | |
| Conservative hold | Swing | n/a | |||
Elections in the 1900s
| Party | Candidate | Votes | % | ± | |
|---|---|---|---|---|---|
| Conservative | George Bickersteth Hudson | unopposed | n/a | n/a | |
| Conservative hold | Swing | n/a | |||
| Party | Candidate | Votes | % | ± | |
|---|---|---|---|---|---|
| Liberal | Julius Bertram | 4,157 | 50.5 | n/a | |
| Conservative | J J W Miller | 4,081 | 49.5 | n/a | |
| Majority | 76 | 1.0 | n/a | ||
| Turnout | 83.9 | n/a | |||
| Liberal gain from Conservative | Swing | n/a | |||
Elections in the 1910s
| Party | Candidate | Votes | % | ± | |
|---|---|---|---|---|---|
| Conservative | Alfred Peter Hillier | 5,761 | 59.8 | +10.3 | |
| Liberal | St. George William Lane Fox-Pitt | 3,877 | 40.2 | -10.3 | |
| Majority | 1,884 | 19.6 | +20.6 | ||
| Turnout | 88.5 | +4.6 | |||
| Conservative gain from Liberal | Swing | +10.3 | |||
| Party | Candidate | Votes | % | ± | |
|---|---|---|---|---|---|
| Conservative | Alfred Peter Hillier | 5,233 | 57.0 | -2.8 | |
| Liberal | Thomas Tylston Greg | 3,942 | 43.0 | +2.8 | |
| Majority | 1,291 | 14.0 | -5.6 | ||
| Turnout | 84.3 | -4.2 | |||
| Conservative hold | Swing | -2.8 | |||
| Party | Candidate | Votes | % | ± | |
|---|---|---|---|---|---|
| Conservative | Lord Edgar Algernon Robert Gascoyne-Cecil | 5,542 | 58.6 | +1.6 | |
| Liberal | Thomas Tylston Greg | 3,909 | 41.4 | -1.6 | |
| Majority | 1,633 | 17.2 | +3.2 | ||
| Turnout | 84.8 | +0.5 | |||
| Conservative hold | Swing | +1.6 | |||
General Election 1914/15:
Another General Election was required to take place before the end of 1915. The political parties had been making preparations for an election to take place and by the July 1914, the following candidates had been selected;
- Unionist: Lord Edgar Algernon Robert Gascoyne-Cecil
- Liberal:
| Party | Candidate | Votes | % | ± | |
|---|---|---|---|---|---|
| Unionist | 9,828 | ||||
| Labour | Robert Green | 5,661 | |||
| NFDDSS | George Humm | 722 | 4.5 | ||
| Majority | |||||
| Turnout | |||||
| Unionist hold | Swing | ||||
- endorsed by Coalition Government
Elections in the 1920s
| Party | Candidate | Votes | % | ± | |
|---|---|---|---|---|---|
| Unionist | Rt Hon. Edgar Algernon Robert Gascoyne-Cecil | 13,124 | 62.0 | ||
| Labour | Benjamin Skene Mackay | 8,049 | 38.0 | ||
| Majority | 5,078 | 24.0 | |||
| Turnout | |||||
| Unionist hold | Swing | ||||
| Party | Candidate | Votes | % | ± | |
|---|---|---|---|---|---|
| Unionist | Guy Molesworth Kindersley | 11,157 | 49.7 | -12.3 | |
| Labour | Benjamin Skene Mackay | 5,913 | 26.3 | -11.7 | |
| Liberal | Dugald Macfadyen | 5,390 | 24.0 | n/a | |
| Majority | 5,244 | 23.4 | -0.6 | ||
| Turnout | 67.7 | ||||
| Unionist hold | Swing | -0.3 | |||
| Party | Candidate | Votes | % | ± | |
|---|---|---|---|---|---|
| Unionist | Guy Molesworth Kindersley | 14,019 | 59.2 | +9.5 | |
| Labour | Julian Athelstan Tayler | 5,773 | 24.4 | -1.9 | |
| Liberal | Dugald Macfadyen | 3,881 | 16.4 | -7.6 | |
| Majority | 8,246 | 34.8 | +11.4 | ||
| Turnout | 69.5 | +1.8 | |||
| Unionist hold | Swing | +5.7 | |||
| Party | Candidate | Votes | % | ± | |
|---|---|---|---|---|---|
| Unionist | Guy Molesworth Kindersley | 14,786 | 44.8 | -14.4 | |
| Liberal | Enid Lapthorn | 9,325 | 28.3 | +3.9 | |
| Labour | Richard W Gifford | 8,880 | 26.9 | +10.5 | |
| Majority | 5,461 | 16.5 | -18.3 | ||
| Turnout | 73.4 | +3.9 | |||
| Unionist hold | Swing | -9.2 | |||
Elections in the 1930s
| Party | Candidate | Votes | % | ± | |
|---|---|---|---|---|---|
| Conservative | Viscount Knebworth | 25,841 | 75.7 | ||
| Labour | Dermot Johnston Freyer | 8,312 | 24.3 | ||
| Majority | 17,529 | 51.4 | |||
| Turnout | 71.1 | -2.3 | |||
| Conservative hold | Swing | ||||
| Party | Candidate | Votes | % | ± | |
|---|---|---|---|---|---|
| Conservative | Sir Arnold Talbot Wilson | 14,569 | 58.4 | ||
| Labour | William Bennett | 10,362 | 41.6 | ||
| Majority | 4,207 | 16.8 | |||
| Turnout | 51.3 | ||||
| Conservative hold | Swing | ||||
| Party | Candidate | Votes | % | ± | |
|---|---|---|---|---|---|
| Conservative | Sir Arnold Talbot Wilson | 21,452 | 63.34 | ||
| Labour | George Samuel Lindgren | 12,417 | 36.66 | ||
| Majority | 9,035 | 26.68 | |||
| Turnout | 66.44 | ||||
| Conservative hold | Swing | ||||
Elections in the 1940s
General Election 1939/40: Another General Election was required to take place before the end of 1940. The political parties had been making preparations for an election to take place from 1939 and by the end of this year, the following candidates had been selected;
- Conservative: Sir Arnold Wilson
- Labour: George Lindgren
| Party | Candidate | Votes | % | ± | |
|---|---|---|---|---|---|
| Conservative | John Seymour Berry | unopposed | n/a | n/a | |
| Conservative hold | Swing | n/a | |||
| Party | Candidate | Votes | % | ± | |
|---|---|---|---|---|---|
| Labour | Philip Asterley Jones | 20,779 | 42.64 | ||
| Conservative | John Seymour Berry | 20,433 | 41.93 | ||
| Liberal | Maj. Thomas Darling | 7,515 | 15.42 | ||
| Majority | 346 | 0.71 | |||
| Turnout | 72.44 | ||||
| Labour gain from Conservative | Swing | ||||
Elections in the 1950s
| Party | Candidate | Votes | % | ± | |
|---|---|---|---|---|---|
| Conservative | Nigel Thomas Loveridge Fisher | 23,580 | 45.11 | ||
| Labour | Philip Asterley Jones | 21,829 | 41.76 | ||
| Liberal | FS Haig | 6,863 | 13.13 | ||
| Majority | 1,751 | 3.35 | |||
| Turnout | 85.78 | ||||
| Conservative gain from Labour | Swing | ||||
| Party | Candidate | Votes | % | ± | |
|---|---|---|---|---|---|
| Conservative | Nigel Thomas Loveridge Fisher | 27,719 | 52.64 | ||
| Labour | Peter Benenson | 24,941 | 47.36 | ||
| Majority | 2,778 | 5.28 | |||
| Turnout | 84.98 | ||||
| Conservative hold | Swing | ||||
| Party | Candidate | Votes | % | ± | |
|---|---|---|---|---|---|
| Conservative | William Francis Martin Maddan | 26,371 | 50.93 | ||
| Labour | Peter Benenson | 25,406 | 49.07 | ||
| Majority | 965 | 1.86 | |||
| Turnout | 83.17 | ||||
| Conservative hold | Swing | ||||
| Party | Candidate | Votes | % | ± | |
|---|---|---|---|---|---|
| Conservative | William Francis Martin Maddan | 30,193 | 46.82 | ||
| Labour | Peter Benenson | 25,818 | 40.03 | ||
| Liberal | Robert Glenton | 8,481 | 13.15 | ||
| Majority | 4,375 | 6.78 | |||
| Turnout | 85.43 | ||||
| Conservative hold | Swing | ||||
Elections in the 1960s
| Party | Candidate | Votes | % | ± | |
|---|---|---|---|---|---|
| Labour | Shirley Vivian Teresa Brittain Williams | 34,034 | 45.84 | ||
| Conservative | William Francis Martin Maddan | 30,649 | 41.28 | ||
| Liberal | Elma Tryphosa Dangerfield | 9,564 | 12.88 | ||
| Majority | 3,385 | 4.56 | |||
| Turnout | 84.54 | ||||
| Labour gain from Conservative | Swing | ||||
| Party | Candidate | Votes | % | ± | |
|---|---|---|---|---|---|
| Labour | Shirley Vivian Teresa Brittain Williams | 42,233 | 56.52 | ||
| Conservative | John Heydon Romaine Stokes | 32,483 | 43.48 | ||
| Majority | 9,750 | 13.05 | |||
| Turnout | 65.54 | ||||
| Labour hold | Swing | ||||
Elections in the 1970s
| Party | Candidate | Votes | % | ± | |
|---|---|---|---|---|---|
| Labour | Shirley Vivian Teresa Brittain Williams | 40,932 | 48.53 | ||
| Conservative | Richard Napier Luce | 37,258 | 44.18 | ||
| Liberal | Thomas Willis | 6,148 | 7.29 | ||
| Majority | 3,674 | 4.36 | |||
| Turnout | 76.88 | ||||
| Labour hold | Swing | ||||
| Party | Candidate | Votes | % | ± | |
|---|---|---|---|---|---|
| Conservative | Ian Stewart | 27,222 | 44.11 | ||
| Labour | Ann Mallalieu | 23,204 | 37.60 | ||
| Liberal | D Beavan | 10,824 | 17.54 | ||
| Independent | P Bianchi | 467 | 0.76 | ||
| Majority | 4,018 | 6.51 | |||
| Turnout | 85.57 | ||||
| Conservative gain from Labour | Swing | ||||
| Party | Candidate | Votes | % | ± | |
|---|---|---|---|---|---|
| Conservative | Ian Stewart | 25,842 | 44.59 | ||
| Labour | Ann Mallalieu | 22,656 | 39.09 | ||
| Liberal | Eric Dix | 9,454 | 16.31 | ||
| Majority | 3,186 | 5.50 | |||
| Turnout | 79.59 | ||||
| Conservative hold | Swing | ||||
| Party | Candidate | Votes | % | ± | |
|---|---|---|---|---|---|
| Conservative | Ian Stewart | 33,169 | 52.54 | ||
| Labour | Denis O'Flynn | 19,940 | 31.59 | ||
| Liberal | Eric Dix | 8,224 | 13.03 | ||
| Ecology | Brian Goodale | 911 | 1.44 | ||
| National Front | Victor Logan | 881 | 1.40 | ||
| Majority | 13,229 | 20.96 | |||
| Turnout | 82.19 | ||||
| Conservative hold | Swing | ||||
References
- ↑ "Hitchin', Feb 1974 - May 1983". ElectionWeb Project. Cognitive Computing Limited. Retrieved 22 March 2016.
- 1 2 3 4 5 6 7 8 British Parliamentary Election Results 1885-1918, FWS Craig
- 1 2 3 4 5 6 The Liberal Year Book, 1907
- ↑ Debrett's House of Commons & Judicial Bench, 1886
- ↑ Debrett's House of Commons & Judicial Bench, 1901
- ↑ Debrett's House of Commons & Judicial Bench, 1901
- ↑ Debrett's House of Commons & Judicial Bench, 1916
- ↑ Debrett's House of Commons & Judicial Bench, 1916
- ↑ British parliamentary election results, 1885-1918 (Craig)
- ↑ British parliamentary election results, 1918-1949 (Craig)
- ↑ British Parliamentary Election Results 1918-1949, FWS Craig
- ↑ British Parliamentary Election Results 1918-1949, FWS Craig
- ↑ British Parliamentary Election Results 1918-1949, FWS Craig
- ↑ British Parliamentary Election Results 1918-1949, F W S Craig
- ↑ British Parliamentary Election Results 1918-1949, F W S Craig
- ↑ British Parliamentary Election Results 1918-1949, F W S Craig
- ↑ British Parliamentary Election Results 1918-1949, F W S Craig
- ↑ British Parliamentary Election Results 1918-1949, F W S Craig