United Kingdom general election, 1892
United Kingdom general election, 1892
|
|
|
|
All 670 seats in the House of Commons
336 seats needed for a majority |
| |
First party |
Second party |
| |
 |
 |
| Leader |
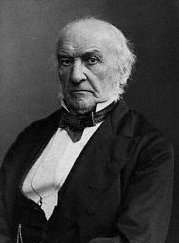
William Ewart Gladstone |
Lord Salisbury |
| Party |
Liberal |
Conservative |
| Leader since |
April 1880 |
April 1881 |
| Leader's seat |
Midlothian |
Marquess of Salisbury |
| Last election |
192 seats, 41.8% |
317 seats, 29.8% |
| Seats won |
272 |
268 |
| Seat change |
 80 80 |
 49 49 |
| Popular vote |
2,088,019 |
1,690,594 |
| Percentage |
45.4% |
|
| Swing |
3.6% |
|
|
| |
Third party |
Fourth party |
| |
.jpg) |
 |
| Leader |
Justin McCarthy |
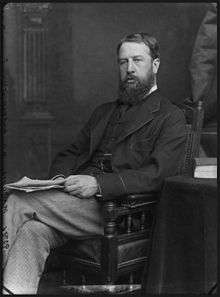
Spencer Cavendish |
| Party |
Irish Parliamentary |
Liberal Unionist |
| Leader since |
6 December 1891 |
April 1886 |
| Leader's seat |
North Longford |
Duke of Devonshire |
| Last election |
85 seats, 3.4% |
77 seats, 3.4% |
| Seats won |
81 |
46 |
| Seat change |
4 |
31 |
| Popular vote |
309,329 |
468,556 |
| Percentage |
7.0% |
|
| Swing |
3.7% |
|
|
|
|
The 1892 United Kingdom general election was held from 4 July to 26 July 1892. It saw the Conservatives, led by Lord Salisbury, win the greatest number of seats, but not enough for an overall majority as William Ewart Gladstone's Liberals won many more seats than in the 1886 general election. The Liberal Unionists who had previously supported the Conservative government saw their vote and seat numbers go down.
Despite being split between Parnellite and anti-Parnellite factions, the Irish Nationalist vote held up well. As the Liberals did not have a majority on their own, Salisbury refused to resign on hearing the election results and waited to be defeated in a vote of no confidence on 11 August. Gladstone formed a minority government dependent on Irish Nationalist support.
Results
UK General Election 1892
|
Candidates |
Votes |
| Party |
Leader |
Standing |
Elected |
Gained |
Unseated |
Net |
% of total |
% |
No. |
Net % |
| |
Conservative |
Lord Salisbury |
470 |
268 |
|
|
|
|
|
1,690,594 |
|
| |
Liberal Unionist |
Joseph Chamberlain |
136 |
46 |
|
|
|
|
|
468,556 |
|
| |
Conservative and Liberal Unionist |
Lord Salisbury |
606 |
314 |
|
|
- 79 |
|
47.0 |
2,159,150 |
|
| |
Liberal |
William Ewart Gladstone |
535 |
272 |
|
|
+ 80 |
40.59 |
45.4 |
2,088,019 |
+3.6 |
| |
Irish Parliamentary |
Justin McCarthy |
129 |
81 |
0 |
3 |
- 4 |
12.08 |
7.0 |
309,329 |
+3.7 |
| |
Independent Labour |
N/A |
9 |
3 |
3 |
0 |
+ 3 |
0.44 |
0.5 |
22,198 |
N/A |
| |
Independent Conservative |
N/A |
4 |
0 |
0 |
0 |
0 |
|
0.1 |
7,211 |
N/A |
| |
Independent Liberal |
N/A |
6 |
1 |
1 |
0 |
+ 1 |
|
0.1 |
3,572 |
N/A |
| |
Scottish Trades Councils |
Chisholm Robertson |
4 |
0 |
0 |
0 |
0 |
|
0.0 |
2,313 |
N/A |
| |
Independent Nationalist |
N/A |
2 |
0 |
0 |
0 |
0 |
|
0.0 |
2,180 |
N/A |
| |
Scottish Parliamentary Labour |
Keir Hardie |
3 |
0 |
0 |
0 |
0 |
|
0.0 |
2,043 |
N/A |
| |
Social Democratic Federation |
H. M. Hyndman |
2 |
0 |
0 |
0 |
0 |
|
0.0 |
659 |
N/A |
| |
Independent |
N/A |
3 |
0 |
0 |
0 |
0 |
|
0.0 |
139 |
N/A |
The totals above exclude two Irish candidates whose party affiliation was unclear to F. W. S. Craig at the time he compiled his voting figures: Col. J. C. Lowry who gained 897 votes standing for University of Dublin as either an Independent or Official Conservative, and John O'Connor Power who gained 609 votes standing in Mayo West as a Gladstonian Liberal. Craig labelled both candidates: "Others".
Total votes cast: 4,598,319. All parties shown.
Voting summary
| Popular vote |
|---|
|
|
|
|
|
| Conservative and Liberal Unionist |
|
46.96% |
| Liberal |
|
45.41% |
| Irish Parliamentary |
|
6.73% |
| Independent |
|
0.77% |
| Others |
|
0.14% |
Seats summary
| Parliamentary seats |
|---|
|
|
|
|
|
| Conservative and Liberal Unionist |
|
46.72% |
| Liberal |
|
40.6% |
| Irish Parliamentary |
|
12.1% |
| Independent Liberal |
|
0.15% |
| Independent Labour |
|
0.45% |
Regional Results
Great Britain
England
Scotland
| Party |
Candidates |
Unopposed |
Seats |
Seats change |
Votes |
% |
% Change |
|---|
|
Liberal |
70 |
0 |
51 |
|
256,944 |
53.9 |
|
|
Conservative & Liberal Unionist |
68 |
0 |
19 |
|
209,944 |
44.4 |
|
|
Other |
11 |
0 |
0 |
|
8,242 |
1.7 |
|
| Total |
149 |
0 |
70 |
 |
475,130 |
100 |
|
Wales
Ireland
Universities
| Party |
Candidates |
Unopposed |
Seats |
Seats change |
Votes |
% |
% Change |
|---|
|
Conservative & Liberal Unionist |
9 |
7 |
9 |
|
3,797 |
80.9 |
|
|
Other |
1 |
0 |
0 |
|
897 |
19.1 |
|
| Total |
10 |
7 |
9 |
|
4,694 |
100 |
|
See also
Further reading
- Cawood, Ian. "The 1892 General Election and the Eclipse of the Liberal Unionists." Parliamentary History 29.3 (2010): 331-357.
- Cawood, Ian. "The Unionist 'Compact' in West Midland Politics 1891-1895." Midland History (2013).
- F. W. S. Craig, British Electoral Facts: 1832-1987
- F. W. S. Craig, British Parliamentary Election Results 1885-1918 (Macmillan, 1974)
- Pelling, Henry. Social Geography of British Elections 1885–1910 (1967).
- Spartacus: Political Parties and Election Results
External links
For an alternative view of the count where each vote in a two-member seat is counted as half a vote (because each elector had two votes) see: