This article is about the demographic features of the population of Ivory Coast, including population density, ethnicity, education level, health of the populace, economic status, religious affiliations and other aspects of the population.
Population
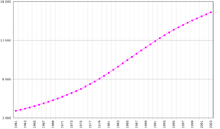
Demographics of Ivory Coast, Data of
FAO, year 2005 ; Number of inhabitants in thousands.
According to the 2010 revision of the World Population Prospects the total population was 19 738 000 in 2010, compared to only 2 630 000 in 1950. The proportion of children below the age of 15 in 2010 was 40.9%, 55.3% was between 15 and 65 years of age, while 3.8% was 65 years or older
.[1]
|
Total population (x 1000) |
Population aged 0–14 (%) |
Population aged 15–64 (%) |
Population aged 65+ (%) |
| 1950 |
2 630 | 43.1 | 54.6 | 2.3 |
| 1955 |
3 072 | 43.0 | 54.6 | 2.4 |
| 1960 |
3 638 | 43.8 | 53.8 | 2.4 |
| 1965 |
4 424 | 44.6 | 52.9 | 2.4 |
| 1970 |
5 416 | 45.0 | 52.6 | 2.4 |
| 1975 |
6 768 | 45.4 | 52.2 | 2.4 |
| 1980 |
8 501 | 45.9 | 51.7 | 2.5 |
| 1985 |
10 495 | 45.9 | 51.5 | 2.5 |
| 1990 |
12 518 | 45.1 | 52.2 | 2.6 |
| 1995 |
14 677 | 43.2 | 54.0 | 2.8 |
| 2000 |
16 582 | 41.8 | 55.1 | 3.1 |
| 2005 |
18 021 | 41.8 | 54.8 | 3.5 |
| 2010 |
19 738 | 40.9 | 55.3 | 3.8 |
Structure of the population (DHS 2011-2012) (Males 23 630, Females 25 193 = 48 823) :
| Age Group |
Male (%) |
Female (%) |
Total (%) |
| 0-4 |
16,0 |
16,0 |
16,0 |
| 5-9 |
15,3 |
14,8 |
15,1 |
| 10-14 |
13,2 |
13,0 |
13,1 |
| 15-19 |
8,9 |
9,1 |
9,0 |
| 20-24 |
8,4 |
8,7 |
8,5 |
| 25-29 |
7,5 |
8,6 |
8,0 |
| 30-34 |
6,9 |
7,0 |
7,0 |
| 35-39 |
5,3 |
5,1 |
5,2 |
| 40-44 |
4,6 |
3,8 |
4,2 |
| 45-49 |
3,3 |
2,9 |
3,1 |
| 50-54 |
2,9 |
3,7 |
3,3 |
| 55-59 |
2,0 |
2,3 |
2,2 |
| 60-64 |
2,3 |
1,8 |
2,1 |
| 65-69 |
1,3 |
1,2 |
1,3 |
| 70-74 |
1,0 |
1,0 |
1,0 |
| 75-79 |
0,5 |
0,4 |
0,5 |
| 80+ |
0,6 |
0,6 |
0,6 |
|
| Age group |
Male (%) |
Female (%) |
Total (%) |
| 0-14 |
44,5 |
43,8 |
44,2 |
| 15-64 |
52,1 |
53,0 |
52,4 |
| 65+ |
3,4 |
3,2 |
3,4 |
|
Population Growth:
1.88% (2016 est.)[2]
Vital statistics
Registration of vital events is in Ivory Coast not complete. The Population Departement of the United Nations prepared the following estimates.
[1]
| Period |
Live births per year |
Deaths per year |
Natural change per year |
CBR* |
CDR* |
NC* |
TFR* |
IMR* |
| 1950-1955 | 145 000 | 70 000 | 74 000 | 50.8 | 24.6 | 26.1 | 6.77 | 167 |
| 1955-1960 | 174 000 | 81 000 | 93 000 | 51.9 | 24.1 | 27.8 | 7.15 | 160 |
| 1960-1965 | 211 000 | 94 000 | 117 000 | 52.3 | 23.3 | 29.0 | 7.53 | 155 |
| 1965-1970 | 258 000 | 109 000 | 149 000 | 52.4 | 22.2 | 30.2 | 7.83 | 147 |
| 1970-1975 | 317 000 | 116 000 | 200 000 | 52.0 | 19.1 | 32.9 | 7.93 | 127 |
| 1975-1980 | 386 000 | 123 000 | 263 000 | 50.5 | 16.1 | 34.4 | 7.81 | 109 |
| 1980-1985 | 446 000 | 133 000 | 313 000 | 46.9 | 14.0 | 32.9 | 7.31 | 96 |
| 1985-1990 | 494 000 | 154 000 | 340 000 | 42.9 | 13.4 | 29.5 | 6.61 | 93 |
| 1990-1995 | 542 000 | 186 000 | 357 000 | 39.9 | 13.6 | 26.2 | 5.92 | 95 |
| 1995-2000 | 587 000 | 224 000 | 363 000 | 37.6 | 14.3 | 23.2 | 5.31 | 92 |
| 2000-2005 | 639 000 | 249 000 | 390 000 | 36.9 | 14.4 | 22.5 | 5.05 | 85 |
| 2005-2010 | 660 000 | 245 000 | 415 000 | 35.0 | 13.0 | 22.0 | 4.65 | 77 |
| * CBR = crude birth rate (per 1000); CDR = crude death rate (per 1000); NC = natural change (per 1000); IMR = infant mortality rate per 1000 births; TFR = total fertility rate (number of children per woman) |
Fertility and Births
Total Fertility Rate (TFR) (Wanted Fertility Rate) and Crude Birth Rate (CBR):[3]
| Year |
CBR (Total) |
TFR (Total) |
CBR (Urban) |
TFR (Urban) |
CBR (Rural) |
TFR (Rural) |
| 1994 |
41,3 |
5,7 (4,7) |
38,8 |
4,7 (3,7) |
42,5 |
6,4 (5,4) |
| 1998-99 |
39,3 |
5,2 (4,5) |
36,5 |
4,0 (3,4) |
40,7 |
6,0 (5,2) |
| 2005 |
38,4 |
4,6 |
35,1 |
3,6 |
40,8 |
5,5 |
| 2011-12 |
36,8 |
5,0 (4,1) |
31,9 |
3,7 (3,2) |
40,3 |
6,3 (5,0) |
|
Ethnic groups
Ethnic groups
| Ethnic groups in Ivory Coast[4] |
|---|
| Ethnic groups |
|
|
|
|
| Akan |
|
32.1% |
| Other (includes European and Lebanese) |
|
21.2% |
| Voltaique or Gur |
|
15% |
| Northern Mande |
|
12.4% |
| Krou |
|
9.8% |
| Southern Mande |
|
9% |
| Unspecified |
|
0.5% |
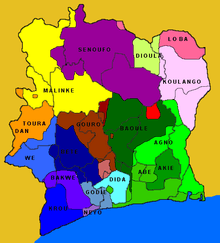
Ivory Coast has more than 60 ethnic groups, usually classified into five principal divisions: Akan (east and center, including Lagoon peoples of the southeast), Krou (southwest), Southern Mandé (west), Northern Mandé (northwest), Sénoufo/Lobi (north center and northeast). The Baoulés, in the Akan division, probably comprise the largest single subgroup with 15%-20% of the population. They are based in the central region around Bouaké and Yamoussoukro. The Bétés in the Krou division, the Sénoufos in the north, and the Malinkés in the northwest and the cities are the next largest groups, with 10%-15% of the national population. Most of the principal divisions have a significant presence in neighboring countries.
Of the more than 5 million non-Ivorian Africans living in Ivory Coast, one-third to one-half are from Burkina Faso; the rest are from Ghana, Guinea, Mali, Nigeria, Benin, Sénégal, Liberia, and Mauritania. The non-African expatriate community includes roughly 50,000 French (this number may be inaccurate due to the evacuation of roughly 8,000 Frenchmen in November 2004) and possibly 40,000 Lebanese. The number of elementary school-aged children attending classes increased from 22% in 1960 to 67% in 1995.
Languages
- French (official), 82 indigenous languages, one that has later been extinguised, 60 of which the Dioula dialect of Bambara is the most widely spoken. Other languages include: the Gur languages, the Senufo languages, the Kru languages (including the Bété languages, Dida, Nyabwa, Wè, and Western Krahn), and the Kwa languages from which Baoulé and Anyin are notably used.
Religion
Ivorian diaspora
The table below shows the number of people born in Ivory Coast who have migrated to OECD countries only (the table only includes communities consisting of at least 1,000 members).[5]
CIA World Factbook demographic statistics
The following demographic statistics are from the CIA World Factbook, unless otherwise indicated.
Population
- 21,058,798 (2010 est.)
- Note: estimates for this country explicitly take into account the effects of excess mortality due to AIDS; this can result in lower life expectancy, higher infant mortality and death rates, lower population and growth rates, and changes in the distribution of population by age and sex than would otherwise be expected (July 2010 est.)
| Total | 19.6 |
| Male | 19.7 |
| Female | 19.5 (2011 est.) |
Sex ratio
| At birth | 1.03 male(s)/female |
| Under 15 years | 1.02 male(s)/female |
| 15–64 years | 1.04 male(s)/female |
| 65 years and over | 0.99 male(s)/female |
| Total population | 1.03 male(s)/female (2011 est.) |
Life expectancy at birth
| Total | 58.01 |
| Male | 56.21 years |
| Female | 58.33 years (2012 est.) |
HIV/AIDS
| Adult prevalence rate | 3.4% (2009 est.) |
| People living with HIV/AIDS | 450,000 (2009 est.) |
| Deaths | 36,000 (2009 est.) |
Major infectious diseases
| Degree of risk | very high |
| Food or Waterborne diseases | bacterial diarrhea, hepatitis A, and typhoid fever |
| Water contact | schistosomiasis |
| Animal contact disease | rabies |
Note: highly pathogenic H5N1 avian influenza has been identified in this country; it poses a negligible risk with extremely rare cases possible among US citizens who have close contact with birds (2009)
Nationality
Noun and adjective: Ivorian (Ivoirian)
Ethnic Groups
| Akan | 42.1% |
| Voltaiques or Gur | 17.6% |
| Northern Mandes | 16.5% |
| Krous 11% | Southern Mandes 10% |
| other | 2.8% (includes 130,000 Lebanese and 14,000 French) (1998) |
Literacy
Here literacy is defined as the ratio of people over age 15 who can read and write.
| Total population | 56.2% |
| Male | 65.2% |
| Female | 46.6% (2010 est.) |
School Life Expectancy (Primary to Tertriary Education)
| Total | 6 Years |
| Male | 8 Years |
| Female | 5 Years (2000) |
References
 This article incorporates public domain material from the CIA World Factbook document "2006 edition".