Martigny (district)
| Martigny District de Martigny | |
|---|---|
| District | |
 | |
| Coordinates: 46°06′N 7°04′E / 46.100°N 7.067°ECoordinates: 46°06′N 7°04′E / 46.100°N 7.067°E | |
| Country |
|
| Canton |
|
| Capital | Martigny |
| Area | |
| • Total | 263.5 km2 (101.7 sq mi) |
| Population (2015) | |
| • Total | 46,140 |
| • Density | 180/km2 (450/sq mi) |
| Time zone | CET (UTC+1) |
| • Summer (DST) | CEST (UTC+2) |
| Municipalities | 11 |
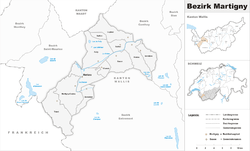
The district of Martigny is a district in the canton of Valais in Switzerland. It has a population of 46,140 (as of 31 December 2015).[1]
Municipalities
It comprises the following municipalities:
| Municipality | Population (31 December 2015)[1] |
Area km²[2] |
|---|---|---|
| Bovernier | 850 | 12.86 |
| Charrat | 1,666 | 7.61 |
| Fully | 8,524 | 37.79 |
| Isérables | 854 | 15.23 |
| Leytron | 3,084 | 26.85 |
| Martigny | 17,651 | 24.97 |
| Martigny-Combe | 2,317 | 37.63 |
| Riddes | 2,985 | 23.88 |
| Saillon | 2,482 | 13.74 |
| Saxon | 5,534 | 23.23 |
| Trient | 193 | 39.56 |
| Total | 46,140 | 263.35 |
Coat of arms
The blazon of the municipal coat of arms is Gules, a Lion rampant double-queued Argent holding a mallet Or.[3]
Demographics
Martigny has a population (as of December 2015) of 46,140.[1] Most of the population (as of 2000) speaks French (29,848 or 88.6%) as their first language, Portuguese is the second most common (1,268 or 3.8%) and Italian is the third (818 or 2.4%). There are 516 people who speak German and 17 people who speak Romansh.[4]
As of 2008, the gender distribution of the population was 49.4% male and 50.6% female. The population was made up of 14,638 Swiss men (36.4% of the population) and 5,224 (13.0%) non-Swiss men. There were 15,790 Swiss women (39.3%) and 4,518 (11.2%) non-Swiss women.[5] Of the population in the district 15,012 or about 44.6% were born in Martigny and lived there in 2000. There were 8,129 or 24.1% who were born in the same canton, while 3,114 or 9.2% were born somewhere else in Switzerland, and 6,505 or 19.3% were born outside of Switzerland.[4]
As of 2000, there were 13,777 people who were single and never married in the district. There were 16,152 married individuals, 2,192 widows or widowers and 1,572 individuals who are divorced.[4]
There were 4,529 households that consist of only one person and 1,073 households with five or more people. Out of a total of 13,999 households that answered this question, 32.4% were households made up of just one person and there were 167 adults who lived with their parents. Of the rest of the households, there are 3,294 married couples without children, 4,609 married couples with children There were 860 single parents with a child or children. There were 171 households that were made up of unrelated people and 369 households that were made up of some sort of institution or another collective housing.[4][6]
| Historical population | |||||||||||||||||||||||||||||||||||||||||||||||||||||||||||
|---|---|---|---|---|---|---|---|---|---|---|---|---|---|---|---|---|---|---|---|---|---|---|---|---|---|---|---|---|---|---|---|---|---|---|---|---|---|---|---|---|---|---|---|---|---|---|---|---|---|---|---|---|---|---|---|---|---|---|---|
|
|
| |||||||||||||||||||||||||||||||||||||||||||||||||||||||||
| [7] | |||||||||||||||||||||||||||||||||||||||||||||||||||||||||||
Mergers and name changes
On 1 August 1964 the former municipalities of Martigny-Bourg and Martigny-Ville merged to form the new municipality of Martigny.[8]
Politics
In the 2007 federal election the most popular party was the CVP which received 30.87% of the vote. The next three most popular parties were the FDP (29.7%), the SVP (15.87%) and the SP (12.66%). In the federal election, a total of 14,438 votes were cast, and the voter turnout was 60.8%.[9]
In the 2009 Conseil d'Etat/Staatsrat election a total of 12,925 votes were cast, of which 887 or about 6.9% were invalid. The voter participation was 54.2%, which is similar to the cantonal average of 54.67%.[10] In the 2007 Swiss Council of States election a total of 14,242 votes were cast, of which 1,055 or about 7.4% were invalid. The voter participation was 61.0%, which is similar to the cantonal average of 59.88%.[11]
Religion
From the 2000 census, 27,493 or 81.6% were Roman Catholic, while 1,624 or 4.8% belonged to the Swiss Reformed Church. Of the rest of the population, there were 185 members of an Orthodox church (or about 0.55% of the population), there were 22 individuals (or about 0.07% of the population) who belonged to the Christian Catholic Church, and there were 508 individuals (or about 1.51% of the population) who belonged to another Christian church. There were 4 individuals (or about 0.01% of the population) who were Jewish, and 1,155 (or about 3.43% of the population) who were Islamic. There were 41 individuals who were Buddhist, 21 individuals who were Hindu and 39 individuals who belonged to another church. 1,478 (or about 4.39% of the population) belonged to no church, are agnostic or atheist, and 1,365 individuals (or about 4.05% of the population) did not answer the question.[4]
Education
In Martigny about 10,545 or (31.3%) of the population have completed non-mandatory upper secondary education, and 3,057 or (9.1%) have completed additional higher education (either University or a Fachhochschule). Of the 3,057 who completed tertiary schooling, 55.4% were Swiss men, 29.2% were Swiss women, 9.4% were non-Swiss men and 5.9% were non-Swiss women.[4]
References
- 1 2 3 Swiss Federal Statistical Office - STAT-TAB, online database – Ständige und nichtständige Wohnbevölkerung nach institutionellen Gliederungen, Geburtsort und Staatsangehörigkeit (German) accessed 30 August 2016
- ↑ Swiss Federal Statistical Office-Land Use Statistics 2009 data (German) accessed 25 March 2010
- ↑ Flags of the World.com accessed 25-August-2011
- 1 2 3 4 5 6 STAT-TAB Datenwürfel für Thema 40.3 - 2000 (German) accessed 2 February 2011
- ↑ Ständige Wohnbevolkerung nach Geschlecht und Heimat am 31.12.2009.xls (German) (French) accessed 24 August 2011
- ↑ Swiss Federal Statistical Office STAT-TAB - Datenwürfel für Thema 09.2 - Gebäude und Wohnungen (German) accessed 28 January 2011
- ↑ Swiss Federal Statistical Office STAT-TAB Bevölkerungsentwicklung nach Region, 1850-2000 (German) accessed 29 January 2011
- ↑ Nomenklaturen – Amtliches Gemeindeverzeichnis der Schweiz (German) accessed 4 April 2011
- ↑ Swiss Federal Statistical Office, Nationalratswahlen 2007: Stärke der Parteien und Wahlbeteiligung, nach Gemeinden/Bezirk/Canton (German) accessed 28 May 2010
- ↑ Staatsratswahlen vom 1. März 2009 (German) accessed 24 August 2011
- ↑ Ständeratswahl 2007 (German) accessed 24 August 2011