Measuring poverty


Although the most severe poverty is in the developing world, there is evidence of poverty in every region. In developed countries, this condition results in wandering homeless people and poor suburbs and ghettos. Poverty may be seen as the collective condition of poor people, or of poor groups, and in this sense entire nation-states are sometimes regarded as poor. To avoid possible stigma, they are commonly referred to as developing nations.
Absolute vs relative poverty
When measured, poverty may be absolute or relative. Absolute poverty refers to a set standard which is consistent over time and between countries. An example of an absolute measurement would be the percentage of the population eating less food than is required to sustain the human body (approximately 2000–2500 calories per day).
Relative poverty, in contrast, views poverty as socially defined and dependent on social context. One relative measurement would be to compare the total wealth of the poorest one-third of the population with the total wealth of the richest 1% of the population. In this case, the number of people counted as poor could increase while their income rises. There are several different income inequality metrics; one example is the Gini coefficient.
Measurements
The main poverty line used in the OECD and the European Union is a relative poverty measure based on "economic distance", a level of income usually set at 60% of the median household income.
The United States, in contrast, uses an absolute poverty measure. The US poverty line was created in 1963–64 and was based on the dollar costs of the U.S. Department of Agriculture's "economy food plan" multiplied by a factor of three. The multiplier was based on research showing that food costs then accounted for about one-third of money income. This one-time calculation has since been annually updated for inflation.[1]
The US line has been critiqued as being either too high or too low. For example, the Heritage Foundation, a conservative U.S. think tank, objects to the fact that, according to the U.S. Census Bureau, 46% of those defined as being in poverty in the U.S. own their own home (with the average poor person's home having three bedrooms, with one and a half baths, and a garage).[2] Others, such as economist Ellen Frank, argue that the poverty measure is too low as families spend much less of their total budget on food than they did when the measure was established in the 1950s. Further, federal poverty statistics do not account for the widely varying regional differences in non-food costs such as housing, transport, and utilities.[3]
Both absolute and relative poverty measures are usually based on a person's yearly income and frequently take no account of total wealth. Some people argue that this ignores a key component of economic well-being. Major developments and research in this area suggest that standard one dimensional measures of poverty, based mainly on wealth or calorie consumption, are seriously deficient. This is because poverty often involves being deprived on several fronts, which do not necessarily correlate well with wealth. Access to basic needs is an example of a measurement that does not include wealth. Access to basic needs that may be used in the measurement of poverty are clean water, food, shelter and clothing.[4][5] It has been established that people may have enough income to satisfy basic needs,but not use it wisely. Similarly, extremely poor people may not be deprived if sufficiently strong social networks, or social service systems exist. For deeper discussion see.[6] See also the Wikipedia article on Multidimensional poverty.
Definitions
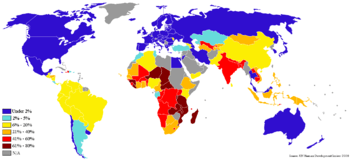
The World Bank defines poverty in absolute terms. The bank defines extreme poverty as living on less than US$1.25 per day>[7] (PPP), and moderate poverty as less than $2 a day. It has been estimated that in 2008, 1.4 billion people had consumption levels below US$1.25 a day and 2.7 billion lived on less than $2 a day. The proportion of the developing world's population living in extreme economic poverty has fallen from 28 percent in 1990 to 21 percent in 2001. Much of the improvement has occurred in East and South Asia. In Sub-Saharan Africa GDP/capita shrank with 14 percent, and extreme poverty increased from 41 percent in 1981 to 46 percent in 2001. Other regions have seen little or no change. In the early 1990s the transition economies of Europe and Central Asia experienced a sharp drop in income. Poverty rates rose to 6 percent at the end of the decade before beginning to recede.[8] There are criticisms of these measurements.[9]
Non-monetary indicators
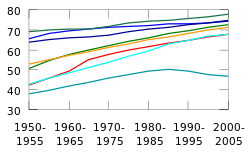
Some economists, such as Guy Pfeffermann, say that other non-monetary indicators of "absolute poverty" are also improving. Life expectancy has greatly increased in the developing world since World War II and is starting to close the gap to the developed world where the improvement has been smaller. Even in Sub-Saharan Africa, the least developed region, life expectancy increased from 30 years before World War II to a peak of about 50 years — before the HIV pandemic and other diseases started to force it down to the current level of 47 years. Child mortality has decreased in every developing region of the world.[10] The proportion of the world's population living in countries where per-capita food supplies are less than 2,200 calories (9,200 kilojoules) per day decreased from 56% in the mid-1960s to below 10% by the 1990s. Between 1950 and 1999, global literacy increased from 52% to 81% of the world. Women made up much of the gap: Female literacy as a percentage of male literacy has increased from 59% in 1970 to 80% in 2000. The percentage of children not in the labor force has also risen to over 90% in 2000 from 76% in 1960. There are similar trends for electric power, cars, radios, and telephones per capita, as well as the proportion of the population with access to clean water.[11]
Poverty Gap Index
The Poverty Gap Index is the mean distance below the poverty line as a proportion of the poverty line where the mean is taken over the whole population, counting the non-poor as having zero poverty gap.
Stats
Even if poverty may be lessening for the world as a whole, it continues to be an enormous problem:
- One third of deaths — some 18 million people a year or 50,000 per day — are due to poverty-related causes. That's 270 million people since 1990, the majority women and children, roughly equal to the population of the US.
- Every year nearly 11 million children die before their fifth birthday.
- In 2001, 1.1 billion people had consumption levels below $1 a day and 2.7 billion lived on less than $2 a day.
- 800 million people go to bed hungry every day.[12]
Other factors
The World Bank's Voices of the Poor initiative,[13] based on research with over 20,000 poor people in 23 countries, identifies a range of factors that poor people consider elements of poverty. Most important are those necessary for material well-being, especially food. Many others relate to social rather than material issues.
- precarious livelihoods
- excluded locations
- gender relationships
References
- ↑ US Department of Human Services, FAQ Poverty Guidelines and Poverty
- ↑ Rector, Robert E. and Johnson, Kirk A., Understanding Poverty in America, Executive Summary, Heritage Foundation, January 15, 2004, No. 1713
- ↑ Frank, Ellen, "Dr. Dollar: How Is Poverty Defined in Government Statistics?" Dollars & Sense magazine, January/February 2006. Accessed April 13, 2008
- ↑ "Measuring Poverty - Poverty is defined by deprivation, and can be measured with economic or social indicators.". https://www.boundless.com. Retrieved 12 March 2015. External link in
|website=(help) - ↑ Pogge, Thomas. "Measuring Poverty". http://thomaspogge.com/. Retrieved 12 March 2015. External link in
|website=(help) - ↑ Thorbecke, E., 2008. Multidimensional Poverty: Conceptual and Measurement Issues. In: Kakwani, N., Silber, J. (Eds.), The Many Dimensions of Poverty. Palgrave Macmillan, New York, pp. 3–20
- ↑ "New Data Show 1.4 Billion Live On Less Than US$1.25 A Day, But Progress Against Poverty Remains Strong". http://www.worldbank.org/. The World Bank. Retrieved 13 March 2015. External link in
|website=(help) - ↑ Worldbank.org reference
- ↑ TFF, 1999
- ↑ The Eight Losers of Globalization by Guy Pfeffermann. Pfeffermann, former Chief Economist of the International Finance Corporation, is the CEO of Global Business School Network. This is a non-profit organization supporting business and management education in the developing world. 2002.
It is an area where not only is there little or no consensus among disciplines, but where economists themselves have widely differing views. So, what can one say with a fair degree of certainty about growth and inequality in developing countries? Life expectancy at birth — the most basic and robust of all social indicators — has increased very considerably around the world.
- ↑ www.sciencedirect.org
- ↑ millenniumcampaign.org
- ↑ "Voices of the Poor". worldbank.org. THe World Bank. Retrieved 13 March 2015.
External links
Deprivation and poverty indicators | |||||||
|---|---|---|---|---|---|---|---|
| Social |
| ||||||
| Psychological |
| ||||||
| Economic |
| ||||||
| Physical |
| ||||||
| Complex measures | |||||||
| Gender |
| ||||||
| Other | |||||||
| |||||||