Energy in the United States
The United States was the 2nd largest energy consumer in 2010 (after China) considering total use.[1] The U.S. ranks seventh in energy consumption per-capita after Canada and a number of small nations.[2][3] Not included is the significant amount of energy used overseas in the production of retail and industrial goods consumed in the U.S.
The majority of this energy is derived from fossil fuels: in 2010, data showed 25% of the nation's energy came from petroleum, 22% from coal, and 22% from natural gas. Nuclear power supplied 8.4% and renewable energy supplied 8%,[4] which was mainly from hydroelectric dams and biomass but also included other renewable sources such as wind power, geothermal and solar energy.[5] Energy consumption has increased at a faster rate than domestic energy production over the last fifty years in the U.S. (when they were roughly equal). This difference is now largely met through imports.[6]
According to the Energy Information Administration's statistics, the per-capita energy consumption in the US has been somewhat consistent from the 1970s to today. The average has been 334 million British thermal units (BTUs) per person from 1980 to 2010. One explanation suggested for this is that the energy required to produce the increase in US consumption of manufactured equipment, cars, and other goods has been shifted to other countries producing and transporting those goods to the US with a corresponding shift of green house gases and pollution. In comparison, the world average has increased from 63.7 in 1980 to 75 million BTU's per person in 2008. On the other hand, US "off-shoring" of manufacturing is sometimes exaggerated: US domestic manufacturing has grown by 50% since 1980.
History
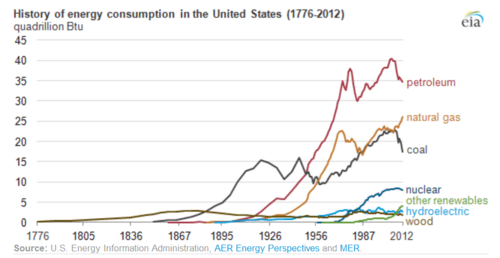
From its founding until the late 18th century, the United States was a largely agrarian country with abundant forests. During this period, energy consumption overwhelmingly focused on readily available firewood. Rapid industrialization of the economy, urbanization, and the growth of railroads led to increased use of coal, and by 1885 it had eclipsed wood as the nation's primary energy source.
Coal remained dominant for the next seven decades, but by 1950, it was surpassed in turn by both petroleum and natural gas. In 2007, coal consumption was the highest it has ever been, with coal mostly being used to generate electricity.[7] Natural gas, which is cleaner-burning and more easily transportable, has replaced coal as the preferred source of heating in homes, businesses and industrial furnaces. Although total energy use increased by approximately a factor of 50 between 1850 and 2000, energy use per capita increased only by a factor of four. As of 2009, United States per capita energy use had declined to 7075 (kilograms of oil-equivalent), 12% less than 2000, and through 2010 (most recent available) is at levels not seen since 1960s usage levels.[8] At the beginning of the 20th century, petroleum was a minor resource used to manufacture lubricants and fuel for kerosene and oil lamps. One hundred years later it had become the preeminent energy source for the U.S. and the rest of the world. This rise closely paralleled the emergence of the automobile as a major force in American culture and the economy.
While petroleum is also used as a source for plastics and other chemicals, and powers various industrial processes, today two-thirds of oil consumption in the U.S. is in the form of its derived transportation fuels.[9] Oil's unique qualities for transportation fuels in terms of energy content, cost of production, and speed of refueling all contributed to it being used over other fuels.
In June 2010, the American Energy Innovation Council, a group which includes Bill Gates, founder of Microsoft; Jeffrey R. Immelt, chief executive of General Electric; and John Doerr,[10] has urged the government to more than triple spending on energy research and development, to $16 billion a year. Mr. Gates endorsed the administration's goal of reducing greenhouse gas emissions by 80 percent by 2050, but said that was not possible with today's technology or politicism. He said that the only way to find such disruptive new technology was to pour large sums of money at the problem. The group notes that the federal government spends less than $5 billion a year on energy research and development, not counting one-time stimulus projects. About $30 billion is spent annually on health research and more than $80 billion on military R.& D. They advocate a jump in spending on basic energy research.[11]
US CO2 emissions have dropped about 1% per year through greater efficiency and a sluggish economy since 2008.
Current consumption
| Energy in the United States[12] | ||||||
|---|---|---|---|---|---|---|
| Capita | Prim. energy | Production | Import | Electricity | CO2-emission | |
| Million | TWh | TWh | TWh | TWh | Mt | |
| 2004 | 294.0 | 27,050 | 19,085 | 8,310 | 3,921 | 5,800 |
| 2007 | 302.1 | 27,214 | 19,366 | 8,303 | 4,113 | 5,769 |
| 2008 | 304.5 | 26,560 | 19,841 | 7,379 | 4,156 | 5,596 |
| 2009 | 307.5 | 25,155 | 19,613 | 6,501 | 3,962 | 5,195 |
| 2010 | 310.1 | 25,776 | 20,056 | 6,205 | 4,143 | 5,369 |
| 2012 | 312.0 | 25,484 | 20,757 | 5,322 | 4,127 | 5,287 |
| 2012R | 314.3 | 24,895 | 21,009 | 4,360 | 4,069 | 5,074 |
| 2013 | 316.5 | 25,451 | 21,876 | 3,586 | 4,110 | 5,120 |
| Change 2004-2010 | 5.5% | -4.7% | 5.1% | -25.3% | 5.7% | -7.4% |
| Mtoe = 11.63 TWh>, Prim. energy includes energy losses that are 2/3 for nuclear power[13]
2012R = CO2 calculation criteria changed, numbers updated | ||||||
Primary energy use in the United States was 25,155 TWh or about 81,800 kWh per person in 2009. Primary energy use was 1,100 TWh less in the US than in China in 2009. Same year the share of energy import in the US was 26% of the primary energy use. The energy import declined ca 22% and the annual CO2 emissions ca 10% in 2009 compared to 2004.[14]
Consumption by sector
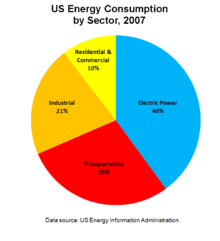
The U.S. Department of Energy tracks national energy consumption in four broad sectors: industrial, transportation, residential, and commercial. The industrial sector has long been the country's largest energy user, currently representing about 33% of the total. Next in importance is the transportation sector, followed by the residential and commercial sectors.
| Sector Name | Description | Major uses[15][16][17] |
|---|---|---|
| Industrial | Facilities and equipment used for producing and processing goods. | 22% chemical production 16% petroleum refining 14% metal smelting/refining |
| Transportation | Vehicles which transport people/goods on ground, air, or water. | 61% gasoline fuel 21% diesel fuel 12% aviation |
| Residential | Living quarters for private households. | 32% space heating 13% water heating 12% lighting 11% air conditioning 8% refrigeration 5% electronics 5% wet-clean (mostly clothes dryers) |
| Commercial | Service-providing facilities and equipment (businesses, government, other institutions). | 25% lighting 13% heating 11% cooling 6% refrigeration 6% water heating 6% ventilation 6% electronics |
Consumption by source
The breakdown of energy consumption by source is given here:
| Fuel type | 2006 US consumption in PWh[18] | 2006 World consumption in PWh[19] |
| Oil | 11.71 | 50.33 |
| Gas | 6.50 | 31.65 |
| Coal | 6.60 | 37.38 |
| Hydroelectric | 0.84 | 8.71 |
| Nuclear | 2.41 | 8.14 |
| Geothermal, wind, solar, wood, waste | 0.95 | 1.38 |
| Total | 29.26 | 138.41 |
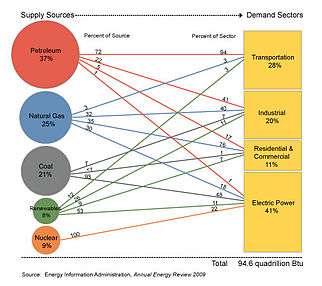
U.S, Primary Energy Consumption by Source and Sector in 2008 is tabled as following:
| Supply Sources | Percent of Source | Demand Sectors | Percent of Sector |
|---|---|---|---|
| Petroleum 37.1% |
71% Transportation 23% Industrial 5% Residential and Commercial 1% Electric Power |
Transportation 27.8% |
95% Petroleum 2% Natural Gas 3% Renewable Energy |
| Natural Gas 23.8% |
3% Transportation 34% Industrial 34% Residential and Commercial 29% Electric Power |
Industrial 20.6% |
42% Petroleum 40% Natural Gas 9% Coal 10% Renewable Energy |
| Coal 22.5% |
8% Industrial <1% Residential and Commercial 91% Electric Power |
Residential and Commercial 10.8% |
16% Petroleum 76% Natural Gas 1% Coal 1% Renewable Energy |
| Renewable Energy 7.3% |
11% Transportation 28% Industrial 10% Residential and Commercial 51% Electric Power |
Electric Power 40.1% |
1% Petroleum 17% Natural Gas 51% Coal 9% Renewable Energy 21% Nuclear Electric Power |
| Nuclear Electric Power 8.5% |
100% Electric Power |
Note: Sum of components may not equal 100 percent due to independent rounding.
Total Primary Consumption Historical Evolution in U.S until 2011.
Total Consumption until 2011 in Mtoe :[21]
| 1990 | 1991 | 1992 | 1993 | 1994 | 1995 | 1996 | 1997 | 1998 | 1999 | 2000 |
|---|---|---|---|---|---|---|---|---|---|---|
| 1,914 | 1,929.6 | 1,967.5 | 2,000.9 | 2,041.3 | 2,067.3 | 2,118.4 | 2,140.7 | 2,167.2 | 2,215.9 | 2,279.6 |
| 2001 | 2002 | 2003 | 2004 | 2005 | 2006 | 2007 | 2008 | 2009 | 2010 | 2011 | 2010-2011 | CAGR 2001-11 |
|---|---|---|---|---|---|---|---|---|---|---|---|---|
| 2,235.8 | 2,270.6 | 2,265.2 | 2,311 | 2,324.6 | 2,304.5 | 2,340.4 | 2,301.4 | 2,201.4 | 2,249 | 2,225 | -1.1% | -0.04% |
CAGR = Compound Annual Growth Rate Note: Total energy includes coal, gas, oil, electricity, heat and biomass.
Regional variation
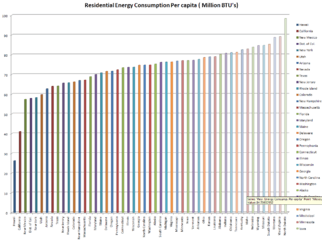
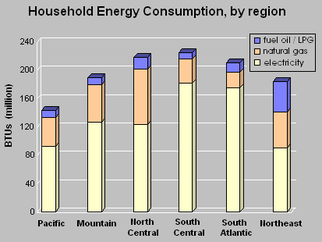

Household energy use varies significantly across the United States. An average home in the Pacific region (consisting of California, Oregon, and Washington) consumes 35% less energy than a home in the South Central region. Some of the regional differences can be explained by climate. The heavily populated coastal areas of the Pacific states experience generally mild winters and summers, reducing the need for both home heating and air conditioning. The warm, humid climates of the South Central and South Atlantic regions lead to higher electricity usage, while the cold winters experienced in the Northeast and North Central regions result in much higher consumption of natural gas and heating oil. The state with the lowest per capita energy use is New York, at 205 million Btu/yr,[24] and the highest is Wyoming, at slightly over 1 billion Btu/yr.[25]
Other regional differences stem from energy efficiency measures taken at the local and state levels. California has some of the strictest environmental laws and building codes in the country, leading its per-household energy consumption to be lower than all other states except Hawaii.
The land-use decisions of cities and towns also explain some of the regional differences in energy use. Townhouses are more energy efficient than single-family homes because less heat, for example, is wasted per person. Similarly, areas with more homes in a compact neighborhood encourage walking, biking and transit, thereby reducing transportation energy use. A 2011 U.S. E.P.A. study found that multi-family homes in urban neighborhoods, with well-insulated buildings and fuel-efficient cars, can save more than 2/3 of the energy used by conventionally built single-family houses in suburban areas (with standard cars).[26]
Renewable energy
Renewable energy in the United States accounted for 13.2 percent of the domestically produced electricity in 2014,[27] and 11.2 percent of total energy generation.[28] As of 2014, more than 143,000 people work in the solar industry and 43 states deploy net metering, where energy utilities buy back excess power generated by solar arrays.[29]
Renewable energy reached a major milestone in the first quarter of 2011, when it contributed 11.7 percent of total U.S. energy production (2.245 quadrillion BTUs of energy), surpassing energy production from nuclear power (2.125 quadrillion BTUs).[30] 2011 was the first year since 1997 that renewables exceeded nuclear in US total energy production.[31]
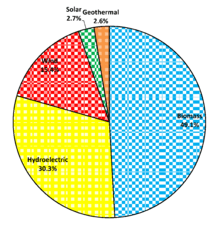
Hydroelectric power is currently the largest producer of renewable power in the U.S. It produced around 6.2% of the nation's total electricity in 2010 which was 60.2% of the total renewable power in the U.S.[32] The United States is the fourth largest producer of hydroelectricity in the world after China, Canada and Brazil. The Grand Coulee Dam is the 5th largest hydroelectric power station in the world.
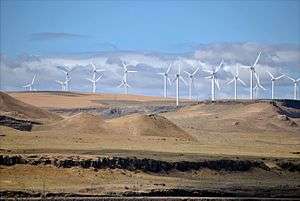
U.S. wind power installed capacity now exceeds 65,000 MW and supplies 4% of the nation's electricity.[33][34] Texas is firmly established as the leader in wind power development, followed by Iowa and California.[35]
The U.S. has some of the largest solar farms in the world. Solar Star is a 579 megawatt (MWAC) farm near Rosamond, California.[36] The Desert Sunlight Solar Farm is a 550 MW solar power plant in Riverside County, California[37] and the Topaz Solar Farm, a 550 MW photovoltaic power plant, is in San Luis Obispo County, California.[38] The solar thermal SEGS group of plants in the Mojave Desert has a total generating capacity of 354 MW.[39]
The Geysers in Northern California is the largest complex of geothermal energy production in the world.
The development of renewable energy and efficient energy use marks "a new era of energy exploration" in the United States, according to President Barack Obama.[40] Studies suggest that if there is enough political will it is feasible to supply the total United States with 100% renewable energy by 2050.[41][42]
Oil
For most of the twentieth century and the early part of the twenty-first century, the majority of energy consumed has been from oil - fossil fuel provided 81% of the world's energy in 2009, with oil the largest contribution.[43] The United States became a world power in the early 20th century as they increased development of oil production and influenced world oil reserves for growth and development.[44] As the 20th century developed, petroleum gained increasing importance by providing heating and power to the commercial and industrial sectors. Oil was also used in transportation; first for railroads and later for motor vehicles.[45]
As automobiles became more affordable, demand for oil quickly rose. Since the rise of the automobile industry, oil price, demand, and production have all increased. From 1900 to 1980, fuel was directly correlated with Gross National Product (GNP), oil shocks have often coincided with recessions, and the government has responded to oil shocks with a variety of methods.[46] In the 1920s, oil prices were peaking and many commentators believed that oil supplies were running out. Congress was confronted by requests to augment supplies, so a generous depletion allowance was enacted for producers in 1926, which increased investment returns substantially. This change induced additional exploration activity, and subsequently the discovery of large new oil reservoirs.[47]
The next decade the situation was reversed, with prices low and dropping. This led to demands for more "orderly" competition and set minimum oil prices. Rather than repealing the previous policies enacted in the 1920s, Congress enacted a price-support system. Similar cycles have occurred in the 1950s and 1970s.[47]
Price
With the exception of one, every US recession since World War II experienced a sharp increase in the price of oil. This correlation strongly signifies the US dependency of oil for the economy, as well as oil's importance in US development for most of the time since the war. Many of the key cases of crude oil price increases in the post-war period were associated with political upheaval from oil rich countries.[48] Domestic production and consumption were outpaced by US demand toward the end of the 1960s, and Middle Eastern nations gained a significant amount of political leverage in controlling prices based on their production.[46] Price increases have been directly related to increased investment and subsequent production in oil. Following World War II, European reconstruction was the primary objective of the United States economy, and investment eventually rose after a long-term price increase at the end of the war. During the 1950s, there were strikes by oil workers, production restrictions imposed by the Texas Railroad Commission, as well as the Suez Crisis and Korean War—all creating steep price increases, with prices only falling after production was able to meet demand. Peak Oil in the United States resulted in a definite decline of US reserves and even more strikes by oil workers. Additional singular events such as the OPEC embargo, the rupture of the Trans-Arabian Pipeline, and Iranian Nationalization of the oil industry led to further price increases that were never before seen. Each case was followed by a marked recession in the US economy.[48]
In 2008, oil prices rose briefly, to as high as $145/barrel,[49] and U.S. gasoline prices jumped from $1.37 to $2.37/gallon in 2005,[50] leading to a search for alternate sources, and by 2012, less than half of US oil consumption was imported. However, as of January 2015, the price of oil has collapsed to around $50/barrel.[51]
Consumption and production
In the twentieth century, oil production became of more value, as the US industrialized and developed commercial transportation, such as railroads and motor vehicles. Furthermore, oil consumption also increased due to electricity. After electricity, oil became more important in commercial, manufacturing and residential sectors such as heating and cooking. Therefore, during this period, the growth of oil consumption indicates that the United States was becoming dependent on oil and it aided the growth of the domestic oil industry. However, U.S oil domestic production could not cover the growing demand in the U.S market, which led the U.S to look for a new supply internationally.[45]
U.S. consumption of oil increased 53% between 1915 and 1919, followed by another increase of 27% in 1920. The first shock of the transportation era occurred in 1920 and lasted for about a year. The shortage of oil devastated the entire West Coast with hour-long lines for gasoline, and in many places fuel was not available for at least a week. Finally, big production from Texas, California and Oklahoma took the shortage of oil away causing oil prices to fall 40% between 1920 and 1926. The Great Depression in 1929 was a time with growing supply and falling demand causing the price of oil to decrease about 66% from 1926 to 1931.[45]
Toward the end of World War II, the automotive era settled rapidly, and the U.S. demand of oil increased 12% between 1945 and 1947 while motor vehicle registrations increased by 22%. Around 1948, demand of oil exceeded supply of oil, leading the U.S. to start importing oil. Therefore, the U.S. quickly became a major importer of oil, instead of being the major exporter.[45]
In 1952, due to a strike by US oil refinery workers, the United States and the United Kingdom cut 30% of fuel delivery to civilian flights, while Canada postponed all private flights. Until the 1960s, the price of oil was relatively stable and the world market could cover the excess demand of oil in the U.S. However, in 1973, the price of oil increased due to the Arab oil embargo against the U.S., following United States support of Israel in the Yom Kippur War. During that time, Arab oil producers reduced production 4.4mb/d for two months, 7.5% of global output. During this time, people reduced their consumption of oil by turning down thermostats and carpooling to work, which together with the lower demand due to the 1973-75 recession, resulted in a reduction in oil consumption.[45]
After the Crisis of 1973, price of oil increased again between 1979 and 1980 due to the Iranian revolution. This crisis was related to political instability in a major oil-exporting region. During this period, oil consumption decreased due to new efficiency. Cars at that time were developed so less oil was required and industrialization was also advanced to reduce the consumption of oil. This led to a decline in U.S. demand of oil and reduced the amount of international imports. The last energy crises in the U.S occurred in 1990. This occurred because Iraq invaded Kuwait. Similar to the previous crisis, price of oil increased and oil consumption decreased but by a smaller amount and had a smaller effect.[45]
In 2010, 70.5% of petroleum consumption in the U.S. was for transportation. Approximately 2/3 of transportation consumption was gasoline.[52] Today, U.S is still dependent on oil as oil is an important player socially, economically and politically. U.S. demand of oil is increasing exponentially causing the U.S. to continue to rely on foreign countries.[45]
Policy
Regulation of the oil market has been a major player in oil history. Policies affect the market in a variety of ways such as; price, production, consumption, supply and demand. The Oil market has a history of booms and troughs, which caused producers to demand government intervention. Many times this government involvement only made the situation worse, and many of the regulations were quickly ruled illegal and removed. Before World War II, many of the problems within the oil market were related to changing prices. During the 1920s, oil prices were beginning to peak leading to fears of oil depletion. In response to these fears, during Coolidge's term, Congress enacted a depletion allowance to producers which led to a surge of investment in the oil business and the discovery of many new, large oil reservoirs. The next decade consisted of falling prices due to the new investment and overproduction. The declining prices led producers to demand some form of price support system. One example of how prices were propped up was a pro-rationing order made by the Texas Railroad Commission, which restricted oil production and increased price. This order was soon ruled illegal by federal district court in 1931. The 1930s was the beginning of large federal intervention in the oil industry and began with the creation of the National Industrial Recovery Act, in 1933. This act allowed for natural price competition, instead of agreements between the major producers. However, this act was ruled unconstitutional in 1934.
While the time before World War II was filled with issues regarding price, the post war era consisted of increasing oil imports partly due to the price support established during the 1920s and 1930s. The artificially high domestic prices led to a surge of imports from lower priced foreign producers. In 1955, a clause was added to the Reciprocal Trade Act Amendments which gave the president the power to limit imports of a specific commodity, if that particular commodity was harmful to the security of the nation. This clause allowed Eisenhower to enact oil import quotas in 1959 which ultimately caused international oil prices to decline. These import quotas restricted international oil companies from the US market, and led them to form OPEC. During the 1970s, Richard Nixon put in place many phrases of price controls. After many new regulations that altered the original price control system, President Carter eventually began removing these controls in 1979.[47] During the Carter administration, in response to an energy crisis and hostile Iranian and Soviet Union relations, President Jimmy Carter announced the Carter Doctrine which declared that any interference with U. S. interests in the Persian Gulf would be considered an attack on U.S. vital interests.[53] Ronald Reagan later expanded this doctrine.[54] Since the 1990s, the oil market has been free of most regulations.[47]
Electrical energy
The United States of America (USA) is the world's second largest producer and consumer of electricity.[55] It consumes about 20%[56] of the world's supply of electricity. This section provides a summary of the consumption and generation of the USA Electric industry, based upon data mined from US DOE Energy Information Administration/Electric Power Annual 2013 files.[57] Data was obtained from the most recent DOE Energy Information Agency (EIA) files. Consumption is detailed from the residential, commercial, industrial, and other user communities. Generation is detailed for the major fuel sources of coal, natural gas, nuclear, petroleum, hydro and the other renewables of wind, wood, other biomass, geothermal and solar. Changes to the electrical energy fuel mix and other trends are identified. Progress in wind and solar contributions to the energy mix are addressed. Expected changes in the generation environment during the next 5 years are discussed.
Consumption
Electricity consumption data in this section is based upon data mined from US DOE Energy Information Administration/Electric Power Annual 2014 files[58] In 2014 the total US consumption of electric energy was 4,146.2 Terawatt hours (TWh) (or million MWh or billion kWh). This is broken down as:
- Residential customers (128.68 million) directly consumed 1,407.2 Terawatt hours or 33.93% of the total. This was essentially the same as in 2013. An average residential customer used 911 kWh/ month and with the average US commercial cost of $0.1252/kWh the average monthly electrical bill would be $114.06.
- Commercial customers (17.85 million) directly consumed 1,352.2 Terawatt hours or 32.61% of the total. This was about the same as in 2013. . An average commercial customer used 6311 kWh/month and with the average US commercial electric cost of $0.1074/kWh the average monthly electrical bill would be $677.84.
- Industrial customers (839.2 thousand) directly consumed 997.57 Terawatt hours or 24.06% of the total. This was essentially the same as in 2013 (+0.27%)
- Transportation customers (79) directly consumed 7.76 Terawatt hours or 0.19% of the total. This was the same as in 2013.
- System loss throughout the total electrical grid infrastructure by direct use of the suppliers (139 TWh)[59] and for transmission and other system losses and for unaccounted for loads (244 TWh) amounts to 387.9 TWh or 9.21% of the total which is down 0.2% from 2013. Thus, one could say that the US electric distribution system is 90.79% efficient and efficiency has improved over the last year.
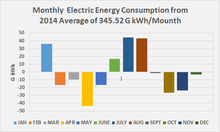
A profile of the electric energy consumption [60] for 2014 is shown in the following graph. Deviations from the monthly average of 345.52 G Kwhs for each month is shown. The April minimum of 302.02 G Kwhs to the July peak of 390.17 G Kwhs shows the range of consumption variations.
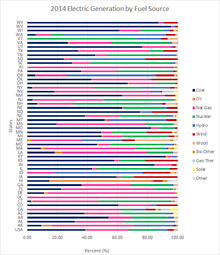
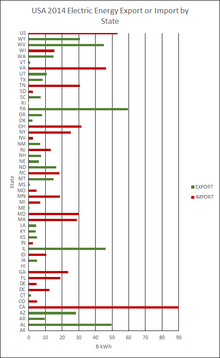
The following table derived from data mined from Electric Power Annual .[62][63] identifies those states which must import electrical energy from neighboring states to meet their consumption needs. Each state's total electric generation for 2014 is compared with the states consumption and its share of the system loss and the difference between the generated electric energy and its total consumption (including its share of the system loss) is the amount of energy it imports. For Hawaii (HI) total consumption equals generated energy. For the other states, multiplying their direct consumption by 1.101562245 (4136613879/3755224815), results in USA supply (including net imports) being equal to USA total consumption.
The following chart provides the details. Two graphics showing each states situation with respect to electric energy consumption and generation provide the visual recognition.

| STATE | CONSUMPTION | GENERATION | STATE IMPORTS | |||||
|---|---|---|---|---|---|---|---|---|
| Retail Sales (MWh) | Total Usage (MWh) | MWh's | % 2014 | % 2013 | % 2012 | % 2011 | ||
| CA | 262,584,786 | 289,253,486 | 198,807,622 | 90,445,865 | 34.4% | 33.90% | 34.00% | 33.70% |
| VA | 112,098,381 | 123,483,344 | 77,137,438 | 46,345,906 | 41.3% | 40.80% | 45.20% | 49.90% |
| OH | 150,679,713 | 165,983,083 | 134,476,405 | 31,506,678 | 20.9% | 19.10% | 25.70% | 22.80% |
| TN | 100,219,230 | 110,397,720 | 79,506,886 | 30,890,834 | 30.8% | 28.20% | 30.20% | 29.90% |
| MD | 61,683,869 | 67,948,621 | 37,833,652 | 30,114,969 | 48.8% | 52.50% | 49.70% | 44.60% |
| MA | 54,469,292 | 60,001,316 | 31,118,591 | 28,882,724 | 53.0% | 50.90% | 45.40% | 41.90% |
| NY | 147,371,913 | 162,339,335 | 137,122,202 | 25,217,133 | 17.1% | 18.40% | 16.00% | 14.80% |
| GA | 135,789,932 | 149,581,062 | 125,837,224 | 23,743,839 | 17.5% | 17.70% | 17.50% | 18.90% |
| FL | 226,078,111 | 249,039,111 | 230,015,937 | 19,023,174 | 8.4% | 10.20% | 10.70% | 11.80% |
| MN | 68,719,367 | 75,698,660 | 56,998,330 | 18,700,330 | 27.2% | 35.70% | 34.10% | 32.90% |
| NC | 133,132,776 | 146,654,040 | 128,143,588 | 18,510,451 | 13.9% | 13.40% | 19.70% | 20.10% |
| WI | 69,494,755 | 76,552,798 | 61,064,796 | 15,488,003 | 22.3% | 15.00% | 18.20% | 18.10% |
| NJ | 73,866,078 | 81,368,083 | 68,051,086 | 13,316,997 | 18.0% | 23.70% | 23.90% | 26.20% |
| DC | 11,193,589 | 12,330,435 | 67,612 | 12,262,823 | 109.6% | 109.80% | 110.20% | 108.60% |
| ID | 23,233,284 | 25,592,908 | 15,184,417 | 10,408,492 | 44.8% | 47.60% | 45.50% | 39.20% |
| MI | 103,314,098 | 113,806,910 | 106,816,991 | 6,989,919 | 6.8% | 8.10% | 7.60% | 6.50% |
| CO | 53,396,521 | 58,819,592 | 53,847,386 | 4,972,206 | 9.3% | 11.40% | 12.90% | 14.20% |
| DE | 11,338,477 | 12,490,038 | 7,703,584 | 4,786,455 | 42.2% | 42.00% | 35.90% | 53.00% |
| MO | 83,878,397 | 92,397,275 | 87,834,468 | 4,562,807 | 5.4% | 0.60% | 0.5%EXP | 2% EXP |
| NV | 35,075,606 | 38,637,963 | 36,000,537 | 2,637,426 | 7.5% | 6.90% | 10.90% | 16.20% |
| SD | 12,354,726 | 13,609,500 | 10,995,240 | 2,614,260 | 21.2% | 27.60% | 8.30% | 7.60% |
| IN | 106,942,504 | 117,803,825 | 115,395,392 | 2,408,433 | 2.3% | 5.80% | 1.80% | 4.4%EXP |
| RI | 7,643,104 | 8,419,355 | 6,281,748 | 2,137,607 | 28.0% | 30.10% | 3% | 2.2% EXP |
| AK | 6,164,812 | 6,790,924 | 6,042,830 | 748,095 | 12.1% | 6.80% | 2.60% | 1.60% |
| SUM | 2,050,723,321 | 2,258,999,385 | 1,812,283,962 | 446,715,424 | ||||
Generation
Data in this section is based upon data mined from US DOE Energy Information Administration/Electric Power Annual(EPA) 2014[58]
United States 1,068.4 Gigawatt power infrastructure [64] produced[65] 4,093.6 Billion kWhs (B kWhs) in 2014. USA imports [66] minus exports was 53.2 B kWhs for a total of 4,146.8 B kWh of electrical energy for U.S. use. Electrical energy generated from Coal was 1,581.71 B kWhs (38.14%); Natural and other Gases, 1,138.63 B kWhs (27.46%); Nuclear, 797.17 B kWhs (19.22%); Hydro, 259.37 B kWhs (6.25%); Renewables (other than Hydro), 279.21 B kWhs (6.74%); Imports less exports, 53.2 B kWh (1.3%); Petroleum, 30.23 B kWhs (0.7%); and Misc (including pumped storage) 6.29 B kWhs (0.1%). United States' renewable fuels (Hydro reported separately) are Wind, 181.66 B kWhs (4.38%); Wood, 42.34 B kWh (1.02%); other Biomass, 21.65 B kWhs (0.52% ); Geothermal, 15.88 B kWhs (0.38%) and Solar, 17.69 B kWhs (0.43%). The following tables summarize the electrical energy generated by fuel source for the United States. Data from Electric Power Annual 2014[58] was used throughout this section.
| Power Source | Plants | Summer Capacity (GW) | % of Summer Capacity | Capacity factor | Annual Energy (billion kWh) | % of Total USA Electric Supply |
|---|---|---|---|---|---|---|
| Coal | 491 | 299.1 | 27.99 | 0.604 | 1,581.71 | 38.14 |
| Nat Gas+ | 1,792 | 434.2 | 40.64 | 0.299 | 1138.63 | 27.46 |
| Nuclear | 62 | 98.6 | 9.23 | 0.923 | 797.17 | 19.22 |
| Hydro | 1,441 | 79.7 | 7.46 | 0.371 | 259.37 | 6.25 |
| Other Renewables | 2,674 | 90.5 | 8.47 | 0.352 | 279.21 | 6.73 |
| Petroleum | 1,082 | 41.1 | 3.85 | 0.084 | 30.23 | 0.73 |
| Other | 94 | 2.8 | .26 | 0.549 | 13.46 | 0.32 |
| Storage | 41 | 22.5 | 2.11 | -0.031 | -6.17 | -0.15 |
| Import | 53.21 | 1.28 | ||||
| Total | 7,677 | 1068.5 | 100 | 0.443 | 4,146.82 | 100 0508 |
- Note: The number of facilities is counted, not the number of wind turbines or number of nuclear reactors.
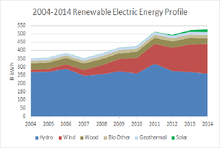
| Power Source | Plants | Summer Capacity (GW) | % of Renewable Capacity | % of Total Capacity | Capacity Factor | Annual Energy (billion kWh) | % of Renewable Energy | % of Total US |
|---|---|---|---|---|---|---|---|---|
| Hydro | 1441 | 79.7 | 46.80 | 7.45 | 0.371 | 259.37 | 48.16 | 6.25 |
| Wind | 64.23 | 37.72 | 6.01 | 0.323 | 181.66 | 33.73 | 4.38 | |
| Wood | 8.37 | 4.91 | 0.78 | 0.577 | 42.34 | 7.86 | 1.02 | |
| Biomass | 5.17 | 3.04 | 0.48 | 0.478 | 21.65 | 4.02 | 0.52 | |
| GeoThermal | 2.51 | 1.47 | 0.23 | 0.722 | 15.88 | 2.95 | 0.38 | |
| Solar | 10.32 | 6.06 | 0.96 | 0.196 | 17.69 | 3.28 | 0.43 | |
| Total | 4115 | 170.3 | 100 | 15.94 | 0.361 | 538.58 | 100 | 12.99 |
The following provides yearly summaries of electrical energy generation by fuel source.
| Year | Fossil Fuel | Nuclear | Renewable | Misc | Total | |||||||||
|---|---|---|---|---|---|---|---|---|---|---|---|---|---|---|
| Coal | Oil | Gas | sub total |
Hydro | Geo Thermal |
Solar | Wind | Wood | Bio other |
sub total | ||||
| 2015 | 1,356.06 | 28.44 | 1,348.03 | 2,732.53 | 797.18 | 251.17 | 16.77 | 26.47 | 190.93 | 42.36 | 21.83 | 549.53 | 8.15+ | 4,087.39+ |
| 2014 | 1,581.71 | 30.23 | 1,138.63 | 2,750.57 | 797.17 | 259.37 | 15.88 | 17.69 | 181.655 | 42.34 | 21.65 | 538.58 | 60.50 | 4,146.2 |
| Proportion 2014 | 38.14% | 0.73% | 27.46% | 66.33% | 19.22% | 6.25% | 0.38% | 0.43% | 4.38% | 01.02% | 0.52% | 12.99% | 1.46% | 100.0% |
| 2013 | 1,581.12 | 27.16 | 1,137.69 | 2,745.97 | 789.02 | 268.57 | 15.78 | 9.04 | 167.84 | 40 | 20.83 | 522.07 | 55.64 | 4,112.7 |
| 2012 | 1,514.04 | 23.19 | 1,237.79 | 2,775.02 | 769.33 | 276.24 | 15.56 | 4.33 | 140.82 | 37.8 | 19.82 | 494.57 | 56.1 | 4095 |
| 2011 | 1,733.4 | 30.2 | 1,025.3 | 2,788.9 | 790.2 | 319.4 | 15.3 | 1.82 | 120.2 | 37.4 | 19.2 | 513.32 | 46 | 4138.4 |
| 2010 | 1,847.3 | 37.1 | 999.0 | 2,883.4 | 807.0 | 260.2 | 15.2 | 1.21 | 94.7 | 37.2 | 18.9 | 427.4 | 33.3 | 4,151.0 |
| Proportion 2010 | 44.5% | 0.9% | 24.1% | 69.5% | 19.4% | 6.3% | 0.37% | 0.029% | 2.3% | 0.9% | 0.5% | 10.3% | 0.8% | 100.0% |
| 2009 | 1,755.9 | 38.9 | 931.6 | 2,726.5 | 798.9 | 273.4 | 15.0 | 0.89 | 73.9 | 36.1 | 18.4 | 417.7 | 41.4 | 3,984.4 |
| 2008 | 1,985.8 | 46.2 | 894.7 | 2,926.7 | 806.2 | 254.8 | 14.8 | 0.86 | 55.4 | 37.3 | 17.7 | 380.9 | 38.3 | 4,152.2 |
| 2007 | 2,016.5 | 65.7 | 910.0 | 2,992.2 | 806.4 | 247.5 | 14.6 | 0.61 | 34.5 | 39.0 | 16.5 | 352.7 | 36.6 | 4,188.0 |
| 2000 | 1,966 | 111 | 615 | 2,692 | 754 | 260 | 14 | 0.49 | 5.6 | 37.6 | 23 | 318.7 | 38.6 | 3,836 |
| Proportion 2000 | 51.3% | 2.9% | 16.0% | 70.2% | 19.7% | 7.2% | 0.37% | 0.013% | 0.15% | 1.0% | 0.6% | 9.3% | 0.9% | 100.0% |
| 1999 | 1,881 | 118 | 57l | 2,570 | 728 | 319.5 | 14.8 | 0.50 | 4.5 | 37 | 22.6 | 392.8 | 55 | 3,723.8 |
Notes:
- Gas includes natural gas and other gases.
- Solar includes photovoltaics and thermal.
- Bio other includes waste, landfill gas, and other.
- Hydro excludes pumped storage (not an energy source, used by all sources, other than hydro).
- Misc includes misc generation, pumped storage, and net imports.
- Total includes net imports.
- 2015 data is from Electric Power Monthly and does not include import-export data.[70]
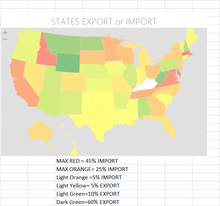
Using the data from the US DOE Energy Information Administration/Electric Power Annual 2014 files[71] Data was obtained from the most recent DOE Energy Information Agency (EIA) full year files.[72] The following table derived from data mined from Electric Power Annual .[62][63] identifies those states which generate more electrical energy than they need to meet their consumption needs. They supply those that need additional energy. Each states total electric generation for 2014 is compared with the states consumption and its share of the system loses and the difference between the generated electric energy and its total consumption (including its share of the system loses) is the amount of energy it exports. For Hawaii (HI), total consumption equals generated energy. For the other states multiplying their direct consumption by 1.101562245 (4136613879/3755224815) results in USA supply (including net imports) being equal to USA total consumption usage. State export is determined by subtracting the state's total consumption from its generation.
| STATE | GENERATION | CONSUMPTION | STATE EXPORTS | |||||
|---|---|---|---|---|---|---|---|---|
| Retail Sales (Mwh) | Total Usage (Mwh) | Mwh's | % 2014 | % 2013 | % 2012 | % 2011 | ||
| PA | 221,058,365 | 146,687,698 | 161,585,630 | 59,472,736 | 26.9% | 28.80% | 28.20% | 27.90% |
| AL | 149,340,447 | 90,493,727 | 99,684,473 | 49,655,974 | 33.3% | 35.60% | 37.50% | 37.20% |
| IL | 202,143,878 | 141,540,287 | 155,915,436 | 46,228,442 | 22.9% | 22.90% | 19.50% | 20.90% |
| WV | 81,059,577 | 32,696,106 | 36,016,796 | 45,042,781 | 55.6% | 54.30% | 53.50% | 56.40% |
| WY | 49,696,183 | 17,134,075 | 18,874,250 | 30,821,933 | 62.0% | 64.10% | 62.10% | 59.60% |
| AZ | 112,257,187 | 76,297,685 | 84,046,649 | 28,210,538 | 25.1% | 26.30% | 25.00% | 23.50% |
| ND | 36,462,508 | 18,239,732 | 20,092,200 | 16,370,308 | 44.9% | 49.50% | 54.80% | 56.80% |
| WA | 116,334,363 | 92,140,777 | 101,498,801 | 14,835,561 | 12.8% | 10.20% | 12.40% | 10.20% |
| MT | 30,257,616 | 14,102,392 | 15,534,663 | 14,722,953 | 48.7% | 44.00% | 44.70% | 49.50% |
| UT | 43,784,526 | 30,043,019 | 33,094,255 | 10,690,270 | 24.4% | 20.90% | 16.40% | 22.00% |
| AR | 61,592,137 | 47,080,301 | 51,861,882 | 9,730,255 | 15.8% | 14.60% | 20.10% | 13.70% |
| TX | 437,629,668 | 389,669,820 | 429,245,562 | 8,384,106 | 1.9% | 3.50% | 5.80% | 4.70% |
| OR | 60,119,907 | 47,334,953 | 52,142,397 | 7,977,510 | 13.3% | 12.20% | 15.10% | 12.80% |
| NH | 19,538,395 | 10,944,081 | 12,055,586 | 7,482,809 | 38.3% | 38.40% | 29.90% | 33.40% |
| SC | 97,158,465 | 81,619,765 | 89,909,252 | 7,249,213 | 7.5% | 8.90% | 10.90% | 13.70% |
| NM | 32,306,210 | 23,115,222 | 25,462,856 | 6,843,354 | 21.2% | 29.00% | 29.90% | 33.40% |
| NE | 39,431,291 | 30,222,168 | 33,291,599 | 6,139,692 | 15.6% | 8.60% | 0.10% | 9.30% |
| KS | 49,728,363 | 40,561,606 | 44,681,134 | 5,047,229 | 10.1% | 9.20% | IMP 0.6% | 0.80% |
| IA | 56,853,282 | 47,201,853 | 51,995,779 | 4,857,503 | 8.5% | 8.90% | 10.60% | 10.60% |
| LA | 104,229,402 | 90,628,316 | 99,832,731 | 4,396,670 | 4.2% | 7.10% | 9.20% | 9.60% |
| KY | 90,896,435 | 78,838,924 | 86,845,982 | 4,050,453 | 4.5% | 4.50% | 9.80% | 0.50% |
| OK | 70,155,504 | 61,573,374 | 67,826,904 | 2,328,600 | 3.3% | 10.20% | 15.60% | 11.50% |
| CT | 33,676,980 | 29,354,460 | 32,335,765 | 1,341,216 | 4.0% | 7.50% | 9.50% | 2.30% |
| VT | 7,031,394 | 5,569,861 | 6,135,549 | 895,845 | 12.7% | 10.40% | 7.00% | 9.60% |
| MS | 55,127,092 | 49,408,631 | 54,426,682 | 700,409 | 1.3% | 2.2% IMP | 1.70% | 5.8% IMP |
| ME | 13,248,710 | 12,002,661 | 13,221,678 | 27,032 | 0.2% | 6.70% | 11.20% | 21.10% |
| HI | 10,204,158 | 9,475,452 | 10,204,158 | 0 | 0.0% | 0.00% | 0.00% | 0.00% |
| NET IMP | 53,212,032 | |||||||
| SUM | 2,281,322,043 | 1,713,976,946 | 1,887,818,650 | 446,715,425 | ||||
Trends
In 2014 USA's electrical energy usage was 4.11% more than in 2004. It was 1% less than the peak in 2007. It was 0.6% more than in 2013. Per capita consumption has decreased about 6.4% since its peak in 2007 and every year since has shown a decrease in individual consumption. Conservation efforts are helping. At least, for the next decade, coal, natural gas, and nuclear will remain the top three fuels for electric energy generation in the USA. Coal will continuously decrease its contribution with natural gas increasing its contribution. Nuclear will have some downs (decommissionings) and ups (new online plants) but probably remain about constant. Hydro will maintain. Petroleum will continue to decrease in importance. Wind and solar will continue to grow in importance; their combined generation was 4.87% of US electric generation for 2014 or 4.81% of total US consumption.
Projections
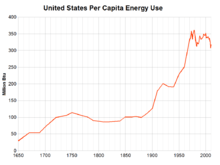
From the beginning of the United States until 1973, total energy (including electrical) use increased by about 3%/year, while population increased an average of 2.2%/year. Per capita energy use from 1730 to 1870 was about 100 million Btu/person. In the 20th century this increased to 300 million (332 million Btu/person/year, 97 thousand kWh/person/year in 1981).[75] Due to efficiency improvements this could drop considerably.
A concentrating solar array (CSP) with thermal storage has a practical capacity factor of 33%,[76] and could provide power 24 hours a day. Prior to 2012, in six southwestern states (Arizona, California, Colorado, Nevada, New Mexico, and Utah) the US Bureau of Land Management (BLM) owned nearly 98 million acres (an area larger than the state of Montana) that was open to proposals for solar power installations. To streamline consideration of applications, the BLM produced a Programmatic Environmental Impact Statement (PEIS). By the subsequent Record of Decision in October 2012, the BLM withdrew 78 percent of its land from possible solar development, leaving 19 million acres still open to applications for solar installations, an area nearly as large as South Carolina. Of the area left open to solar proposals, the BLM has identified 285 thousand acres in highly favorable areas it calls Solar Energy Zones.[77] In Spain, with natural gas backups, CSP has reached a capacity factor of 66%, with 75% being a theoretical maximum.[78]
Energy consumption of computers in the USA
Visible or embedded (i. e. hidden) computers are found everywhere: in all sectors listed in the above chapter, as well as in all subsectors listed in the column entitled Major uses in the above tables. In 1999, a study by Mark. P. Mills[79] of the Green Earth Society reported that computers consumed 13% of the entire US supply. Numerous researchers questioned Mills' methodology and it was later demonstrated that he was off by an order of magnitude; for example, Lawrence Berkeley Labs concluded that the figure was nearer three percent of US electricity use. Although the Mills study was inaccurate,[80][81][82] it helped drive the debate to the national level, and in 2006 the US Senate started a study of the energy consumption of Server farms.
Fossil-fuel equivalency
The total energy consumption reported above from the Annual Energy Review has been adjusted by a fossil-fuel equivalency factor in order to estimate how much oil would be required to supply all of the energy used. While there is 3,412 Btu per kWh, a factor of 10,460 Btu/kWh was used for nuclear and 9,760 Btu/kWh for renewable energy, for 2010, to reflect how much oil would be required. This inflates the reported total energy consumption, and roughly triples the apparent share from non-fossil fuel sources. As oil is less important, this adjustment may be removed, as is largely the case in other countries.[83][84]
International cooperation
President Barack Obama and China's President Hu Jintao announced a far-reaching package of measures to strengthen cooperation between the United States and China on clean energy, 17 November 2010. The presidents began by establishing a U.S.-China Clean Energy Research Center to facilitate joint research and development of renewable energy technologies by scientists from both countries. The center will be supported by $150 million in public and private funds over the next five years, split evenly between the partners. Initial research priorities will be developing better energy efficiency by way of things like electric vehicles.
The two countries will also leverage private sector resources to develop clean energy projects in China through the U.S.-China Energy Cooperation Program (ECP). More than 22 companies are founding members of the program. The ECP will include collaborative projects involving renewable energy, smart grids, electric vehicles, green buildings, combined heat and power and energy efficiency.[85]
See also
- Carter Doctrine
- The Climate Registry
- Efficient energy use
- Energy conservation
- Energy development
- Energy conservation in the United States
- Energy policy of the United States
- Electricity sector of the United States
- Energy security
- World energy resources
- World energy consumption
- List of countries by energy consumption and production
- List of countries by energy consumption per capita
- List of U.S. states by electricity production from renewable sources
- Petroleum in the United States
- Individual states:
References
- ↑ Barr, Robert. "China surpasses US as top energy consumer". Associated Press. Retrieved 16 June 2012.
- ↑ World Per Capita Total Primary Energy Consumption,1980-2005 (MS Excel format)
- ↑ World Resources Institute "Energy Consumption: Consumption per capita" (2001). Nations with higher per-capita consumption are: Qatar, Iceland, United Arab Emirates, Bahrain, Luxembourg and Canada. Except for Canada, these are small countries with a prominent energy-intensive industry such as oil refining or steelmaking.
- ↑ See #Fossil-fuel equivalency - these figures are actually closer to 2.8% each.
- ↑ US Dept. of Energy, "Annual Energy Report" (2010), Energy Flow diagram
- ↑ Ristinen, Robert, A. Energy and the Environment. Malloy, 2006. Print.
- ↑ Annual Coal Report
- ↑ "World Development Indicators - Google Public Data Explorer".
- ↑ US Dept. of Energy, "Energy in the United States: 1635-2000"
- ↑ "Who We Are". American Energy Innovation Council. Retrieved 2015-01-06.
- ↑ Broder, John M. (2010-06-09). "A Call to Triple U.S. Spending on Energy Research". The New York Times.
- ↑ IEA Key World Energy Statistics Statistics 2015, 2014 (2012R as in November 2015 + 2012 as in March 2014 is comparable to previous years statistical calculation criteria, 2013, 2012, 2011, 2010, 2009, 2006 IEA October, crude oil p.11, coal p. 13 gas p. 15
- ↑ Energy in Sweden 2010, Facts and figures, The Swedish Energy Agency, Table 8 Losses in nuclear power stations Table 9 Nuclear power brutto
- ↑ IEA Key World Energy Statistics 2011 October 2011
- ↑ US Dept. of Energy, "Manufacturing Trend Data" (2002), Table 2b
- ↑ US Dept. of Energy, "Annual Energy Outlook" (February 2006), Table A2
- ↑ US Dept. of Energy, "Buildings Energy Data Book" (September 2006), sec. 1.2.3
- ↑ Energy Information Administration (August 2005). "2004 U. S. Energy Consumption by Energy Source". Retrieved 2007-05-25.
- ↑ "World Consumption of Primary Energy by Energy Type and Selected Country Groups , 1980-2004" (XLS). Energy Information Administration. July 31, 2006. Retrieved 2007-01-20.
- ↑ US Dept. of Energy, "U.S. Primary Energy Consumption by Source and Sector, 2008" (2009)
- ↑ "World Energy Consumption: Map, Figures by Region - Enerdata".
- ↑ U.S. Energy Information Administration (2009), Consumption Estimates, retrieved 2011-10-03
- ↑ New York City Mayor's Office of Sustainability (2007). "New York City's Climate Change Challenges through 2030" (PDF). Retrieved 2007-02-28.
- ↑ Danielle Kurtzleben. "The 10 States that Use the Least Energy Per Capita". US News & World Report.
- ↑ Danielle Kurtzleben. "The 10 States that Use the Most Energy Per Capita". US News & World Report.
- ↑ http://www.epa.gov/dced/pdf/location_efficiency_BTU.pdf
- ↑ US Energy Information Administration, Electric Power Monthly, January 2013.
- ↑ US Energy Information Administration,Energy monthly, accessed 6 Nov. 2013.
- ↑ Editorial Board (26 April 2014). "The Koch Attack on Solar Energy". New York Times.
- ↑ Ron Pernick and Clint Wilder (2012). "Clean Tech Nation" (PDF). p. 5.
- ↑ US Energy Information Administration, Total Energy.
- ↑ "Direct Federal Financial Interventions and Subsidies in Energy in Fiscal Year 2013". Energy Information Administration. Retrieved 10 November 2015.
- ↑ US Energy Information Administration, , September 2013.
- ↑ "AWEA 4th quarter 2012 Public Market Report" (PDF). American Wind Energy Association (AWEA). January 2013. Retrieved January 30, 2013.
- ↑ American Wind Energy Association, Annual U.S. wind power rankings track industry's rapid growth
- ↑ "Solar Star, Largest PV Power Plant in the World, Now Operational". GreenTechMedia.com. 24 June 2015.
- ↑ "DOE Closes on Four Major Solar Projects". Renewable Energy World. 30 September 2011.
- ↑ Steve Leone (7 December 2011). "Billionaire Buffett Bets on Solar Energy". Renewable Energy World.
- ↑ SEGS I, II, III, IV, V, VI, VII, VIII & IX
- ↑ President Obama Touts Clean Energy on Earth Day
- ↑ M.Z. Jacobson et al. 2015: 100% clean and renewable wind, water, and sunlight (WWS) all-sector energy roadmaps for the 50 United States. Energy and Environmental Science Issue 8, p. 2093-2117. doi:10.1039/C5EE01283J.
- ↑ M.Z. Jacobson et al. 2015: Low-cost solution to the grid reliability problem with 100% penetration of intermittent wind, water, and solar for all purposes. Proceedings of the National Academy of Sciences Issue 112, Number 49, p. 15060–15065. doi:10.1073/pnas.1510028112.
- ↑ Global Status Report
- ↑ "What role have natural resources played in the politics and economy of the Middle East?". Global Connections. Public Broadcasting System (PBS). Retrieved 22 June 2014.
- 1 2 3 4 5 6 7 Hamilton, James. "Historical Oil Shocks" (PDF). Econweb. University of California, San Diego. Retrieved 22 June 2014.
- 1 2 Cleveland, Cutler J.; Costanza, Robert; Hall, Charles A. S.; Kaufmann, Robert. "Energy and the U.S. Economy: A Biophysical Perspective" (PDF). oilcrisis. Science. Retrieved 22 June 2014.
- 1 2 3 4 Van Doren, Peter. "A Brief History of Energy Regulations" (PDF). downsizinggovernment. CATO Institute. Retrieved 22 June 2014.
- 1 2 Hamilton, James D. "Oil and the Macroeconomy since World War II". The Journal of Political Economy. The University of Chicago Press.
- ↑ "History and Analysis -Crude Oil Prices".
- ↑ "GAO-05-525SP, Motor Fuels: Understanding the Factors That Influence the Retail Price of Gasoline". 2 May 2005.
- ↑ Moore, Stephen (2011-10-01). "How North Dakota Became Saudi Arabia: Harold Hamm, discoverer of the Bakken fields of the northern Great Plains, on America's oil future and why OPEC's days are numbered.". Wall Street Journal. Retrieved 2011-10-01.
When OPEC was at its peak in the 1990s, the U.S. imported about two-thirds of its oil. Now we import less than half of it, and about 40% of what we do import comes from Mexico and Canada.
- ↑ Petroleum Flow 2010
- ↑ Carter, Jimmy (1980-01-23). "Third State of the Union Address". Jimmy Carter Presidential Library. Retrieved 2008-07-27.
- ↑ Dumbrell, John (1996). American Foreign Policy: Carter to Clinton. MacMillan. p. 81. ISBN 978-0-312-16395-2. Retrieved 2008-07-27.
- ↑ "United States: Energy". CIA World Factbook 2009. Retrieved 15 June 2012.
- ↑ retrieved 2012-3-25 Archived May 15, 2012, at the Wayback Machine.
- ↑ "Electric Power Annual" retrieved 2015-4-17
- 1 2 3 "Electric Power Annual" retrieved 2016-2-25
- ↑ "Electric Power Annual 2014 " retrieved 2016-2-25
- ↑ Electric Power Monthly Net Generation retrieved 2016-03-09
- ↑ "Electric Power Monthly" retrieved 2016-3-6
- 1 2 3 EPA State Generation retrieved 2016-02-27
- 1 2 3 EPA State Sales retrieved 2016-02-27
- ↑ "EPA Generating Capacity" retrieved 2016-2-25
- 1 2 "EPA Net Generation " retrieved 2016-2-25
- ↑ "EPA Import/Export " retrieved 2016-2-24
- ↑ "EPA Import/Export"Import/Export retrieved 2016-2-25
- ↑ "Existing Capacity" Existing Capacity retrieved 2016-2-25
- ↑ "Electric Power Monthly" retrieved 2016-3-4
- ↑ "Electric Power Monthly" retrieved 2016-3-4
- ↑ "Electric Power Annual" retrieved 2016-02-25
- ↑ "Electric Power Annual State Data" retrieved 2016-02-27
- ↑ EPA State Generation retrieved 2016-02-23
- ↑ EPA State Sales retrieved 2016-02-23
- ↑ "Per capita energy consumption has declined in the United States". Knowledge Problem.
- ↑
- ↑ US Bureau of Land Management, Solar Energy Program, 29 Nov. 2014.
- ↑
- ↑ Mills, M.P. (1999). The Internet Begins with Coal. Green Earth Society, USA.
- ↑ Allan Chen, "Research finds computer-related energy use to be overestimated" (February 2001)
- ↑ Brian Hayes, "The computer and the dynamo" (September 2001)
- ↑ Information Technology and Resource Use, Lawrence Berkeley National Laboratory
- ↑ Alternatives for Estimating Energy Consumption
- ↑ Approximate Heat Rates for Electricity Table A6
- ↑ "EERE News: United States and China to Cooperate on Clean Energy".
Further reading
- GA Mansoori, N Enayati, LB Agyarko (2016), Energy: Sources, Utilization, Legislation, Sustainability, Illinois as Model State, World Sci. Pub. Co., ISBN 978-981-4704-00-7
- Tough Love for Renewable Energy; Making Wind and Solar Power Affordable May/June 2012 Foreign Affairs
External links
- Energy Information Administration - Official Energy Statistics from the U.S. Government's Energy Information Administration
- Biomass Energy Data Book
- Buildings Energy Data Book
- Power Technologies Energy Data Book (complete)
- Transportation Energy Data Book
- Interactive United States Energy Comparisons
- Renewable Energy Tops 10% of U.S. Energy Production
- U.S. Energy System Factsheet by the University of Michigan's Center for Sustainable Systems
- Estimated US Energy Use in 2011 | Visual.ly