Net international investment position
The difference between a country's external financial assets and liabilities is its net international investment position (NIIP).[1] A country's external debt includes both its government debt and private debt, and similarly its public and privately held (by its legal residents) external assets are also taken into account when calculating its NIIP.[2] Note that commodities, as well as currencies tend to follow cyclical patterns, whereby they undergo significant valuation changes, of which is reflected in NIIP.
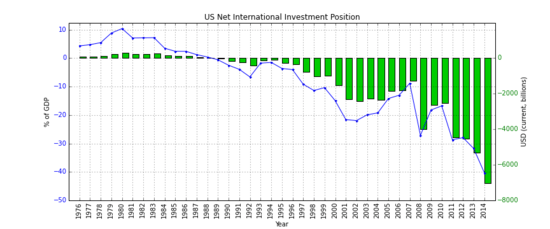
A country's international investment position (IIP) is a financial statement setting out the value and composition of that country's external financial assets and liabilities. A positive NIIP value indicates a nation is a creditor nation, while a negative value indicates it is a debtor nation. The USA, as recently as 1960 the world's largest creditor, has now become the world's largest debtor, and since the 1980s, Japan has replaced USA as the world's largest creditor nation.
List of countries and Regions by net international investment position
| Countries and Regions | Date | GDP | Date | NIIP | Date | NIIP in % GDP |
|---|---|---|---|---|---|---|
| 2014 | 2,253.000 bil. HK$ | 2014 | +1,114.87 bil $ | 2016 | +284.0[3] | |
| 2014 | 390.089 bil. S$[4] | 2014 | +276.09 bil $ | 2014 | +182.0 | |
| 2014 | 3,149.681 bil. kr[5] | 2014 | +592.04 bil $ | 2014 | +170.9 | |
| 2010 | 430.580 bil. $[6] | 2010 | +659.915 bil. $[7] | 2010 | +153.3 | |
| 2014 | 642.256 bil. CHF[8] | 2014 | +777.75 bil. $ | 2014 | +119.6 | |
| 2014 | 2,798.432 bil. sr[9] | 2014 | +795.22 bil. $ | 2014 | +106.6 | |
| 2014 | 490,599.000 bil. ¥[10] | 2014 | +3,439.01 bil $ | 2014 | +74.8 | |
| 2015 | 676.531 bil. €[11] | 2015 | +432.247 bil. €[12] | 2015 | +63.9[13] | |
| 2015 | 410.351 bil. €[11] | 2015 | +250.978 bil. €[12] | 2015 | +61.3[13] | |
| 2015 | 8.784 bil. €[11] | 2015 | +4.264 bil. €[12] | 2015 | +48.5[13] | |
| 2015 | 51.216 bil. €[11] | 2015 | +18.342 bil. €[12] | 2015 | +35.8[13] | |
| 2014 | 1,919.192 bil. kr[14] | 2015 | +774.613 bil. kr[12] | 2015 | +39.0[13] | |
| 2015 | 3,032.820 bil. €[11] | 2015 | +1,476.169 bil. €[12] | 2015 | +48.7[13] | |
| 2014 | 509.964 bil. $[15] | 2014(Q3) | +155.667 bil. $[16] | 2014 | +30.5 | |
| 2014 | 304.226 bil. $[15] | 2014 | +64.700 bil. $[17] | 2014 | +21.3 | |
| 2014 | 10,360.105 bil.$[18] | 2014 | +1,776.400 bil. $[19] | 2014 | +17.1 | |
| 2014 | 1,860.598 bil. $[15] | 2014 | +310.980 bil. $[20] | 2014 | +16.7 | |
| 2015 | 1,376.868 bil. $[21] | 2015 | +198.800 bil. $[22] | 2015 | +14.4 | |
| 2014 | 540.197 bil. $[15] | 2014 | +76.821 bil. $[23] | 2014 | +14.2 | |
| 2014 | 1,991.596 bil. CAD[24] | 2014 | +101.31 bil. $ | 2014 | +6.9 | |
| 2015 | 339.896 bil. €[11] | 2015 | +9.926 bil. €[12] | 2015 | +2.9[13] | |
| 2015 | 209.149 bil. €[11] | 2015 | +1.293 bil. €[12] | 2015 | +0.6[13] | |
| 2014 | 3,914.704 bil. kr[14] | 2014 | -1.47 bil. $ | 2014 | −0.3[13] | |
| 2014 | 568.508 bil. $[15] | 2014 | -60.459 bil. $[25] | 2014 | −10.6 | |
| | 2015 | 10,455.774 bil. €[11] | 2014 | -1,285.600 bil. €[26] | 2014 | −12.7[26] |
| 2014 | 258.062 bil. $[15] | 2014 | -35.651 bil. $[27] | 2014 | −13.8 | |
| 2014 | 284.582 bil. $[15] | 2014 | -40.700 bil. $[28] | 2014 | −14.3 | |
| 2014 | 231.876 bil. $[15] | 2014 | -35.201 bil. $[29] | 2014 | −15.2 | |
| 2014 | 2,066.902 bil. $[15] | 2014 | -353.674 bil. $[30] | 2014 | −17.1 | |
| 2015 | 2,181.064 bil. €[11] | 2015 | -358.093 bil. €[12] | 2015 | −16.4[13] | |
| 2014 | 1,791.934 bil. £[14] | 2015 | -269.183 bil. £[12] | 2015 | −14.4[13] | |
| 2015 | 1,642.444 bil. €[11] | 2015 | -387.147 bil. €[12] | 2015 | −23.6[13] | |
| 2014 | 2,346.118 bil. $[15] | 2014 | -776.537 bil. $[31] | 2014 | −33.1 | |
| 2014 | 1,282.720 bil. $[15] | 2014 | -426.553 bil. $[32] | 2014 | −33.3 | |
| 2014 | 4,260.886 bil. CZK[14] | 2014 | -1,520.244 bil. CZK[12] | 2014 | −35.6[13] | |
| 2014 | 17,703.700 bil. $[33] | 2014 | -7,019.700 bil. $[34] | 2014 | −39.7 | |
| 2015 | 20.251 bil. €[11] | 2015 | -8.283 bil. €[12] | 2015 | −40.9[13] | |
| 2015 | 38.570 bil. €[11] | 2015 | -14.931 bil. €[12] | 2015 | −38.7[13] | |
| 2014 | 36.309 bil. €[11] | 2015 | -16.695 bil. €[12] | 2015 | −44.7[13] | |
| 2014 | 888.538 bil. $[15] | 2014 | -419.770 bil. $[35] | 2014 | −47.2 | |
| 2014 | 799.534 bil. $[15] | 2014 | -437.029 bil. $[36] | 2014 | −54.7 | |
| 2014 | 1,558.586 bil A$[37] | 2014 | -866.700 bil. $A[38] | 2014 | −55.6 | |
| 2014 | 666.637 bil. RON[14] | 2015 | -369.830 bil. RON[12] | 2015 | −51.9[13] | |
| 2015 | 24.349 bil. €[11] | 2015 | -15.219 bil.€[12] | 2015 | −62.5[13] | |
| 2013 | 237.769 bil. NZ$[39] | 2014 | -154.592 bil. NZ$[40] | 2014 | −65.0 | |
| 2014 | 1,728.676 bil. zl[14] | 2015 | -1,123.117 bil. zl[12] | 2015 | −62.8[13] | |
| 2015 | 78.686 bil. €[11] | 2015 | -47.993 bil. €[12] | 2015 | −61.0[13] | |
| 2014 | 82.164 bil. BGN[14] | 2015 | -53.116 bil. BGN[12] | 2015 | −60.0[13] | |
| 2014 | 31,863.969 bil.HUF[14] | 2015 | -20,662.306 bil.HUF[12] | 2015 | −60.8[13] | |
| 2014 | 328.927 bil. HRK[14] | 2015 | -259.398 bil. HRK[12] | 2015 | −77.7[13] | |
| 2015 | 1,075.369 bil. €[11] | 2015 | -967.416 bil. €[12] | 2015 | −89.9[13] | |
| 2015 | 255.815 bil. €[11] | 2015 | -532.089 bil. €[12] | 2015 | −208.0[13] | |
| 2015 | 179.540 bil. €[11] | 2015 | -196.325 bil. €[12] | 2015 | −109.3[13] | |
| 2015 | 175.697 bil. €[11] | 2015 | -236.392 bil. €[12] | 2015 | −134.6[13] | |
| 2015 | 17.637 bil. €[11] | 2015 | -22.985 bil. €[12] | 2015 | −130.3[13] | |
| 2014 | 1,993.336 bil. kr[41] | 2014 | -7,936.987 bil. kr[42] | 2014 | −398.2[43] | |
Net International Investment Position in absolute terms; OECD Countries, 2013
| Country | NIIP 2013 (Million USD)[44] |
|---|---|
| | -743,491.296 |
| | -801.215 |
| | 225,394.507 |
| | 21,369.646 |
| | -39,232.601 |
| | -83,668.991 |
| | 134,386.857 |
| | -12,172.412 |
| | 40,386.115 |
| | -433,000.527 |
| | 1,660,000.721 |
| | -303,565.639 |
| | -116,826.028 |
| | -65,738.588 |
| | -238,602.533 |
| | 62,603.906 |
| | -643,874.027 |
| | 3,086,000.434 |
| | -37,239.813 |
| | 134,864.862 |
| | -499,229.861 |
| | 377,108.478 |
| | -119,321.523 |
| | 644,904.335 |
| | -375,092.140 |
| | -272,246.862 |
| | -65,279.296 |
| | -19,038.284 |
| | -1,389,621.918 |
| | -107,907.116 |
| | 839,137.307 |
| | -394,232.765 |
| | -68,000.013 |
| | -5,382,000.997 |
See also
- Net foreign assets
- List of countries by external debt
- List of countries by public debt
- List of countries by net international investment position per capita
References
- ↑ Bivens, L. Josh (December 14, 2004). "Debt and the dollar: The United States damages future living standards by borrowing itself into a deceptively deep hole". Epinet.org. Retrieved 2009-06-28.
- ↑ Ministry of Economic and Finance of Argentina International Investment Position Methodology page.1
- ↑ Census and Statistics Department Hongkong International Investment Position at Year-End 2014
- ↑ Singapore Statistical Office Singapore, GDP 2014 at current prices, in national currency
- ↑ Statistics Norway GDP National Accounts, current
- ↑ IMF World Economic Outlook Database, April 2011 Taiwan Province of China, GDP 2010 at current prices, in US$
- ↑ Central Bank of the Republic of China International Investment Position (End-Period-Stocks) page. 1
- ↑ BFS Gross Domestic Product (GDP) - Data, indicators, March 2015 Switzerland, GDP 2014 at current prices, in national currency
- ↑ Saudi Arabian Monetary Agency National Accounts, current GDP in Riyal
- ↑ Bank of Japan Japan, GDP at current prices, in national currency, p. 41
- 1 2 3 4 5 6 7 8 9 10 11 12 13 14 15 16 17 18 19 20 Eurostat GDP at market prices
- 1 2 3 4 5 6 7 8 9 10 11 12 13 14 15 16 17 18 19 20 21 22 23 24 25 26 27 "Net international investment position in national currency units - annual data; code: tipsii10". Eurostat. Retrieved August 27, 2015.
- 1 2 3 4 5 6 7 8 9 10 11 12 13 14 15 16 17 18 19 20 21 22 23 24 25 26 27 28 "Net international investment position in % of GDP - annual data; code: tipsii10". Eurostat. Retrieved August 27, 2015.
- 1 2 3 4 5 6 7 8 9 Eurostat GDP in national currency UK, GDP 2014 at current prices
- 1 2 3 4 5 6 7 8 9 10 11 12 13 World Bank World Development Indicators
- ↑ Banco de Venezuela [www.bcv.org.ve/Upload/Comunicados/aviso301214.pdf Resultados de la Economía durante el año 2014 ]
- ↑ Bank of Israel International Investment Position (IIP) – End of 2014
- ↑ World Bank World Development Indicators: Figures exclude Taiwan, and special administrative regions of Hong Kong and Macau.
- ↑ State Administration of Foreign Exchange, China The time-series data of International Investment Position of China
- ↑ Central Bank of Russia
- ↑ IMF World Economic Outlook Database, April 2016
- ↑ Bank of Korea(BOK) International Investment Position (IIP) at the end of 2015 (preliminary).pdf
- ↑ Instituto Nacional de Estadistica y Censos Posición de Inversión International Argentina
- ↑ http://www.statcan.gc.ca/tables-tableaux/sum-som/l01/cst01/dsbbcan-eng.htm: "Canada's Gross Domestic Product, 2014, current prices"]
- ↑ Central Bank of Nigeria 2014 Statictical bulletin - External Sector Statistics (table D 2.2.2)
- 1 2 European Central Bank International investment position of the euro area
- ↑ Banco Central de Chile Statistics Database External Sector -> IIP by institutional sector
- ↑ Philstar International Investment Position
- ↑ The National Bank of Kazakhstan accessed: August 27.2015
- ↑ Reserve Bank of India International Investment Position: External Assets and Liabilities at the End of 2014
- ↑ Banco Central do Brasil Historical Series of the International Investment Position
- ↑ National Banco de México International Investment Position Final Position 2014
- ↑ Department of Commerce – Bureau of Economic Analysis US, GDP at current prices, in US$
- ↑ Department of Commerce – Bureau of Economic Analysis U.S. Net International Investment Position at Yearend 2014
- ↑ Indonesia's International Investment Position
- ↑ Central Bank of the Republic of Turkey International Investment Position Turkey
- ↑ Australian Bureau of Statistics - Key Economic Indicators, Table 36
- ↑ Australian Bureau of Statistics - Balance of Payments and International Investment Position, Australia
- ↑ Reserve Bank of New Zealand Economic Indivators GDP at current prices Q1-Q42014, in national currency
- ↑ Reserve Bank of New Zealand Balance Of Payments and International Investment Position: Q4 2014 Net IIP at 31 December 2014
- ↑ Statisics Iceland
- ↑ Central Bank of Iceland
- ↑ Central Bank of Iceland As of Q1 2015 Excluding the financial institutions undergoing winding-up proceedings, assets totalled 4,042 b.kr. and liabilities 4,031 b.kr., yielding a positive net balance of 12 b.kr. Net liabilities declined by 122 b.kr. between quarters.
- ↑ "IMF Balance of Payments Statistics". Retrieved April 12, 2015.
External links
- Bureau of Economic Analysis Elena L. Nguyen: The International Investment Position of the United States at Yearend 2007. U.S.
- Bank of Japan Japan’s International Investment Position at Year-End 2009 (Retrieved on June 30, 2011)
- Deutsche Bundesbank (German Central Bank) International Investment Position - External Debt Statistics
- European Economic Forecast Spring 2010 European Commission working draft Graph 1.3.2., International investment position since 1980 in major economic units.
Statistics
- International Monetary Fund (IMF) International Investment Position (IIP) Data
- International Monetary Fund (IMF) World Economic Outlook Database, April 2011
- UK National Statistics Great Britain: International Investment Position, Table K
- Saint-Petersburg (Russia) statistic Economic statistics of St. Petersburg