Northern Cambria School District
Coordinates: 40°39′21″N 78°46′46″W / 40.655813°N 78.779472°W
| Northern Cambria School District | |
|---|---|
 | |
| Address | |
|
601 Joseph Street Northern Cambria,, Pennsylvania, Cambria County 15714 United States of America | |
| Information | |
| Type | Public |
| School board | 9 locally elected members |
| Superintendent |
Joseph Kimmel, M'ed (contract August 11, 2014 to August 11, 2017)[1][2] Salary $110,000[3] |
| Administrator |
Faith Riling, Interim Director of Finance |
| Principal | Rebecca Pupo, HS |
| Principal | Thomas A. Rocco, ES & MS |
| Staff | 82 non teaching staff members |
| Faculty | 80.25[6] |
| Grades | Preschool - 12th |
| Age | 4 years old to 21 years old special education |
| Pupils |
1,155 pupils (2014),[7] |
| • Pre-kindergarten | 21 (2013) |
| • Kindergarten | 70 (2013), 108 (2010) |
| • Grade 1 | 84 (2013), 97 |
| • Grade 2 | 76 (2013), 85 |
| • Grade 3 | 97 (2013), 89 |
| • Grade 4 | 84 (2013), 81 |
| • Grade 5 | 86 (2013), 84 |
| • Grade 6 | 73 (2013), 93 |
| • Grade 7 | 81 (2013), 85 |
| • Grade 8 | 93 (2013), 92 |
| • Grade 9 | 81 (2013), 105 |
| • Grade 10 | 89 (2013), 91 |
| • Grade 11 | 95 (2013), 90 |
| • Grade 12 | 109 (2013), 97 (2010) |
| • Other | Enrollment projected to be 1,144 in 2020[11] |
| Language | English |
| Color(s) | gold and black |
| Budget |
$16,761,533 (2015–16)[12] |
| per pupil spending | $11,562 (2008) |
| per pupils spending | $13,030.59 (2013)[15] |
| Website | http://www.ncsd.k12.pa.us |
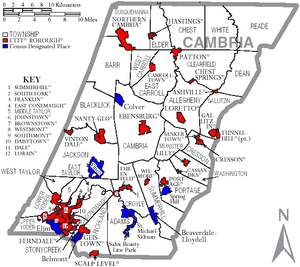
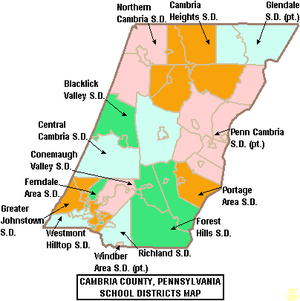
The Northern Cambria School District is a small, rural, public school district located in northwestern Cambria County in Pennsylvania. The District encompasses: the borough of Northern Cambria along with Barr and Susquehanna Township. The geographic area is just 62 square miles (160 km2). According to 2000 federal census data, it serves a resident population of 8,342. By 2010, the federal census data found the District resident population had declined to 7,898 people.[16] The educational attainment levels for the Northern Cambria School District population (25 years old and over) were 85.7% high school graduates and 16.2% college graduates.[17] The District is one of the 500 public school districts of Pennsylvania.
According to the Pennsylvania Budget and Policy Center, 41.9% of the District’s pupils lived at 185% or below the Federal Poverty Level as shown by their eligibility for the federal free or reduced price school meal programs in 2012.[18] In 2009, the district residents’ per capita income was $13,144, while the median family income was $32,989.[19] In the Commonwealth, the median family income was $49,501 [20] and the United States median family income was $49,445, in 2010.[21] In Cambria County, the median household income was $39,574.[22] By 2013, the median household income in the United States rose to $52,100.[23]
According to District officials, Northern Cambria School District provided basic educational services to 1,183 pupils in 2011. It employed: 89 teachers, 69 full-time and part-time support personnel, and eight (8) administrators during the 2011-12 school year. The District received $11,627,480 in state funding for the 2011-12 school year. In school year 2007-08, NCSD provided basic educational services to 1,238 pupils. It employed: 97 teachers, 74 full-time and part-time support personnel, and 9 administrators. Northern Cambria School District received more than $10.9 million in state funding in school year 2007-08.
Northern Cambria School District operates: Northern Cambria High School and Northern Cambria Elementary/Middle School. Students in grades K-8 attend the elementary/middle school while students in grades 9-12 attend the high school. High school students may choose to attend Admiral Peary Area Vocational Technical School for training in the construction and mechanical trades. The Appalachia Intermediate Unit IU8 provides the District with a wide variety of services like specialized education for disabled students and hearing, background checks for employees, state mandated recognizing and reporting child abuse training, speech and visual disability services and professional development for staff and faculty.
Governance
The Northern Cambria School District is governed by 9 individually elected board members (serve without compensation for a term of four years), the Pennsylvania State Board of Education, the Pennsylvania Department of Education and the Pennsylvania General Assembly.[24] The federal government controls programs it funds like: Title I funding for low income children in the Elementary and Secondary Education Act and the No Child Left Behind Act, which mandates the district focus resources on student success in acquiring reading and math skills. The Superintendent and Business Manager are appointed by the school board. The Superintendent is the chief administrative officer with overall responsibility for all aspects of operations, including education and finance. The Business Manager is responsible for budget and financial operations. Neither of these officials are voting members of the School Board. The School Board enters into individual employment contracts for these positions. In Pennsylvania, public school districts are required to give 150 days notice to the Superintendent regarding renewal of the employment contract.[25]
Academic achievement
In 2015, Northern Cambria School District ranked 378th out of 493 Pennsylvania public school districts, by the Pittsburgh Business Times.[26] The ranking is based on the last 3 years of student academic achievement as demonstrated by PSSAs results in: reading, writing, math and science and the three Keystone Exams (literature, Algebra 1, Biology I) in high school.[27] Three school districts were excluded because they do not operate high schools (Saint Clair Area School District, Midland Borough School District, Duquesne City School District). The PSSAs are given to all children in grades 3rd through 8th. Adapted PSSA examinations are given to children in the special education programs. Writing exams were given to children in 5th and 8th grades.
- 2014 - 368th[28]
- 2013 - 368th[29]
- 2012 - 284th [30]
- 2008 - 228th
- 2007 - 284th out of 501 school districts.[31]
District AYP status history
In 2012, Northern Cambria School District achieved Adequate Yearly Progress (AYP) status.[32] In 2011, Northern Cambria School District also achieved Adequate Yearly Progress (AYP). In 2011, 94 percent of the 500 Pennsylvania public school districts achieved the No Child Left Behind Act progress level of 72% of students reading on grade level and 67% of students demonstrating on grade level math. In 2011, 46.9 percent of Pennsylvania school districts achieved Adequate Yearly Progress (AYP) based on student performance. An additional 37.8 percent of Pennsylvania public school districts made AYP based on a calculated method called safe harbor, 8.2 percent on the growth model and 0.8 percent on a two-year average performance.[33][34] Northern Cambria School District achieved AYP status each year from 2003 to 2010.[35]
Graduation rate
In 2014, Northern Cambria School District’s graduation rate was 80.58%.[36]
- 2013 - 83.84%[37]
- 2012 - 84.9%[38]
- 2011 - 82%[39]
- 2010 - 84.9%, the Pennsylvania Department of Education issued a new, 4-year cohort graduation rate.[40]
- According to traditional graduation rate calculations
Northern Cambria High School
The high school is located at 813 35th Street, Northern Cambria. In 2014, enrollment was reported as 386 pupils in 9th through 12th grades, with 44% of pupils eligible for a free lunch due to family poverty. Additionally, 11% of pupils received special education services, while none of pupils were identified as gifted.[44] The school employed 35 teachers. Per the PA Department of Education, 5% of the teachers were rated "Non‐Highly Qualified" under the federal No Child Left Behind Act. The current high school building is the John F. Kennedy building, which opened in 1963 when the students from the former Barnesboro and Spangler High Schools were first housed at the same location.
According to the National Center for Education Statistics, in 2012, the school reported an enrollment of 379 pupils in grades 9th through 12th, with 152 pupils eligible for a federal free or reduced price lunch due to the family meeting the federal poverty level. In 2012, the School employed 26.9 teachers yielding a student-teacher ratio of 13:1.[45] According to a report by the Pennsylvania Department of Education, 1 teacher was rated "Non‐Highly Qualified" under No Child Left Behind.[46] The School is a federally designated Title I school. Dennis Colbert retired as Principal of the school in 2010.[47]
- 2014 School Performance Profile
Northern Cambria High School achieved 76.7 out of 100. Reflects on grade level reading, mathematics and science achievement. In reading/literature - 70% were on grade level. In Algebra 1, 66% showed on grade level skills. In Biology, 65% demonstrated on grade level science understanding at the end of the course.[48][49] Statewide, the percentage of high school students who scored proficient and advanced in Algebra I increased to 39.7% to 40.1%. The percentage of high school students who scored proficient and advanced in reading/literature declined to 52.5%. The percentage of high school students who scored proficient and advanced in biology improved from 39.7% to 41.4%.[50]
According to the Pennsylvania Department of Education, 2,134 of 2,947 Pennsylvania public schools (72 percent of Pennsylvania public schools), achieved an academic score of 70 or higher.[51] Fifty-three percent of schools statewide received lower SPP scores compared with last year's, while 46 percent improved. A handful were unchanged.[52][53]
- 2013 School Performance Profile
Northern Cambria High School achieved 72.6 out of 100. Reflects on grade level reading, mathematics and science achievement.[54] The actual test performance data was withheld by the PDE.[55] According to the Pennsylvania Department of Education, 2,181 public schools (less than 73 percent of Pennsylvania public schools), achieved an academic score of 70 or higher. Pennsylvania 11th grade students no longer take the PSSAs. Instead, beginning in 2012, they take the Keystone Exams at the end of the associated course.[56]
- AYP History
In 2012, Northern Cambria High School declined to Warning Adequate Yearly Progress (AYP) status, due to missing all metric measured.[57] In 2011, Northern Cambria High School achieved AYP status.[58] Effective with Spring 2013, the Pennsylvania Department of Education discontinued administering the PSSA's to 11th graders. From 2003 to 2010, Northern Cambria High School achieved AYP status each school year.
- PSSA results
Pennsylvania System of School Assessments, commonly called PSSAs are No Child Left Behind Act related examinations which were administered from 2003 through 2012, in all Pennsylvania public high schools. The exams were administered in the Spring of each school year. The goal was for 100% of students to be on grade level or better in reading and mathematics, by the Spring of 2014. The tests focused on the state's Academic Standards for reading, writing, mathematics and science. The Science exam included content in science, technology, ecology and the environmental studies. The mathematics exam included: algebra I, algebra II, geometry and trigonometry. The standards were first published in 1998 and were mandated by the Pennsylvania State Board of Education.[59] In 2013, the Commonwealth of Pennsylvania changed its high school assessments to the Keystone Exams in Algebra 1, Reading/literature and Biology1. The exams are given at the end of the course, rather than all in the spring of the student's 11th grade year.[60]
11th Grade Reading:
- 2012 - 66% on grade level, (15% below basic). State - 67% of 11th graders are on grade level.[61]
- 2011 - 67% (20% below basic). State - 69.1%[62]
- 2010 - 74% (13% below basic). State - 66%[63]
- 2009 - 72% (14% below basic). State - 65%[64]
- 2008 - 60% (21% below basic). State - 65%[65]
- 2007 - 63% (13% below basic). State - 65%[66]
11th Grade Math:
- 2012 - 54% on grade level (25% below basic). In Pennsylvania, 59% of 11th graders are on grade level.[67]
- 2011 - 59% (21% below basic). State - 60.3%[68]
- 2010 - 61% (24% below basic). State - 59%[69]
- 2009 - 62% (24% below basic). State - 56%[70]
- 2008 - 39% (36% below basic). State - 56%[71]
- 2007 - 52% (28% below basic). State - 53%[72]
11th Grade Science:
- 2012 - 28% on grade level (9% below basic). State - 42% of 11th graders were on grade level.[73]
- 2011 - 34% (15% below basic). State - 40%[74]
- 2010 - 47.7% (8% below basic). State - 39%
- 2009 - 47% (15% below basic). State - 40%[75]
- 2008 - 17% (26% below basic). State - 39%[76]
- 2007 - students field tested. Results withheld from the public by PDE.
College Remediation Rate
According to a Pennsylvania Department of Education study released in January 2009, 8% of the Northern Cambria High School graduates required remediation in mathematics and or reading before they were prepared to take college level courses in the Pennsylvania State System of Higher Education or community colleges.[77][78] Less than 66% of Pennsylvania high school graduates, who enroll in a four-year college in Pennsylvania, will earn a bachelor's degree within six years. Among Pennsylvania high school graduates pursuing an associate degree, only one in three graduate in three years.[79][80] Per the Pennsylvania Department of Education, one in three recent high school graduates who attend Pennsylvania's public universities and community colleges takes at least one remedial course in math, reading or English.
Dual enrollment
The Northern Cambria High School offers a dual enrollment program in 2014. This state program permits high school students to take courses, at local higher education institutions, to earn college credits. Students remain enrolled at their high school. The courses count towards high school graduation requirements and towards earning a college degree. The students continue to have full access to activities and programs at their high school. The college credits are offered at a deeply discounted rate. Three colleges are available: Mount Aloysius College, Penn Highlands Community College and Saint Francis University. The state offered a small grant to assist students in costs for tuition, fees and books.[81] Under the Pennsylvania Transfer and Articulation Agreement, many Pennsylvania colleges and universities accept these credits for students who transfer to their institutions.[82] Under state rules, other students that reside in the district, who attend a private school, a charter school or are home schooled are eligible to participate in this program.[83] In 2010, Governor Edward Rendell eliminated the grants to students, from the Commonwealth, due to a state budget crisis.
Graduation requirements
Among Pennsylvania's 500 public school districts, graduation requirements widely vary. The Northern Cambria School Board has determined that a pupil must earn 22 credits to graduate, including: a required class every year in math 4 credits, English 4 credits social studies 3.5 credits, science 3.5 credits, Physical Education 2 credits, health .5 credits, Computers 2 credits, arts humanities 5.5 credits and electives.[84] Students in the class of 2019 are required to pass a total of 24.5 credits.
For nearly two decades, all Pennsylvania secondary school students were required to complete a project as a part of their eligibility to graduate from high school. The type of project, its rigor and its expectations are set by the individual school district.[85] Effective with the graduating class of 2017, the Pennsylvania State Board of Education eliminated the state mandate that students complete a culminating project in order to graduate.[86]
By Pennsylvania State School Board regulations, beginning with the class of 2017, public school students must demonstrate successful completion of secondary level course work in Algebra I, Biology, and English Literature by passing the respective Keystone Exams for each course.[87] The exam is given at the end of the course. Keystone Exams replace the PSSAs for 11th grade.[88]
Students have several opportunities to pass the exam. Schools are mandated to provide targeted assistance to help the student be successful. Those who do not pass after several attempts can perform a project in order to graduate.[89][90] For the class of 2019, a Composition exam will be added. For the class of 2020, passing a civics and government exam will be added to the graduation requirements.[91] In 2011, Pennsylvania high school students field tested the Algebra 1, Biology and English Lit exams. The statewide results were: Algebra 1 38% on grade level, Biology 35% on grade level and English Lit - 49% on grade level.[92] Individual student, school or district reports were not made public, although they were reported to district officials by the Pennsylvania Department of Education. Students identified as having special needs and qualifying for an Individual Educational Program (IEP) may graduate by meeting the requirements of their IEP.
SAT scores
In 2014, 71 Northern Cambria School District students took the SAT exams. The District's Verbal Average Score was 457. The Math average score was 475. The Writing average score was 440.[93][94] Statewide in Pennsylvania, Verbal Average Score was 497. The Math average score was 504. The Writing average score was 480. The College Board also reported that nationwide scores were: 497 in reading, 513 in math and 487 in writing.[95] In 2014, 1,672,395 students took the SATs in the United States.
In 2013, 53 Northern Cambria School District students took the SAT exams. The District's Verbal Average Score was 430. The Math average score was 470. The Writing average score was 435. The College Board reported that statewide scores were: 494 in reading, 504 in math and 482 in writing. The nationwide SAT results were the same as in 2012.[96]
In 2012, 48 Northern Cambria School District students took the SAT exams. The District's Verbal Average Score was 449. The Math average score was 492. The Writing average score was 459. The statewide Verbal SAT exams results were: Verbal 491, Math 501, Writing 480. In the USA, 1.65 million students took the exams achieving scores: Verbal 496, Math 514, Writing 488. According to the College Board the maximum score on each section was 800, and 360 students nationwide scored a perfect 2,400.
In 2011, 67 Northern Cambria School District students took the SAT exams. The District's Verbal Average Score was 461. The Math average score was 467. The Writing average score was 439.[97] Pennsylvania ranked 40th among states with SAT scores: Verbal - 493, Math - 501, Writing - 479.[98] In the United States, 1.65 million students took the exam in 2011. They averaged 497 (out of 800) verbal, 514 math and 489 in writing.[99]
The Center for Rural Pennsylvania, a research arm of the Pennsylvania General Assembly, compared the SAT data of students in rural areas of Pennsylvania to students in urban areas. From 2003 to 2005, the average total SAT score for students in rural Pennsylvania was 992, while urban students averaged 1,006. During the same period, 28 percent of 11th and 12th graders in rural school districts took the exam, compared to 32 percent of urban students in the same grades. The average math and verbal scores were 495 and 497, respectively, for rural students, while urban test-takers averaged 499 and 507, respectively. Pennsylvania’s SAT composite score ranked low on the national scale in 2004. The composite SAT score of 1,003 left Pennsylvania ranking 44 out of the 50 states and Washington, DC.[100]
AP Courses
In 2014, Northern Cambria High School offered 1 Advanced Placement (AP) course at a higher cost than regular courses. The fee for each AP Exam is $91 (2014).[101] The school normally retains $9 of that fee as a rebate to help with administrative costs. In 2012, the fee was $89 per test per pupil. Students have the option of taking College Board approved courses and then taking the College Board's examination in the Spring. Students, who achieve a 3 or better on the exam, may be awarded college credits at US universities and colleges. Each higher education institution sets its own standards about what level of credits are awarded to a student based on their AP exam score. Most higher education give credits for scores of 4 or 5. Some schools also give credits for scores of 3. High schools give credits towards graduation to students who take the school's AP class. At Northern Cambria School District the AP courses are weighted at 1.06 credits.[102] At Northern Cambria High School none of the students who took an AP course earned a 3 or better on the exam.[103]
Northern Cambria Elementary/Middle School
Northern Cambria Elementary/Middle School is located at 601 Joseph Street, Northern Cambria. The middle school and elementary school were consolidated in one newly renovated building in 2008. The renovation cost $13.5 million.[104] The building has two gymnasiums as one was added in 2007. It also has a swimming pool and an auditorium. Graduation ceremonies for high school graduates are held at the middle school auditorium. While housed in a single building, academic and demographic data are still reported as unique school.
Middle school
In 2014, enrollment in the Northern Cambria Middle School was 324 pupils, in grades 5th through 8th, with 43% of pupils eligible for a free lunch due to family poverty. Additionally, 29.9% of pupils received special education services, while none of pupils were identified as gifted.[105] According to a 2014 report by the Pennsylvania Department of Education, 69% of its teachers were rated "Highly Qualified" under No Child Left Behind.[106]
According to the National Center for Education Statistics, in 2012, Northern Cambria Middle School reported an enrollment of 336 pupils, in grades 6th through 8th, with 151 pupils receiving a federal free or reduced price lunch due to family poverty. The school employed 17.5 teachers yielding a student-teacher ratio of 19:1.[107] Prior to 2012, the 5th grade was assigned to the elementary school.
- 2014 School Performance Profile
Northern Cambria Middle School achieved 77.2 out of 100. Reflects on grade level reading, mathematics and science achievement. In reading/literature - just 62% of students were on grade level. In Algebra 1/Math, 67% students showed on grade level mathematics skills. In Science, 60% of 8th graders demonstrated on grade level science understanding. In writing, 65% of the 5th and 8th grade students demonstrated on grade level writing skills.[108]
- 2013 School Performance Profile
Northern Cambria Middle School achieved 79.2 out of 100. Reflects on grade level reading, writing, mathematics and science achievement. In reading, just 60.6% of the students were on grade level. In Mathematics/Algebra 1, 66% of the students showed on grade level skills. In Science, only 58% of the 8th graders demonstrated on grade level science understanding. In writing, 61% of the 5th and 8th grade students demonstrated on grade level writing skills.[109]
- AYP History
In 2011 and 2012, Northern Cambria Middle School achieved AYP status.[110]
- 2010 - achieved AYP status[111]
- 2009 - Making Progress School Improvement Level I AYP status due to lagging student achievement[112]
- 2008 - declined to School Improvement Level I AYP due to chronic low student achievement[113] Under the federal No Child Left Behind Act, the school administration was required to notify parents of the school's poor achievement outcomes. Additionally the middle school administration was required by the Pennsylvania Department of Education, to develop a School Improvement Plan to address the school's low student achievement. Under the Pennsylvania Accountability System, the school district must pay for additional tutoring for struggling students.[114]
- 2007 - declined to Warning AYP status due to lagging student achievement[115]
- 2003 - 2006 - achieved AYP status
- PSSA Results
PSSA's are subject specific examinations given in the Spring of each school year. Fifth graders are tested in: reading, writing and mathematics since 1995. Sixth and seventh grades have been tested in reading and mathematics since 2006. Eighth graders are tested in: reading, writing, mathematics and Science. Beginning in the Spring of 2013, eighth graders, who are enrolled in Algebra I take the Keystone Exam for Algebra I at the end of the course. The testing of 8th grade in reading and mathematics began in 1995, as a state initiative.[116] Testing in science began in 2007. The goal is for 100% of students to be on grade level or better in reading and mathematics, by the Spring of 2014. The tests focus on the state's Academic Standards for reading, writing, mathematics and science.[117] The standards were published in 1998 and are mandated by the Pennsylvania State Board of Education.[118] In 2014, the Commonwealth of Pennsylvania adopted the Pennsylvania Core Standards - Mathematics.[119]
|
8th Grade Reading:
|
8th Grade Math: |
8th Grade Science:
- 2012 - 59% on grade level (22% below basic). State - 59%[126]
- 2011 - 68% (16% below basic). State - 58.3%
- 2010 - 68% (13% below basic). State - 57%[127]
- 2009 - 68% (16% below basic). State - 55%[128]
- 2008 - 50%, (29% below basic). State - 52%[129]
- 2007 - tested, but results not made public.
|
7th Grade Reading: |
7th Grade Math:
|
|
6th Grade Reading:
|
6th Grade Math:
|
|
|
- Dropout Early Warning System
In 2013, Northern Cambria School District did not implement dropout prevention Early Warning System and Interventions Catalog at the middle school.[135] The process identifies students at risk for droping out by examining the pupil’s: attendance, behavior and course grades. Interventions are implemented to assist at-risk pupils to remain in school. The program is funded by federal and private dollars.[136]
Elementary school
Northern Cambria Elementary School reported an enrollment of 445 pupils in grades preschool through 4th, with 48% of pupils receiving a federal free or reduced price meals due to family poverty in 2014. Additionally, none of the pupils receive special education services, while less than 1% are identified as gifted.[137] According to a report by the Pennsylvania Department of Education, 31% of the teachers were rated highly qualified under No Child Left Behind. The school provides full day kindergarten and half day preschool.[138] The school is a federally designated Title I school.
According to the National Center for Education Statistics, in 2012 Northern Cambria Elementary School enrollment was 474 pupils in grades kindergarten through 4th, with 224 pupils receiving a free or reduced price lunch. The School employed 39 teachers yielding a student-teacher ratio of 13:1.[139] The school provided full day kindergarten to all its pupils since 2004.[140]
- 2014 School Performance Profile
Northern Cambria Elementary School SPP score declined to 69.6 out of 100. The score reflects on grade level: reading, science, writing and mathematics achievement. In 2013-14, only 70% of the students were reading on grade level in grades 3rd and 4th. In 3rd grade, 69% of the pupils were reading on grade level. In math, 72% were on grade level (3rd-4th grades). In 4th grade science, 82% of the pupils demonstrated on grade level understanding.[141]
- 2013 School Performance Profile
Northern Cambria Elementary School achieved a score of 78.7 out of 100. The score reflects on grade level: reading, science, writing and mathematics achievement. In 2012-13, only 74% of the students were reading on grade level in grades 3rd and 4th. In 3rd grade, 78% of the pupils were reading on grade level. In math, 77% were on grade level (3rd-4th grades). In 4th grade science, 88% of the pupils demonstrated on grade level understanding.[142]
- AYP status history
In 2012, Northern Cambria Elementary School declined to Warning AYP status due to low student achievement in reading.[143] In 2011, Northern Cambria Elementary School achieved AYP status.[144] From 2004-2010, Northern Cambria Elementary School achieved AYP status each school year.
- PSSA History
Each year, in the Spring, the 3rd graders take the PSSAs in math and reading. The fourth grade is tested in reading, math and science. PSSAs examinations have been administered beginning 2003 to all Pennsylvania public school students in grades 3rd-8th.[145] The goal was for 100% of students to be on grade level or better in reading and mathematics, by the Spring of 2014.[146][147][148] The tests focused on the state's Academic Standards for reading, writing, mathematics and science. The Science exam is given to 4th grades and includes content in science, technology, ecology and the environmental studies.[149]
|
|
- 4th Grade Science
- 2012 - 77%, (4% below basic). State - 82%
- 2011 - 92%, (0% below basic). State - 82.9%
- 2010 - 91%, (0% below basic). State - 81%
- 2009 - 90%, (2% below basic). State - 83%
- 2008 - 77%, (3% below basic). State - 81%
|
|
Enrollment
According to Pennsylvania Department of Education enrollment reports, there are 1,155 students enrolled in preschool-12th in the 2014-15 school year at Northern Cambria School District. In 2007 there were 1,273 pupils. There were 88 students in the Class of 2009. The District's class of 2010 had 97 students. Enrollment at Northern Cambria School District is projected to decline to 1,144 students by 2020.[157] In 2008, the district administrative costs were $631.64 per pupil. The lowest administrative cost per pupil in Pennsylvania was $398 per pupil.[158] A study of Pennsylvania public school spending, conducted by Standard and Poor's, examined the consolidation of small public school districts in Pennsylvania in 2007. The study found that consolidation of the administration of Northern Cambria School District with an adjacent school district, would achieve substantial administrative cost savings which varied by district.[159] The study examined consolidation of administrations with five neighboring school districts. Consolidation with Blacklick Valley School District was predicted to save $2 million in 2007. Consolidation with Cambria Heights School District would save taxpayers over $4 million in redundant administration costs. Similarly, consolidation with Harmony Area School District would save taxpayers over $2 million. consolidation with Penns Manor Area School District would save taxpayers over $2.6 million. Finally, consolidation of administrations with Purchase Line School District projected taxpayer savings of over $4 million.
According to a 2009 school district administration consolidation proposal by Governor Edward Rendell, the excessive administrative overhead dollars could be redirected to improve lagging academic achievement, to enrich the academic programs or to reduce property taxes.[160] Consolidation of two central administrations into one would not require the closing of any school buildings. The Governor's proposal called for the savings to be redirected to improving lagging reading and science achievement, to enriching the academic programs or to reducing residents' property taxes.[161] In March 2011, the Pennsylvania Institute of Certified Public Accountants Fiscal Responsibility Task Force released a report which found that consolidating school district administrations with one neighboring district would save the Commonwealth $1.2 billion without forcing the consolidation of any school buildings.[162]
From 2000 through 2010, rural Pennsylvania public school district enrollment decreased by 8 percent.[163] In 2010, there were 726,417 children in rural Pennsylvania, or 21 percent of the total rural population. From 2000 to 2010, the number of children in rural counties decreased 7 percent. The decline in the number of children impacted most rural counties with 42 of Pennsylvania’s 48 rural counties experiencing a decline. Cameron County, Elk County and Sullivan County experienced the greatest declines, with a decrease of more than 21 percent in all three counties. Cambria County's live birth rate was 1,897 births in 1990. Cambria County's live birth rate in 2000 was 1,569 births, while in 2011 the birth rate had continued to decline to 1,374 babies.[164] Over the past 50 years (1960 to 2010), rural Pennsylvania saw a steady decline in both the number and proportion of residents under 18 years old. In 1960, 1.06 million rural residents, or 35 percent of the rural population, were children.
Pennsylvania’s birth rate has been declining for two decades. According to data from the Pennsylvania Department of Health, in 1990, the Commonwealth of Pennsylvania’s birth rate was 171,053.[165] In 2000, Pennsylvania’s birth rate was 145,874.[166] Finally in 2011, the State’s birth rate declined further to 142,021.[167] From 2000 to 2009, the number of babies born in rural counties declined 5 percent.[168] Urban counties have also experienced a decline in the number of school aged children. From 2000-2010 urban Pennsylvania counties had a 3 percent decline in the number of residents under 18 years old. In 2010, there were 2.07 million residents, or 22 percent of the urban population, who were under age 18.[169]
Pennsylvania had 2,361 public school districts in 1959. The state compelled mergers reducing the number to 505 by 1980. Mergers slowed through the 1980s after a 1981 court order desegregated and combined the Edgewood, General Braddock, Swissvale, Churchill and Turtle Creek districts into the Woodland Hills district.[170] The Commonwealth of Pennsylvania has one of the highest numbers of school districts in the nation. In Pennsylvania, 80% of the school districts serve student populations under 5,000, and 40% serve less than 2,000. This results in excessive school administration bureaucracy and not enough course diversity.[171] In a survey of 88 superintendents of small districts, 42% of the respondents stated that they thought consolidation would save money without closing any school buildings.[172]
Special education
In December 2013, the District administration reported that 159 pupils or 13.9% of the district's pupils received Special Education services, with 47.8% of the identified students having a specific learning disability.[173] In December 2009, the District administration reported that 182 pupils or 14.7% of the District's pupils received Special Education services, with 57% of the identified students having a specific learning disability. Special education services in the Commonwealth are provided to students from ages three years to 21 years old. In the 2010-2011 school year, the total student enrollment was more than 1.78 million students with approximately 275,000 students eligible for special education services. Among these students 18,959 were identified with mental retardation and 21,245 students with autism.[174] The largest group of students are identified as Specific Learning Disabilities 126,026 students (46.9 percent) and Speech or Language Impairments with 43,542 students (16.2 percent).
In 2007, Pennsylvania Secretary of Education Gerald Zahorchak testified before the Pennsylvania House Education Committee regarding full day kindergarten. He claimed that districts which offered the program would see a significant decrease in special education students due to early identification and early intervention. He asserted the high cost of full day kindergarten would be recouped by Districts in lower special education costs.[175] While Northern Cambria School District has seen decrease in the percentage of special education students it serves, it has yielded no savings.
In order to comply with state and federal Individuals with Disabilities Education Act rules and regulations, the school district engages in identification procedures to ensure that eligible students receive an appropriate educational program consisting of special education and related services, individualized to meet student needs. At no cost to the parents, these services are provided in compliance with state and federal law; and are reasonably calculated to yield meaningful educational benefit and student progress.[176] To identify students who may be eligible for special education services, various screening activities are conducted on an ongoing basis. These screening activities include: review of group-based data (cumulative records, enrollment records, health records, report cards, ability and achievement test scores); hearing, vision, motor, and speech/language screening; and review by the Special Education administration. When screening results suggest that the student may be eligible, the District seeks parental consent to conduct a multidisciplinary evaluation. Parents who suspect their child is eligible may verbally request a multidisciplinary evaluation from a professional employee of the District or contact the district's Special Education Department.[177][178] The IDEA 2004 requires each school entity to publish a notice to parents, in newspapers or other media, including the student handbook and website regarding the availability of screening and intervention services and how to access them.[179]
Students who have an Individual Education Plan (IEP) may take the PSSA-M an alternative math exam rather than the PSSA.[180] Some special education students may take the PASA (Pennsylvania Alternate System of Assessment), rather than the PSSA.[181] Schools are permitted to provide accommodations to some students.[182]
In 2010, the state of Pennsylvania provided $1,026,815,000 for Special Education services. This funding was in addition to the state's basic education per pupil funding, as well as, all other state and federal funding.[183] The Special Education funding structure is through the federal Individuals with Disabilities Education Act (IDEA) funds and state appropriations. IDEA funds are appropriated to the state on an annual basis and distributed through intermediate units (IUs) to school districts, while state funds are distributed directly to the districts. Total funds that are received by school districts are calculated through a formula. The Pennsylvania Department of Education oversees four appropriations used to fund students with special needs: Special Education; Approved Private Schools; Pennsylvania Chartered Schools for the Deaf and Blind; and Early Intervention. The Pennsylvania Special Education funding system assumes that 16% of the district’s students receive special education services. It also assumes that each student’s needs accrue the same level of costs.[184] Over identification of students, in order to increase state funding, has been an issue in the Commonwealth. Some districts have more than 20% of its students receiving special education services while others have 10% supported through special education.[185] The state requires each public school district and charter school to have a three-year special education plan to meet the unique needs of its special education students.[186] In 2012, the Obama Administration's US Department of Education issued a directive requiring schools include students with disabilities in extracurricular activities, including sports.[187]
Northern Cambria School District received a $747,682 supplement for special education services in 2010.[188] For the 2011-12, 2012–13 and 2013-14 school years, all Pennsylvania public school districts received the same level of funding for special education that they received in 2010-11. This level funding is provided regardless of changes in the number of pupils who need special education services and regardless of the level of services the respective students required.[189][190] For the 2014-2015 school year, Northern Cambria School District received an increase to $760,311 from the Commonwealth for special education funding.[191] Additionally, the state provides supplemental funding for extraordinarily impacted students. The District must apply for this added funding.
Gifted education
Northern Cambria School District Administration reported that 27 or 2.21% of its students were gifted in 2009. The highest percentage of gifted students reported among all 500 school districts and 100 public charter schools in Pennsylvania was North Allegheny School District with 15.5% of its students identified as gifted.[192] By law, the district must provide mentally gifted programs at all grade levels. The referral process for a gifted evaluation can be initiated by teachers or parents by contacting the student’s building principal and requesting an evaluation. All requests must be made in writing. To be eligible for mentally gifted programs in Pennsylvania, a student must have a cognitive ability of at least 130 as measured on a standardized ability test by a certified school psychologist. Other factors that indicate giftedness are also considered for eligibility.[193][194]
Budget
Pennsylvania public school districts budget and expend funds according to procedures mandated by the General Assembly and the Pennsylvania Department of Education (PDE). An annual operating budget is prepared by school district administrative officials. A uniform form is furnished by the PDE and submitted to the board of school directors for approval prior to the beginning of each fiscal year on July 1.
Under Pennsylvania’s Taxpayer Relief Act, Act 1 of the Special Session of 2006, all school districts of the first class A, second class, third class and fourth class must adopt a preliminary budget proposal. The proposal must include estimated revenues and expenditures and the proposed tax rates. This proposed budget must be considered by the Board no later than 90 days prior to the date of the election immediately preceding the fiscal year. The preliminary budget proposal must also be printed and made available for public inspection at least 20 days prior to its adoption. The board of school directors may hold a public hearing on the budget, but are not required to do so. The board must give at least 10 days’ public notice of its intent to adopt the final budget according to Act 1 of 2006.[195]
The latest teacher union contract governs years 2014-2018 inclusive.[196] The taxpayers pay 100% of the cost of the employee's health insurance. There is limited spousal coverage. In 2013, the average teacher salary in Northern Cambria School District was $55,643.08 a year.[197][198] The District employed 114 teachers with a top salary of $102,500.[199][200] Northern Cambria School District teacher and administrator retirement benefits are equal to at least 2.00% x Final Average Salary x Total Credited Service. (Some teachers benefits utilize a 2.50% benefit factor.)[201] After 40 years of service, a teacher can retire with 100% of the average salary of their final 3 years of employment. According to a study conducted at the American Enterprise Institute, in 2011, public school teachers’ total compensation is roughly 50 percent higher than they would likely receive in the private sector. The study found that the most generous benefits that teachers receive are not accounted for in many studies of compensation including: pension, retiree health benefits and job security.[202]
In 2009, Northern Cambria School District reported employing 96 teachers and administrators with a median salary of $60,537 and a top salary of $122,120.[203] The teacher’s work day is 7.5 hours with 184 days in the contract year. Additionally, the teachers receive a defined benefit pension, health insurance, professional development reimbursement, 2 paid personal days, 10 paid sick days, paid bereavement leave, paid sabbatical leave (50% of salary and benefits for one year) and other benefits.[204] As of 2007, Pennsylvania ranked in the top 10 states in average teacher salaries. When adjusted for cost of living Pennsylvania ranked fourth in the nation for teacher compensation.[205]
Administrative spending Northern Cambria School District administrative costs per pupil in 2008 was $631.64 per pupil. The lowest administrative cost per pupil in Pennsylvania was $398 per pupil.[206] The Pennsylvania School Boards Association collects and maintains statistics on salaries of public school district employees in Pennsylvania. According to the association's report, superintendents and administrators receive a benefit package commensurate with that offered to the district's teachers' union.[207] In 2013, High School principal, Joy Tibbott was moved to the administrative offices as Director of Education as part of lawsuit settlement. She was to hold the position through 2014-15 school year.[208]
Per pupil spending In 2008, Northern Cambria School District administration reported that per pupil spending was $11,562 which ranked 333rd among Pennsylvania's then 501 public school districts. In 2010, the District’s per pupil spending had increased to $13,064.59.[209] In 2013, the per pupil spending was reported as $13,030.59.[210] In 2011, Pennsylvania’s per pupil spending was $13,467, ranking 6th in the United States.[211] In 2007, the Pennsylvania per pupil total expenditures was reported as $12,759.[212]
The U.S. Census Bureau reported that Pennsylvania spent $8,191 per pupil in school year 2000-01.[213] In 2007, the Pennsylvania per pupil total expenditures was reported as $12,759.[214] Among the fifty states, Pennsylvania’s total per pupil revenue (including all sources) ranked 11th at $15,023 per student, in 2008-09.[215] Pennsylvania’s total revenue per pupil rose to $16,186 ranking 9th in the nation in 2011.[216]
Reserves In 2008, Northern Cambria School District reported a balance of $1,463,867, in its unreserved-undesignated fund. The unreserved-designated fund balance was reported as zero.[217] In 2010, Northern Cambria School District Administration reported an increase to $1,879,629 in the unreserved-undesignated fund balance. The District also reported zero in its unreserved-designated fund in 2010. Pennsylvania public school district reserve funds are divided into two categories – designated and undesignated. The undesignated funds are not committed to any planned project. Designated funds and any other funds, such as capital reserves, are allocated to specific projects. School districts are required by state law to keep 5 percent of their annual spending in the undesignated reserve funds to preserve bond ratings. According to the Pennsylvania Department of Education, from 2003 to 2010, as a whole, Pennsylvania school districts amassed nearly $3 billion in reserved funds.[218] In 2005, the total reserve funds held by Pennsylvania public school districts was $1.9 billion.[219] By 2013, reserves held by Pennsylvania public school districts, as a whole, had increased to over $3.8 billion.[220][221][222] By 2013, Northern Cambria School District reported having $1,429,556 in reserves.[223]
Tax exemptions In 2002, Northern Cambria School Board gave several tax exemptions to NORCAM Group for the former Miners Hospital Complex in the Borough of Northern Cambria.[224] In 2009 Northern Cambria Community Development Corp. owed $136,533on the former Miners Hospital property. The land was listed on the Cambria County delinquent property tax sale list.[225]
State Audits In January 2014, the Pennsylvania Auditor General conducted a performance audit of the District. The findings were reported to the School Board and the District’s administration. The findings found significant issues with conflict of interest ethics violations by a school board member.[226] In August 2010, Auditor General Wagner found the District had corrected issues regarding failing to bill nonresident students for tuition.[227]
Tuition Students who live within the Northern Cambria School District's attendance area may choose to attend one of Pennsylvania's 157 public charter schools. A student living in a neighboring public school district or a foreign exchange student may seek admission to Northern Cambria School District. For these cases, the Pennsylvania Department of Education sets an annual tuition rate for each school district. It is the amount the public school district pays to a charter school for each resident student that attends the charter and it is the amount a nonresident student's parents must pay to attend the Northern Cambria School District schools. The 2013 tuition rates are Elementary School - $9,060, High School - $9,992.[228]
Northern Cambria School District is funded by a combination of: a Local Services Tax - $5, a local earned income tax 0.5%,[229] per capita taxes, Public Utility Taxes, a property tax, a real estate transfer tax 0.5%, coupled with substantial funding from the Commonwealth of Pennsylvania and a small amount, generally 10% of its budget from the federal government.[230] Grants can provide an opportunity to supplement school funding without raising local taxes. Interest earnings on accounts also provide nontax income to the District. In the Commonwealth of Pennsylvania, pension income and Social Security income are exempted from state personal income tax and local earned income tax, regardless of the level of the individual’s personal wealth.[231] The average Pennsylvania public school teacher pension in 2011 exceeds $60,000 a year plus they receive federal Social Security benefits: both are free of Pennsylvania state income tax and local income tax which funds local public schools.[232]
State basic education funding
According to a report from Representative Todd Stephens office, Northern Cambria School District receives 75.6% of its annual revenue from the state.[233] This exceeds the goal of the state providing 50% of district funding.[234]
For the 2014-15 school year, Northern Cambria School District received $8,469,189 in State Basic Education funding. The District received another $96,043 in new Ready To Learn Block grant. The State’s enacted Education Budget includes $5,526,129,000 for the 2014-2015 Basic Education Funding.[235] The Education budget also includes Accountability Block Grant funding at $100 million and $241 million in new Ready to Learn funding for public schools that focus on student achievement and academic success. The State is paying $500.8 million to Social Security on the school employees behalf and another $1.16 billion to the state teachers pension system (PSERS). In total, Pennsylvania’s Education budget for K-12 public schools is $10 billion. This was a $305 million increase over 2013-2014 state spending and the greatest amount ever allotted by the Commonwealth for its public schools.[236]
In the 2013-2014 school year, Northern Cambria School District received a 1.2% increase or $8,469,774 in Pennsylvania Basic Education Funding. This is $99,162 more than its 2012-13 state BEF to the District. Additionally, Northern Cambria School District received $93,819 in Accountability Block Grant funding to focus on academic achievement and level funding for special education services. Among the public school districts in Cambria County, Westmont Hilltop School District received the highest percentage increase in BEF at 2.5%. The District had the option of applying for several additional state and federal grants to increase its revenues. The Commonwealth’s budget increased Basic Education Funding statewide by $123 million to over $5.5 billion. Most of Pennsylvania’s 500 public school districts received an increase of Basic Education Funding in a range of 0.9% to 4%. Eight public school districts received exceptionally high funding increases of 10% to 16%. The highest increase in state funding was awarded to Austin Area School District which received a 22.5% increase in Basic Education Funding.[237] The highest percent of state spending per student is in the Chester-Upland district, where roughly 78 percent comes from state coffers. In Philadelphia, it is nearly 49 percent.[238] As a part of the education budget, the state provided the PSERS (Pennsylvania school employee pension fund) with $1,017,000,000 and Social Security payments for school employees of $495 million.[239]
For the 2012-13 school year, Northern Cambria School District received $8,370,612 in Basic Education funding.[240] The Governor's Executive Budget for 2012-2013 included $9.34 billion for kindergarten through 12th grade public education, including $5.4 billion in basic education funding, which was an increase of $49 million over the 2011-12 budget. In addition, the Commonwealth provided $100 million for the Accountability Block Grant (ABG) program. Northern Cambria School District received $93,819 in ABG funds. The state also provided a $544.4 million payment for School Employees’ Social Security and $856 million for School Employees’ Retirement fund called PSERS.[241] This amount was a $21,823,000 increase (0.34%) over the 2011-2012 appropriations for Basic Education Funding, School Employees' Social Security, Pupil Transportation, Nonpublic and Charter School Pupil Transportation. Since taking office, Corbett’s first two budgets have restored more than $918 million in support of public schools, compensating for the $1 billion in federal stimulus dollars lost at the end of the 2010-11 school year.
In 2011-12 school year, Northern Cambria School District received a $8,370,612 allocation, of state Basic Education Funding.[242][243] Additionally, Northern Cambria School District received $93,819 in Accountability Block Grant funding. The enacted Pennsylvania state Education budget included $5,354,629,000 for the 2011-2012 Basic Education Funding appropriation. This amount was a $233,290,000 increase (4.6%) over the enacted State appropriation for 2010-2011.[244] The highest increase in state basic education funding was awarded to Duquesne City School District of Allegheny County, which got a 49% increase in state funding for 2011-12.[245] In 2010, the district reported that 555 students received free or reduced price lunches, due to the family meeting the federal poverty level.[246] Some Pennsylvania public school districts experienced a reduction of total funding due to the termination of federal stimulus funding which ended in 2011.
In the 2010-11 budget year, the Commonwealth of Pennsylvania provided Northern Cambria School District a 2% increase in Basic Education Funding for a total of $8,833,901 . Among the districts in Cambria County, the highest increase went to Westmont Hilltop School District which got a 10.14% increase. One hundred fifty Pennsylvania school districts received the base 2% increase. The highest increase in 2010-11 went to Kennett Consolidated School District in Chester County, which received a 23.65% increase in state funding.[247] Fifteen (15) Pennsylvania public school districts received a BEF increase of greater than 10%. The state's hold harmless policy regarding state basic education funding continued where each district received at least the same amount as it received the prior school year, even when enrollment had significantly declined. The amount of increase each school district received was set by Governor Edward Rendell and then Secretary of Education Gerald Zahorchak, as a part of the state budget proposal given each February. This was the second year of Governor Rendell’s policy to fund some public school districts at a far greater rate than others.[248]
In the 2009-10 budget year, the Commonwealth of Pennsylvania provided a 3.47% increase in Basic Education Funding for a total of $8,660,687. Among the districts in Cambria County, the highest increase went to Westmont Hilltop School District which got an 8.22%. Ninety (90) Pennsylvania public school districts received the base 2% increase. Muhlenberg School District in Berks County received a 22.31% increase in state basic education funding in 2009.[249] The amount of increase each school district received was set by Governor Edward G. Rendell and the Secretary of Education Gerald Zahorchak, as a part of the state budget proposal.[250]
The state Basic Education Funding to the District in 2008-09 was $7,634,543. According to the Pennsylvania Department of Education, 549 district students received free or reduced- price lunches due to low family income in the 2007–2008 school year.[251] According to the U.S. Census Bureau, Pennsylvania spent $7,824 Per Pupil in the year 2000. This amount increased up to $12,085 by the year 2008.[252][253]
All Pennsylvania school districts also receive additional funding from the state through several funding allocations, including: Reimbursement of Charter School Expenditures; Special Education Funding; Secondary Career & Technical Education Subsidy; PA Accountability Grants; and low achieving schools were eligible for Educational Assistance Program Funding. Plus all Pennsylvania school districts receive federal dollars for various programs including: Special Education funding and Title I funding for children from low income families. In 2010, Pennsylvania spent over $24 billion for public education - local, state and federal dollars combined.[254] By 2015, Pennsylvania is spending over $27 billion on public education (local, state and federal resources combined).[255]
Accountability Block Grants
Beginning in 2004-2005, the state launched the Accountability Block Grant school funding. This program has provided $1.5 billion to Pennsylvania’s school districts. The Accountability Block Grant program requires that its taxpayer dollars are focused on specific interventions that are most likely to increase student academic achievement. These interventions include: teacher skills training; All Day Kindergarten; lower class size in Kindergarten through 3rd grade; literacy and math coaching programs (provides teachers with individualized job-embedded professional development to improve their instruction); before or after school tutoring assistance to struggling students. For 2010-11, the District applied for and received $254,649 in addition to all other state and federal funding. The District used the funding to provide full-day kindergarten to 37 children.[256][257] In 2009, 100% of the kindergarteners in Northern Cambria School District attended full-day kindergarten.[258]
Ready to Learn grant
Beginning in the 2014-2015 budget, the State funded a new Ready to Learn Grant for public schools. A total of $100 million is allocated through a formula to districts based on the number of students, level of poverty of community as calculated by its market value/personal income aid ratio (MV/PI AR) and the number of English language learners. Ready to Learn Block Grant funds may be used by the Districts for: school safety; Ready by 3 early childhood intervention programs; individualized learning programs; and science, technology, engineering and math (STEM) programs.[259]
Northern Cambria School District received $96,043 in Ready to Learn Grant dollars in addition to State Basic Education funding, Special Education funding, PreK Counts funding, reimbursement for Social Security payments for employees and other state grants which the district must apply to receive.
PreK Counts grant
Northern Cambria School District receives state funding to provide taxpayer funded preschool at the elementary schools. For the 2013-14 school year, the District received a Pre K Counts grant of $117,000.[260] For the 2011 school year, Northern Cambria School District was a high priority for funding due to the 48% poverty level of children in the district's attendance area.[261][262][263] Enrollment for Pennsylvania Pre-K Counts is targeted to children living in families earning up to 300 percent of the federal poverty level.
In 2013, the state’s PreK Counts program received $87,284,000. In 2010, the PreK Counts program received $83.6 million statewide in Governor Corbett’s education budget. In 2007-08, the state funded Pre-K Counts at $75 million. Northern Cambria School District did not receive funding in 2007-08.[264] In 2009-10, the district received $118,500 to provide preschool to 30 children.[265][266] The District received $98,750 enrolling 25 students for 2011-12[267]
In addition to PreK Counts, the Commonwealth of Pennsylvania also supplements the federal Head Start preschool program with an additional funding on an annual basis. The program is available to low income children residing within the District through private providers. In 2013, Pennsylvania contributed $39,178,000 to Head Start. In 2010, Head Start received $37.6 million in Pennsylvania state education dollars. Since 2003, Pennsylvania has more than doubled the number of preschoolers in publicly funded pre-kindergarten through a mulipronged system including: school-based pre-kindergarten, Pennsylvania Pre-K Counts through private providers, Early Intervention, Head Start and Head Start Supplemental, and the school district’s use of Accountability Block Grants. Over 100,000 Pennsylvania preschoolers participate in state taxpayer funded pre-kindergarten programs. In 2013, the federal government spent $8 billion for preschool programs nationwide.[268] In 2013, Pennsylvania was awarded a $51.7 million federl grant to fund early learning programs.[269] The funding will be used to create 50 Early Childhood Education Community Innovation Zones in areas where the lowest-performing public schools, including charter schools, exist. The federal dollars were not be used to provide seats for children in preschools. Instead the money was used to build state bureaucray and added training for teachers/providers.[270]
Classrooms for the Future grant
The Classroom for the Future state program provided districts with hundreds of thousands of extra state funding to buy laptop computers for each core curriculum high school class (English, Science, History, Math) and paid for teacher training to optimize the computers use. The program was funded from 2006 to 2009. The School District applied to participate in 2006-07, but was denied funding by PA Education Secretary Gerald Zahorchak. In 2007-08 and in 2008-09 did not apply for funding in spite of repeated requests from the Board to do so.[271][272][273][274] Among the public school districts in Cambria County, the highest award was given to Greater Johnstown School District which received $463,166. The highest funding statewide was awarded to Philadelphia City School District in Philadelphia County - $9,409,073. The grant program was discontinued by Governor Edward Rendell as part of the 2009-10 state budget.
Science It’s Elementary grant
Northern Cambria Elementary School successfully applied to participate and received a Science It’s Elementary grant in 2008-09.[275] For the 2008-09 school year, the program was offered in 143 schools reaching 66,973 students across the Commonwealth of Pennsylvania.[276] In 2007, the Pennsylvania Department of Education initiated an effort to improve science instruction in the Commonwealth’s public elementary schools. Called Science: It’s Elementary, the program was a hands on instruction approach for elementary science classes that develops problem-solving and critical thinking skills.[277] To encourage schools to adopt the program’s standards aligned curriculum, the state provided a grant to cover the costs of materials and extensive mandatory teacher training.[278] The district was required to develop a three-year implementation plan for the participating school. The school district administration was required to appoint a district liaison who was paid $3,000 by PDE to serve as the conduit of all information between the district and the Department and its agents along with submitting orders and distributing supplies to implementing teachers. For the 2006-07 state education budget, $10 million was allocated for the program.[279] The grant program was expanded to $14.5 million in the 2008-09 budget. The grant was discontinued in the state’s 2011 budget by Governor Edward G. Rendell.
Education Assistance Grant
The state's EAP funding provides for the continuing support of tutoring services and other programs to address the academic needs of eligible students. Funds are available to eligible school districts and full-time career and technology centers (CTC) in which one or more schools have failed to meet at least one academic performance target, as provided for in Section 1512-C of the Pennsylvania Public School Code. In 2010-11 the Northern Cambria School District received $24,245.[280] In 2003-04, Governor Rendell signed into law the EAP for targeted tutoring at a funding level of $38 million. Almost 35,000 students in 82 academically challenged school districts received extra help in the first year. The program was continued at the same funding level in 2004-05. In 2005-06, the program received $66 million in funding and expanded to support tutoring in 175 school districts and Career and Technical Centers.
Hybrid Learning grants
Northern Cambria School District participated in a pilot year of the state’s Hybrid learning initiative. Pennsylvania Hybrid Learning uses three learning models to increase student achievement: instruction from the teacher, group activities, and self-instruction through digital content. According to state testing results, among the pilot schools, 88 percent achieved higher academic performance in hybrid classes compared to traditional classes in the same district or statewide benchmarks, 75 percent reported better academic achievement, and all of them met or exceeded academic growth.[281] In 2013-14, the state awarded $633,000 in federal Title 2A funds to accelerate teacher training in the implementation of hybrid learning programs in 50 school buildings in 34 school entities. In 2012, $1.1 million was awarded to 15 districts to launch the first hybrid pilot schools in the state that included more than 1,900 students and 48 teachers.[282] Northern Cambria School District received $19,500.
Other grants
Northern Cambria School District did not participate in: Pennsylvania Department of Environmental Protection's Environmental Education annual grants;[283][284] 2012 Striving Readers Comprehensive Literacy grant;[285] 2013 Safe Schools and Resource Officer grants; Project 720 High School Reform grants (discontinued effective with 2011-12 budget); nor the federal 21st Century Learning grants.
Federal Stimulus grant
The Northern Cambria School District received an extra $2,027,455 in American Recovery and Reinvestment Act of 2009 (ARRA) - Federal Stimulus money to be used in specific programs like special education and meeting the academic needs of low-income students.[286][287] The funding was limited to the 2009-2010 and 2010-2011 school years.[288] Due to the temporary nature of the funding, schools were repeatedly advised by the Pennsylvania Department of Education, the Pennsylvania Senate Education Committee, the Governor and the Pennsylvania School Board Association, to use the funds for one-time expenditures like acquiring equipment, making repairs to buildings, training teachers to provide more effective instruction or purchasing books and software.
Race to the Top grant
Northern Cambria School District officials applied for the federal Race to the Top grant which would have provided over one million dollars, in additional federal funding, to improve student academic achievement.[289] Participation required the administration, the school board and the local teachers' union to sign an agreement to prioritize improving student academic success. In Pennsylvania, 120 public school districts and 56 charter schools agreed to participate.[290] Pennsylvania was not approved for the grant. The failure of districts to agree to participate was cited as one reason that Pennsylvania was not approved.[291][292][293]
Common Cents state initiative
Northern Cambria School Board elected to not participate in the Pennsylvania Department of Education Common Cents program.[294] The program called for the state to audit the district, at no cost to local taxpayers, to identify ways the district could save tax dollars.[295][296] After the review of the information, the district was not required to implement the recommended cost savings changes.
Local Services Tax
All local taxing authorities are required by the Local Tax Enabling Act to exempt disabled veterans and members of the armed forces reserve who are called to active duty at any time during the tax year from any local services tax and to exempt from any local services tax levied at a rate in excess of $10 those persons whose total income and net profits from all sources within the political subdivision is less than $12,000 for the tax year. The Local Tax Enabling Act also authorizes, but does not require, taxing authorities to exempt from per capita, occupation, and earned income taxes and any local services tax levied at a rate of $10 or less per year, any person whose total income from all sources is less than $12,000 per year.
Real estate taxes
Property tax rates in 2014-2015 were set by the school board at 50.1600 mills.[297] A mill is $1 of tax for every $1,000 of a property's assessed value. Irregular property reassessments have become a serious issue in the commonwealth as it creates a significant disparity in taxation within a community and across a region.[298] Property taxes, in the Commonwealth of Pennsylvania, apply only to real estate - land and buildings. The property tax is not levied on cars, business inventory, or other personal property. Certain types of property are exempt from property taxes, including: places of worship, places of burial, private social clubs, charitable and educational institutions and all government property (local, state and federal). Additionally, service related, disabled US military veterans may seek an exemption from paying property taxes. Pennsylvania school district revenues are dominated by two main sources: 1) Property tax collections, which account for the vast majority (between 75-85%) of local revenues; and 2) Act 511 tax collections, which are around 15% of revenues for school districts.[299] When a Pennsylvania public school district includes municipalities in two counties, each of which has different rates of property tax assessment, a state board equalizes the tax rates between the counties.[300] In 2010, miscalculations by the State Tax Equalization Board (STEB) were widespread in the Commonwealth and adversely impacted funding for many school districts, including those that did not cross county borders.[301]
The average yearly property tax paid by Cambria County residents amounts to about 2.4% of their yearly income. Cambria County ranked 1048th out of the 3143 United States counties for property taxes as a percentage of median income.[311] According to a report prepared by the Pennsylvania Department of Education, the total real estate taxes collected by all school districts in Pennsylvania rose from $6,474,133,936 in 1999-00 to $10,438,463,356 in 2008-09 and to $11,153,412,490 in 2011.[312] Property taxes in Pennsylvania are relatively high on a national scale. According to the Tax Foundation, Pennsylvania ranked 11th in the U.S. in 2008 in terms of property taxes paid as a percentage of home value (1.34%) and 12th in the country in terms of property taxes as a percentage of income (3.55%).[313] Pennsylvania's 2011 tax burden of 10.35% ranked 10th highest out of 50 states. The tax burden was above the national average of 9.8%. Pennsylvania's taxpayers paid $4,374 per capita in state and local taxes, including school taxes.[314]
Act 1 Adjusted Index
The Act 1 of 2006 Index regulates the rates at which each school district can raise property taxes in Pennsylvania. Districts are not permitted to raise property taxes above their annual Act 1 Index unless they either: allow Districts voters to approve the increase through a vote by referendum or they receive an exception from the Pennsylvania Department of Education. The base index for the school year is published by the PDE in the fall of each year. Each individual school district’s Act 1 Index can be adjusted higher, depending on a number of factors, such as local property values and the personal income of district residents. Originally, Act 1 of 2006 included 10 exceptions, including: increasing pension costs, increases in special education costs, a catastrophe like a fire or flood, increase in health insurance costs for contracts in effect in 2006 or dwindling tax bases. The base index is the average of the percentage increase in the statewide average weekly wage, as determined by the PA Department of Labor and Industry, for the preceding calendar year and the percentage increase in the Employment Cost Index for Elementary and Secondary Schools, as determined by the Bureau of Labor Statistics in the U.S. Department of Labor, for the previous 12-month period ending June 30. For a school district with a market value/personal income aid ratio (MV/PI AR) greater than 0.4000, its index equals the base index multiplied by the sum of .75 and its MV/PI AR for the current year.[315]
In June 2011, the Pennsylvania General Assembly passed legislation eliminating six of the exceptions to the Act 1 Index.[316] Several exceptions were maintained: 1) costs to pay interest and principal on indebtedness incurred prior to September 4, 2004 for Act 72 schools and prior to June 27, 2006 for non-Act 72 schools; 2) costs to pay interest and principal on electoral debt; 3) costs incurred in providing special education programs and services (beyond what is already paid by the State); and 4) costs due to increases of more than the Index in the school’s share of payments to PSERS (PA school employees pension fund) taking into account the state mandated PSERS contribution rate.[317][318] The legislature also froze the payroll amount public school districts use to calculate the pension-plan exception at the 2012 payroll levels. Further increases in payroll cannot be used to raise the district’s exception for pension payments.
A specific timeline for Act I Index decisions is published annually, by the Pennsylvania Department of Education.[319]
The School District Adjusted Index history for the Northern Cambria School District:
|
For the 2014-15 budget year, Northern Cambria School Board applied for an exception to exceed their Act 1 Index limit, due to the rapidly escalting cost of the teachers pensions. In 2014-15, all Pennsylvania school districts were required to make a 21.4% of payroll payment to the teacher’s pension fund (PSERS).[325] For the school budget 2014-15, 316 Pennsylvania public school districts adopted a resolution certifying that tax rates would not be increased above its Act 1 Index limit. Another 181 school districts adopted a preliminary budget leaving open the option of exceeding the Index limit. Districts may apply for multiple exceptions each year. For the pension costs exception, 163 school districts received approval to exceed the Index in full, while others received a partial approval of their request. For special education costs, 104 districts received approval to exceed their tax limit. Seven Pennsylvania public school districts received an approval for the grandfathered construction debts exception.[326]
For the 2013-14 budget year, Northern Cambria School Board applied for an exception to exceed their Act 1 Index limit, due to rising teacher pension costs. In 2013-14, all Pennsylvania school districts were required to make a 16.93% of payroll payment to the teacher’s pension fund (PSERS). For the school budget year 2013-14, 311 Pennsylvania public school districts adopted a resolution certifying that tax rates would not be increased above their index. Another 171 school districts adopted a preliminary budget leaving open the option of exceeded the Index limit. For the pension costs exception, 169 school districts received approval to exceed the Index. For special education costs, 75 districts received approval to exceed their tax limit. Eleven Pennsylvania public school districts received an approval for grandfathered construction debts.[327]
For the 2012-13 budget year, Northern Cambria School Board applied for two exceptions to exceed the Act 1 Index: special education costs and rising teacher pension costs. In 2012-13, all Pennsylvania school districts were required to make a 12.36% of payroll payment to the teacher’s pension fund (PSERS). For 2012-2013 budget year, 274 school districts adopted a resolution certifying that tax rates would not be increased above their index; while 223 school districts adopted a preliminary budget leaving open the option of exceeded the Index limit. For the exception for pension costs, 194 school districts received approval to exceed the Index. For special education costs, 129 districts received approval to exceed the tax limit.[328]
For the 2011-12 school year, Northern Cambria School Board did not apply for an exception to exceed the Act 1 Index. In 2011-12, all Pennsylvania school districts were required to make an 8.65% of payroll payment to the teacher’s pension fund. Each year, Northern Cambria School Board has the option of adopting either: 1) a resolution in January certifying they will not increase taxes above their index or 2) a preliminary budget in February. A school district adopting the resolution may not apply for referendum exceptions or ask voters for a tax increase above the inflation index.
Property tax relief
In 2014, Northern Cambria School District approved 2,345 homestead properties to receive $134 each.[329] The decline in amount was related to more residents applying for tax relief and a decline in table games tax revenues. The amount received by the District must be divided equally among all approved residences.[330]
In 2009, Northern Cambria School District approved 2,307 homestead properties to receive $136 in property tax relief.[331] The relief was subtracted from the total annual school property tax bill. Property owners apply for the relief through the county Treasurer's office. Farmers can qualify for a farmstead exemption on building used for agricultural purposes. The farm must be at least 10 contiguous acres (40,000 m2) and must be the primary residence of the owner. Farmers can qualify for both the homestead exemption and the farmstead exemption. The amount of property tax relief each Pennsylvania public school district receives is announced by the PDE in May of each year. The amount of tax relief is dependent on the total tax revenue collected on the casino slots in the previous year. Thirty five percent of the slots tax revenues are used for property tax relief. In Cambria County, the highest tax relief went to Ferndale Area School District which was set at $214.[332] The highest property tax relief provided, among Pennsylvania school districts, goes to the homesteads of Chester Upland School District in Delaware County which received $632 per approved homestead in 2010. Chester-Upland School District has consistently been the top recipient since the programs inception.[333] The tax relief was started by Governor Edward G. Rendell with passage of the state gaming law in 2004. Rendell promised taxpayers substantial property tax relief from legalized gambling.[334] In Cambria County, 54% of eligible property owners applied for property tax relief in 2009. This was among the lowest participation rates in Pennsylvania.[335]
In Pennsylvania, the homestead exclusion reduces the assessed values of homestead properties, reducing the property tax on these homes. The homestead exclusion allows homeowners real property tax relief of up to one half of the median assessed value of homesteads in the taxing jurisdiction (county, school district, city, borough, or township).[336]
Some Northern Cambria School District residents, including: low income residents aged 65 and older; widows and widowers aged 50 and older; and people with disabilities age 18 and older, can qualify for the state's Property Tax/Rent Rebate program. The income limit is $35,000 for homeowners.[337] Residents must apply annually to receive up to $650. The Property tax/rent rebate program is funded by revenues from the Pennsylvania Lottery. In 2012, these property tax rebates were increased by an additional 50 percent for senior households in the state, so long as those households have incomes under $30,000 and pay more than 15% of their income in property taxes.[338]
Nutrition/Wellness policy
Northern Cambria School Board established a district wellness policy in 2006.[339] The policy deals with nutritious meals served at school, the control of access to some foods and beverages during school hours, age appropriate nutrition education for all students, and physical education for students K-12. The policy is in response to state mandates and federal legislation (P.L. 108 – 265). The law dictates that each school district participating in a program authorized by the Richard B. Russell National School Lunch Act (42 U.S.C. 1751 et seq) or the Child Nutrition Act of 1966 (42 U.S.C. 1771 et seq) "shall establish a local school wellness policy by School Year 2006." Most districts identified the superintendent and school foodservice director as responsible for ensuring local wellness policy implementation.[340]
The legislation placed the responsibility of developing a wellness policy at the local level so the individual needs of each district can be addressed. According to the requirements for the Local Wellness Policy, school districts must set goals for nutrition education, physical activity, campus food provision, and other school-based activities designed to promote student wellness. Additionally, districts were required to involve a broad group of individuals in policy development and to have a plan for measuring policy implementation. Districts were offered a choice of levels of implementation for limiting or prohibiting low nutrition foods on the school campus. In final implementation these regulations prohibit some foods and beverages on the school campus.[341] The Pennsylvania Department of Education required the district to submit a copy of the policy for approval.
Northern Cambria School District offers both a free school breakfast and a free or reduced-price lunch to children in low income families. All students attending the school can eat breakfast and lunch. Children from families with incomes at or below 130 percent of the federal poverty level are provided a breakfast and lunch at no cost to the family. Children from families with incomes between 130 and 185 percent of the federal poverty level can be charged no more than 30 cents per breakfast. A foster child whose care and placement is the responsibility of the State or who is placed by a court with a caretaker household is eligible for both a free breakfast and a free lunch. Runaway, homeless and Migrant Youth are also automatically eligible for free meals.[342] The meals are partially funded with federal dollars through the United States Department of Agriculture.[343] The District also offers the Seamless Summer Food program to all children without charge.[344]
In 2013, the USDA issued new restrictions to foods in public schools. The rules apply to foods and beverages sold on all public school district campuses during the day. They limit vending machine snacks to a maximum of 200 calories per item. Additionally, all snack foods sold at school must meet competitive nutrient standards, meaning they must have fruits, vegetables, dairy or protein in them or contain at least 10 percent of the daily value of fiber, calcium, potassium, and Vitamin D.[345] In order to comply with the Healthy, Hunger-Free Kids Act of 2010 all US public school districts are required to raise the price of their school lunches to $2.60 regardless of the actual cost of providing the lunch.[346] The Healthy Hunger-Free Kids Act of 2010 mandates that Districts raise their full pay lunch prices every year until the price of non-subsidized lunches equals the amount the federal government reimburses schools for free meals. That subsidy in 2013-2014 was $2.93.
In 2014, President Obama ordered a prohibition of advertisements for unhealthy foods on public school campuses during the school day.[347] The Food and Drug Administration requires that students take milk as their beverage at lunch. In accordance with this law, any student requesting water in place of milk with their lunch must present a written request, signed by a doctor, documenting the need for water instead of milk.[348][349]
Northern Cambria School District provides health services as mandated by the Commonwealth and the federal government. Nurses are available in the buildings to conduct annual health screenings (data reported to the PDE and state Department of Health) and to dispense prescribed medications to students during the school day. Students can be excluded from school unless they comply with all the State Department of Health’s extensive immunization mandates. School nurses monitor each pupil for this compliance.[350][351] Nurses also monitor each child's weight.[352]
Highmark Healthy High 5 grant
In 2014, Northern Cambria School District received funding through a Highmark Healthy High 5 grant. Northern Cambria Elementary School received $5,000 which was used to purchase the Healthy Beginnings Program to promote student wellness.[353] Beginning in 2006, Highmark Foundation engaged in a 5-year, $100 million program to promote lifelong healthy behaviors in children and adolescents through local nonprofits and schools. Northern Cambria High School also received a $7,588 Healthy High 5 grant in 2011. The funds were used to fund Get Moving Keep Moving program. The Middle School was also funded receiving $9,540 to fund Those AWKARD Middle School Years intervention.[354]
Extracurriculars
The District offers a wide variety of clubs, activities and an extensive, publicly funded sports program.[355] Eligibility for participation is determined by school board policy and in compliance with standards set by the Pennsylvania Interscholastic Athletic Association (PIAA).
By Pennsylvania law, all K-12 students residing in the school district, including those who attend a private nonpublic school, cyber charter school, charter school and those homeschooled, are eligible to participate in the extracurricular programs including all athletics. They must meet the same eligibility rules as the students enrolled in the district's schools.[356]
According to PA Child Abuse Recognition and Reporting Act 126 of 2014, all volunteer coaches and all those who assist in student activities, must have criminal background checks. Like all school district employees, they must also attend an anti child abuse training once every three years.[357][358][359]
Athletics
The Northern Cambria teams are call the Colts with the school colors being black and gold. The black color was adopted from the previous Barnesboro High School and the gold from Spangler High School. The Northern Cambria Track and Sports Complex (Charles Miller Track) is located behind the high school. The school football field is not at the high school, but at a site about one mile away. The school's girls volleyball team won the PIAA A state championship in 2005 and 2009. The boys basketball team won the PIAA Class B state championship in 1965.
Coaches receive compensation as outlined in the teachers' union contract. When athletic competition exceeds the regular season, additional compensation is paid.[360]
Northern Cambria High School offers the following PIAA sports:
- Varsity
|
|
Middle School Sports:
|
|
According to PIAA directory July 2015[361]
In 2014, Northern Cambria School District discontinued offering its own wrestling team due to a lack of participation.[362] Students can access a wrestling program through a cooperative program with Cambria Heights School District.[363]
District 6 Championships
Northern Cambria competes in District 6 of the PIAA. In most sports, Northern Cambria is either in the A or AA classification. District championships include:
|
|
PIAA State Team Championships
2009 Girls Volleyball State Champion - Class A
The 2009 girls volleyball team won the PIAA championship at the A classification, defeating Reading Holy Name 3 sets to 0. They defeated Nativity BVM 3 sets to 0 in the state semifinals. The championships were held at Central York High School.
2005 Girls Volleyball State Champion - Class A
The 2005 girls volleyball team won the PIAA championship at the A classification, defeating the Marian Catholic Fillies 25-8, 26-24, 25-13. They defeated the Reading Central Catholic Cardinals 22-25, 25-16, 25-17, 25-15 in the state semifinals. The championships were held at Central York High School. Northern Cambria finished the year with a record of 27-0.[364]
1965 Boys Basketball State Champion - Class B
In 1965 the boys basketball team (competing in Class B) won the school's first state championship, defeating the representative from Eastern Pennsylvania, Montrose, by a score of 78 to 69. The game was played at the Pitt Field House on the campus of the University of Pittsburgh. Montrose was the defending state champions and also came into the game with a 53-game unbeaten streak. The Colts' victory ended Montrose's bid to tie the state record for consecutive wins. Northern Cambria finished the year with a record of 27-1, with their lone loss coming to DeMatha Catholic High School of Maryland.[365]
PIAA State Championship Playoff Appearances
2011 Boys A Basketball Round of 16
The 2011 team became the first boys basketball team at the school to win a boys state basketball playoff game in over 40 years. They beat Union(Rimersburg) in the first round. Tony Rocco led the Colts that game with 20 points and 11 steals. In the round of 16 they lost to Rocky Grove.
2010 Boys A Basketball Round of 32
The 2010 team won the Heritage Conference and playoffs looked bright. However, in the first round they played Reading Central Catholic, the favored team in the state tournament to win. They kept the game close with a gap of just 7 going into the 4th quarter, but Reading deemed too much for the Colts. Northern Cambria shot a horrid 9%(3-31) from the 3-pt line, usually their specialty, or they might have pulled off the upset. Marcus Dawkins, a member of Reading Central Catholic, dunked on Joe Yuhas's head in the game and also threw the ball of the backboard to himself on a fast break and dunked it. Marcus Dawkins is black. This team also won the Cambria Heights Christmas basketball tournament in 2009. Named to the all-tourney team was Anthony Penksa, Josh Stiles, and Tony Rocco. Left off of the all-tourney was Joe Yuhas. To this day Joe is still salty about the whole ordeal. He weeps alone in his room for hours and hours when thinking back.
2008 Girls AA Basketball State Runner-Up
The 2008 team became the first girls basketball team at the school to make the state playoffs. In the first round (the round of 32), NC defeated District 7's #7 seed Beaver 56-47. In the second round, they defeated District 7's #4 seed Ford City 54-18. NC defeated District 10's #2 seed Girard in the state quarterfinals 41-30 at Slippery Rock. In the Western Final, the Colts defeated District 6 rival Bishop McCort 45-42. They lost in the state final to York Catholic 52-40 at the Bryce Jordan Center in State College. In the District 6 playoffs, NC defeated Southern Huntingdon 60-48 in the semifinals and then defeated Bishop McCort in the District 6 championship 65-48 at the War Memorial in Johnstown.
2006 Girls A Volleyball State Runner-Up
The Colts finished as state runners-up in A volleyball in 2006. Northern Cambria defeated District 7 Champion Geibel Catholic in the state semifinals, defeating the Gators 25-22, 21-25, 21-25, 25-21, 15-10. The Colts then lost to Reading Central Catholic 25-22, 25-12, 25-15 in the state championship game. The championships were held at Central York High School. It was the third straight year that Northern Cambria made it to the championship match in girls volleyball (they won the title in 2005).[366]
2004 Girls A Volleyball State Runner-Up
In 2004, Northern Cambria defeated Reading Central Catholic 25-21, 19-25, 25-20, 26-24 in the state semifinals. They then lost in the finals to District 10 Champion Cochranton 25-17, 25-23, 25-20. The championships were held at Robert Morris University outside of Pittsburgh.[367]
2007 Girls A Volleyball State Semifinalist
The volleyball team continued its success in 2007. This time, however, the Colts fell in the state semifinals, losing to the Cochranton Cardinals, the District 10 Champion, 3 sets to 1. The championships were held at Central York High School.
2006 Girls A Softball State Semifinalist
In 2006, the Northern Cambria softball team reached the state's final four. The Colts lost to eventual state champion Blue Ridge in the state semifinals. The game was played in Williamsport, PA. Northern Cambria lost the District 6 Championship that year to Southern Huntingdon. They rebounded, however, by defeating Northern Bedford and East Juniata to reach the final four. The Colts played in the "eastern" half of the state bracket.
2003 Girls A Softball State Semifinalist
In 2003, the Colts softball team lost to Chartiers-Houston in the state semifinals. Northern Cambria lost a 1-0 lead late in the game and lost 2-1 in eight innings. The Colts won the school's first District 6 Championship in girls sports by defeating Southern Huntingdon. They then defeated Northern Bedford and Leechburg to reach the state semifinals. Northern Cambria defeated Leechburg 1-0 in 13 innings. The Colts played in the "western" half of the state bracket.[368]
2008 Girls A Volleyball State Quarterfinalist
Northern Cambria advanced to the state tournament by defeating Bishop Guilfoyle in 3 sets to 0 sets to win the district 6 championship for the 5th straight year. They then defeated Elderton in the first round of the state playoffs in a 5 set match. In this match-up, Elderton won the first two sets but NC rallied to take it in 5. The quarterfinal round (final 8) was played at Central York High School. The Colts finished fourth in their pool (North Star, Maplewood, and Reading Holy Name) and did not advance to the semifinals.
2009 Girls A Basketball State Quarterfinalist
The girls basketball team finished 2nd in District 6, losing to Bishop Guilfoyle High School in the d6A finals. In the first round of states, they defeated Lancaster Country Day at Central Cambria High School. They then rallied to defeat Tri-Valley High School at Big Springs High School. In the final 8, they lost a nail-biter to Benton High School.
2009 Girls A Softball State Quarterfinalist
The girls softball team defeated Bishop Guilfoyle High School in the district 6 semifinals to earn a state playoff bid. They lost the d6 championship to Claysburg-Kimmel High School. In the first round of the state playoffs, the Colts defeated Fannett-Metal High School 4-3 at Everett High School. In the final 8, they lost to Vincentian Academy 7-3.
2007 Boys A Basketball First Round - Round of 32
The boys basketball team made the PIAA playoffs by finishing fourth in District 6 A. The team lost to Harmony in the district semifinals. They then lost to Saltsburg in the consolation game. In the first round of the state playoffs, the team lost to defending PIAA A champion Elk County Catholic.
2002 Boys AA Basketball First Round - Round of 32
In 2002, the boys basketball team made the state playoffs for the third straight year. The team lost to District 5's North Star. The team lost to Tyrone in the District 6 semifinals but defeated Homer Center to finish 3rd in District 6.
2001 Boys AA Basketball First Round - Round of 32
The 2001 basketball team won the District 6 AA championship by defeating Westmont Hilltop. They lost in the first round of the state playoffs to District 7's Wilkinsburg.
2000 Boys AA Basketball First Round - Round of 32
PIAA Individual Champions
- Janae Dunchack has won four individual state gold medals in the high jump competition in track and field.
- Gus Yahner 2014 PIAA Pole Vault State Champion.
Conference Affiliation
Northern Cambria's athletic teams compete in the Heritage Conference. Most of the schools in this conference are in Indiana County. The conference consists of the following teams:
- The Blairsville High School Bobcats
- The Homer-Center High School Wildcats
- The Ligonier Valley High School Rams (Westmoreland County)
- The Marion Center High School Stingers
- The Northern Cambria High School Colts (Cambria County)
- The Penns Manor High School Comets
- The Purchase Line High School Dragons
- The Saltsburg High School Trojans
- The United High School Lions
Recent conference championships include:
- 2012 Boys Basketball
- 2010 Boys Basketball
- 2010 Girls Volleyball
- 2010 Girls Track and Field
- 2010 Boys Basketball
- 2009 Girls Volleyball
- 2009 Girls Track and Field
- 2009 Girls Basketball
- 2008 Girls Volleyball
- 2008 Girls Track and Field
- 2008 Girls Basketball
- 2007 Girls Volleyball
- 2007 Girls Track and Field
- 2007 Girls Basketball (shared with Penns Manor)
- 2007 Boys Basketball (shared with Blairsville)
- 2006 Girls Volleyball
- 2006 Girls Track and Field
- 2006 Girls Basketball
- 2005 Girls Volleyball
- 2005 Girls Track and Field
- 2005 Girls Softball
- 2004 Girls Volleyball
- 2004 Girls Track and Field
- 2004 Girls Softball
- 2003 Girls Softball
- 2003 Girls Track and Field
- 2003 Girls Basketball (shared with Marion Center)
External links
- Northern Cambria School District website
- Northern Cambria community website
- 2004 PIAA A Volleyball Bracket
- 2005 PIAA A Volleyball Bracket
- 2006 PIAA A Volleyball Bracket
- NCSD 2005 Volleyball Page
- PIAA District 6 website
- PIAA website
References
- ↑ PDE (2015). "Education Names and Addresses".
- ↑ Kathy Mellott (August 21, 2014). "Northern Cambria chooses new superintendent". Tribune Democrat.
- ↑ Northern Cambria School Board Secretary (August 11, 2014). "Special Board Meeting Minutes" (PDF).
- ↑ Kelly Cernetich (August 23, 2014). "NCambria school district hires new superintendent". The Altoona Mirror.
- ↑ Northern Cambria School Board (2007). "Employment contract Dr. Thomas Estep" (PDF).
- ↑ National Center for Education Statistics (2015). "Common Core of Data -Northern Cambria School District".
- ↑ PDE (November 6, 2014). "Northern Cambria School District Fast Facts 2014".
- ↑ Pennsylvania Department of Education (December 5, 2013). "Northern Cambria School District School Performance report fast facts".
- ↑ Pennsylvania Department of Education, Enrollment and Projections by LEA, 2010
- ↑ Pennsylvania Department of Education (2014). "Public School Enrollment Reports".
- ↑ Pennsylvania Department of Education (July 2011). "Enrollment and Projections by school district".
- ↑ Northern Cambria School Board Secretary (April 14, 2015). "Special Meeting Minutes April 2015" (PDF).
- ↑ Northern Cambria School Board Secretary (June 25, 2013). "Board Meeting Minutes June 2013" (PDF).
- ↑ PFM Auction (2012). "Board Issuance documentation" (PDF).
- ↑ Pennsylvania Department of Education, Finances Selected Data 2012-13, 2014
- ↑ US Census Bureau, 2010 Census Poverty Data by Local Education Agency, 2011
- ↑ proximityone (2014). "School District Comparative Analysis Profiles".
- ↑ Pennsylvania Budget and Policy Center, Education Facts Student Poverty Concentration by LEA, 2012
- ↑ US Census Bureau, American Fact Finder, 2009
- ↑ US Census Bureau (2010). "American Fact Finder, State and County quick facts".
- ↑ US Census Bureau (September 2011). "Income, Poverty, and Health Insurance Coverage in the United States: 2010" (PDF).
- ↑ US Census Bureau (2014). "Pennsylvania Median household income, 2006-2010 by County".
- ↑ Michael Sauter & Alexander E.M. Hess, (August 31, 2013). "America's most popular six-figure jobs". USA Today.
- ↑ Pennsylvania Public School Code Governance 2010
- ↑ Pennsylvania General Assembly, Pennsylvania School Code, 2013
- ↑ Pittsburgh Business Times (April 10, 2015). "Guide to Pennsylvania Schools Statewide School District Ranking 2015".
- ↑ Pittsburgh Business Times (April 11, 2014). "What makes up a district's School Performance Profile score?".
- ↑ Pittsburgh Business Times (April 11, 2014). "Western Pennsylvania School Guide 2014".
- ↑ "Statewide Honor Roll Rankings 2013". Pittsburgh Business Times. April 5, 2013.
- ↑ Pittsburgh Business Times, Statewide Honor Roll Rankings 2012, April 4, 2012
- ↑ "Three of top school districts in state hail from Allegheny County". Pittsburgh Business Times. May 23, 2007.
- ↑ Pennsylvania Department of Education (September 21, 2012). "Northern Cambria School District AYP Overview 2012".
- ↑ Pennsylvania Department of Education (September 21, 2012). "About Adequate Yearly Progress (AYP) in Pennsylvania".
- ↑ Pennsylvania Department of Education, Pennsylvania Public School District AYP History, 2011
- ↑ Pennsylvania Department of Education, Pennsylvania District AYP History 2003-2010, 2011
- ↑ PDE, Graduation rate by LEA, 2014
- ↑ PDE, Graduation rate by LEA, 2013
- ↑ Pennsylvania Department of Education (September 21, 2012). "Northern Cambria School District AYP Data Table 2012".
- ↑ Pennsylvania Department of Education, School District AYP Data Table 2011, September 29, 2011
- ↑ Pennsylvania Department of Education (March 15, 2011). "New 4-year Cohort Graduation Rate Calculation Now Being Implemented".
- ↑ The Times-Tribune (June 27, 2010). "PA School District Statistical Snapshot Database 2008-09".
- ↑ The Times-Tribune (June 25, 2009). "County School Districts Graduation Rates 2008".
- ↑ Pennsylvania Partnerships for Children (2008). "High School Graduation rate 2007" (PDF).
- ↑ Pennsylvania Department of Education (December 4, 2014). "Northern Cambria High School Fast Facts 2014".
- ↑ National Center for Education Statistics, Common Core Data - Northern Cambria High School, 2013
- ↑ Pennsylvania Department of Education, Professional Qualifications of Teachers Northern Cambria High School 2012, September 21, 2012
- ↑ Northern Cambria School Board Secretary (April 20, 2010). "Minutes April 2010 Board Meeting" (PDF).
- ↑ Pennsylvania Department of Education (November 6, 2014). "Northern Cambria High School Academic Performance Data 2014".
- ↑ Evamarie Socha (November 6, 2014). "Half of Valley districts see state test scores decline". The Daily Item.
- ↑ Eleanor Chute (November 21, 2014). "Pennsylvania student scores declined with reduced funding, test results show". Pittsburgh Post-Gazette.
- ↑ Acting Secretary of Education Carolyn Dumaresq, Acting Secretary of Education Announces Results of 2013-14 School Performance Profile; Strong Performance in 72 Percent of Schools, November 6, 2014
- ↑ Kathy Boccella; Dylan Purcell & Kristen A. Graham (November 6, 2014). "Pa. school rankings: Downingtown STEM No. 1; Phila. falters". Philadelphia Inquirer.
- ↑ Jan Murphy (November 6, 2014). "More Pa. school scores decline than improve, state report card shows". Pennlive.com.
- ↑ Northern Cambria School Board Secretary (October 15, 2013). "Northern Cambria School Board Meeting minutes" (PDF).
- ↑ Pennsylvania Department of Education, Northern Cambria High School Academic Performance Data 2013, October 4, 2013
- ↑ Eleanor Chute & Mary Niederberger (December 11, 2013). "New assessment shows fuller picture of Pa. schools". Pittsburgh Post-Gazette.
- ↑ Pennsylvania Department of Education (September 21, 2012). "Northern Cambria High School AYP Overview 2012".
- ↑ Pennsylvania Department of Education, Northern Cambria High School Academic Report Card 2011, September 29, 2011
- ↑ Pennsylvania Department of Education (2014). "State Academic Standards".
- ↑ Pennsylvania Department of Education (2014). "State Assessment System".
- ↑ Pennsylvania Department of Education (September 29, 2012). "2011-2012 PSSA and AYP Results".
- ↑ Pennsylvania Department of Education (September 29, 2011). "2010-2011 PSSA and AYP Results".
- ↑ Pennsylvania Department of Education (2010). "2009-2010 PSSA and AYP Results".
- ↑ The Times-Tribune (September 14, 2009). "Grading Our Schools database, 2009 PSSA results".
- ↑ Pennsylvania Department of Education (August 15, 2008). "2007-2008 PSSA and AYP Results".
- ↑ Pennsylvania Department of Education (2007). "PSSA Math and Reading results".
- ↑ Pittsburgh Post Gazette (October 15, 2012). "How is your school doing?".
- ↑ Pennsylvania Department of Education, Northern Cambria High School Academic Achievement Report Card 2011, September 29, 2011
- ↑ Pennsylvania Department of Education, Northern Cambria High School Academic Achievement Report Card 2010, October 20, 2010
- ↑ Pennsylvania Department of Education, Northern Cambria High School Academic Achievement Report Card 2009, September 14, 2009
- ↑ Pennsylvania Department of Education, Northern Cambria High School Academic Achievement Report Card 2008, August 15, 2008
- ↑ Pennsylvania Department of Education, Northern Cambria High School Academic Achievement Report Card, 2007
- ↑ Pennsylvania Department of Education (September 21, 2012). "Northern Cambria High School Academic Achievement Report Card 2012" (PDF).
- ↑ Pennsylvania Department of Education (September 29, 2011). "2010-2011 PSSA results in Science".
- ↑ The Times-Tribune (2009). "Grading Our Schools database, 2009 Science PSSA results".
- ↑ Pennsylvania Department of Education (2008). "Report on PSSA Science results by school and grade 2008".
- ↑ Jan Murphy (January 30, 2009). "Report: One-third of local high schoolers unprepared for college". Pennlive.com.
- ↑ Pennsylvania Department of Education (January 20, 2009). "Pennsylvania College Remediation Report 2009".
- ↑ National Center for Education Statistics, IPEDS Integrated Postsecondary Education Data System, 2008
- ↑ Achieve.org (2014). "THE VALUE OF THE COLLEGE- AND CAREER-READY AGENDA IN PENNSYLVANIA" (PDF).
- ↑ Pennsylvania Department of Education, Dual Enrollment Guidelines, 2010
- ↑ Commonwealth of Pennsylvania (March 2010). "Pennsylvania Transfer and Articulation Agreement".
- ↑ Pennsylvania Department of Education (2010). "Dual Enrollment Guidelines".
- ↑ Northern Cambria School Board, Northern Cambria High School Course Descriptions 2015, 2015
- ↑ Pennsylvania State Board of Education. "Pennsylvania Code §4.24 (a) High school graduation requirements".
- ↑ Pennsylvania State Board of Education, Proposed changes to Chapter 4, May 10, 2012
- ↑ Pennsylvania Department of Education (2010). "Keystone Exam Overview" (PDF).
- ↑ Megan Harris (September 12, 2013). "Pennsylvania changing high school graduation requirements". Tribune Live.
- ↑ Pennsylvania Department of Education (September 2011). "Pennsylvania Keystone Exams Overview".
- ↑ Pennsylvania State Board of Education (2010). "Rules and Regulation Title 22 PA School Code CH. 4".
- ↑ Pennsylvania Department of Education, State Board of Education Finalizes Adoption of Pennsylvania Common Core State Academic Standards and High School Graduation Requirements, March 14, 2013
- ↑ Pennsylvania Department of Education (2011). "Keystone Exams".
- ↑ PDE, School Performance profile Northern Cambria High School, November 6, 2014
- ↑ Pennsylvania Department of Education (2014). "SAT and ACT Scores".
- ↑ College Board (2014). "2014 College-Bound Seniors State Profile Report" (PDF).
- ↑ College Board (2013). "The 2013 SAT Report on College & Career Readiness".
- ↑ Pennsylvania Department of Education (2011). "Public School SAT Scores 2011".
- ↑ College Board (September 15, 2011). "SAT Scores State By State - Pennsylvania".
- ↑ "While U.S. SAT scores dip across the board, N.J. test-takers hold steady". NJ.com. September 15, 2011.
- ↑ The Center for Rural Pennsylvania (August 2006). "SAT Scores and Other School Data".
- ↑ College Board (2014). "Exam Fees and Reductions: 2015".
- ↑ Northern Cambria School District Administration, Advanced Placement Courses information for Parents and Students, 2015
- ↑ PDE, School Performance Profile - Academic Performance Data - Northern Cambria High School, December 2014
- ↑ Ted Potts (August 24, 2007). "New programs await back-to-school students". The Tribune-Democrat.
- ↑ Pennsylvania Department of Education (November 6, 2014). "Northern Cambria Middle School Fast Facts 2014".
- ↑ Pennsylvania Department of Education, Professional Qualifications of Teachers Northern Cambria Middle School, November 6, 2014
- ↑ National Center for Education Statistics, Common Core Data – Northern Cambria Middle School, 2012
- ↑ Pennsylvania Department of Education (November 6, 2014). "Northern Cambria Middle School Academic Performance Data 2014".
- ↑ PDE, Northern Cambria Middle School Academic Performance Data 2013, October 4, 2013
- ↑ Pennsylvania Department of Education (September 21, 2012). "Northern Cambria Middle School AYP Overview 2012".
- ↑ Pennsylvania Department of Education, Northern Cambria Middle School AYP Overview 2010, October 20, 2010
- ↑ Pennsylvania Department of Education, Northern Cambria Middle School AYP Overview 2009, September 14, 2009
- ↑ Pennsylvania Department of Education, Northern Cambria Middle School AYP Overview 2008, August 15, 2008
- ↑ US Department of Education (2003). "NCLB Parental Notices".
- ↑ Pennsylvania Department of Education, Northern Cambria Middle School AYP Overview 2007, 2007
- ↑ Pennsylvania Department of Education. "IU16-PSSA 95-96 Results by School". Retrieved May 11, 2014.
- ↑ Pennsylvania Department of Education (2014). "Standards Aligned Systems".
- ↑ Pennsylvania Department of Education (2014). "State Academic Standards".
- ↑ Pennsylvania Department of Education (2014). "State Academic Standards Mathematics".
- ↑ Pittsburgh Post Gazette (October 15, 2012). "How is your school doing?".
- ↑ The Times-Tribune (2011). "Grading Our Schools database, 2010-11 Reading PSSA results".
- ↑ Pennsylvania Department of Education (August 15, 2008). "Reading and Math PSSA 2008 by Schools".
- ↑ Pennsylvania Department of Education (September 21, 2012). "Northern Cambria Middle School Academic Achievement Report Card 2012" (PDF).
- ↑ The Times-Tribune (2010). "Grading Our Schools database, 2009-10 PSSA results".
- ↑ Pennsylvania Department of Education (2009). "2009 PSSAs: Reading, Math, Writing and Science Results".
- ↑ The Times-Tribune (2012). "Grading Our Schools database, 2011-12 Science PSSA results".
- ↑ Pennsylvania Department of Education Report (August 2010). "Science PSSA 2010 by Schools".
- ↑ Pennsylvania Department of Education Report (August 2009). "Science PSSA 2009 by Schools".
- ↑ Pennsylvania Department of Education Report (August 15, 2008). "Science PSSA 2008 by Schools".
- ↑ Pennsylvania Department of Education, Northern Cambria Middle School Academic Achievement Report Card 2011, September 29, 2011
- ↑ Pennsylvania Department of Education, Northern Cambria Middle School Academic Achievement Report Card 2010, October 20, 2010
- ↑ Pennsylvania Department of Education, Northern Cambria Middle School Academic Achievement Report Card 2009, September 14, 2009
- ↑ Pennsylvania Department of Education, Northern Cambria Middle School Academic Achievement Report Card 2008, August 15, 2008
- ↑ Pennsylvania Department of Education, Northern Cambria Middle School Academic Achievement Report Card 2007, 2007
- ↑ Office of First Lady (September 2, 2014). "Pennsylvania First Lady and Acting Secretary of Education Announce 35 Schools Statewide Implementing Dropout Program".
- ↑ Pennsylvania Department of Education (2014). "The Early Warning System".
- ↑ Pennsylvania Department of Education (November 6, 2014). "Northern Cambria Elementary School Fast Facts 2014".
- ↑ Pennsylvania Department of Education, School Performance Profile, Northern Cambria Elementary School Fast Facts, 2014
- ↑ National Center for Education Statistics, Common Core Data – Northern Cambria Elementary School, 2013
- ↑ Pennsylvania Partnership for Children, Full-Day Kindergarten Enrollment, 2010
- ↑ Pennsylvania Department of Education (November 6, 2014). "Northern Cambria Elementary School Academic Performance Data 2014".
- ↑ PDE, Northern Cambria Elementary School Academic Performance Data 2013, October 4, 2013
- ↑ Pennsylvania Department of Education (September 21, 2012). "Northern Cambria Elementary School AYP Overview 2012".
- ↑ Pennsylvania Department of Education, Elementary School AYP Overview 2011, September 29, 2011
- ↑ Pennsylvania State Board of Education (2003). "PSSA results 2003".
- ↑ New America Foundation (2003). "No Child Left Behind Overview".
- ↑ The Goals of No Child Left Behind (July 20, 2010). "The Goals of No Child Left Behind".
- ↑ Learning Point Associates (2002). "Understanding the No Child Left Behind Act" (PDF).
- ↑ Pennsylvania State Board of Education (January 11, 2003). "Pennsylvania Academic Standards Science and Technology, Ecology and Environment".
- ↑ Pennsylvania Department of Education (September 21, 2012). "Northern Cambria Elementary School Report Card 2012" (PDF).
- ↑ Pennsylvania Department of Education, Northern Cambria Elementary School Report Card 2011, September 29, 2011
- ↑ Pennsylvania Department of Education, Northern Cambria Elementary School Report Card 2010, October 20, 2010
- ↑ Pennsylvania Department of Education, Northern Cambria Elementary School Report Card 2009, September 14, 2009
- ↑ Pennsylvania Department of Education, Northern Cambria Elementary School Report Card 2008, August 15, 2008
- ↑ Pennsylvania Department of Education, Northern Cambria Elementary School Report Card 2007, 2007
- ↑ Pittsburgh Post Gazette (October 15, 2012). "How is your school doing?".
- ↑ Pennsylvania Department of Education (January 2010). "School District Enrollment Data and Projections".
- ↑ Fenton, Jacob., Pennsylvania School District Data: Will School Consolidation Save Money?, The Morning Call, February 2009
- ↑ Pennsylvania Legislative Budget & Finance Committee (2007). "Study of the Cost-Effectiveness of Consolidating Pennsylvania School Districts" (PDF).
- ↑ Edward Rendell; Governor and Mary Soderberg; Secretary of the Budget. (February 2009). "2009–10 Executive Budget Facts Pennsylvania School District Consolidation".
- ↑ Murphy, Jan, (February 4, 2009). "Rendell calls for consolidation of state school districts". The Patriot News.
- ↑ "Report of the Fiscal Responsibility Task Force" (PDF). Retrieved April 2011. Check date values in:
|access-date=(help) - ↑ The Center for Rural Pennsylvania. (October 2009). "Research Analyzes Rural School District Enrollment and Building Capacity" (PDF).
- ↑ Pennsylvania Department of Health, Birth Age County Reports 1990 and 2011, 2011
- ↑ Pennsylvania Department of Health, Health Statistics - Resident Live Birth rate by county, 1990
- ↑ Pennsylvania Department of Health, Health Statistics - Resident Live Birth rate by county, 2000
- ↑ Pennsylvania Department of Health, Health Statistics - Resident Live Birth rate by county, 2013
- ↑ Center for Rural Pennsylvania, Number of Children Decreasing, Number of Seniors Increasing in Rural Pennsylvania, July 2011
- ↑ Pennsylvania Department of Health, Birth Statistics, 2013
- ↑ Adam Smeltz & Richard Gazarik (December 28, 2013). "Distrust of government keeps school district consolidations at bay". Triblive.
- ↑ 2009–2010 Executive Budget Fast Facts. Pennsylvania Office of the Governor, 2010
- ↑ Standard & Poor's School Evaluation Services. (2007). "Study of the cost-effectiveness of consolidating Pennsylvania districts Part 1".
- ↑ Pennsylvania Bureau of Special Education Services (2013–2014). "Northern Cambria School District Special Education Data Report LEA Performance on State Performance Plan (SPP) Targets".
- ↑ Pennsylvania Department of Education, Testimony Hearing on Special Education Senate Republican Policy Committee, January 2013
- ↑ Gerald L. Zahorchak, D. Ed. (May 30, 2007). "House Education Committee Hearing on Governor's Proposed Increase for Accountability Block Grants Testimony for Gerald L. Zahorchak, D. Ed. Secretary, Pennsylvania Department of Education" (PDF).
- ↑ Pennsylvania Bureau of Special Education (2008). "Pennsylvania Parent Guide to Special Education Services" (PDF).
- ↑ Pennsylvania Department of Education - School District Administration (January 6, 2011). "Procedural Safeguards Notice".
- ↑ Pennsylvania Department of Education, Bureau of Special Education (September 2005). "Gaskin Settlement Agreement Overview Facts Sheet" (PDF).
- ↑ Northern Cambira School District Special, Education Department (July 2014). "Special Education Plan Report" (PDF).
- ↑ Eleanor Chute., Modified PSSA test in math offered for 1st time, Pittsburgh Post-Gazette, April 18, 2010
- ↑ "PSSA and Keystone Exam Accommodation Guidelines for Students with IEPs and 504 Plans". 2015.
- ↑ Pennsylvania Department of Education (December 12, 2014). "PSSA/ Keystone Accommodations Guidelines (PDE) 2015".
- ↑ Pennsylvania Department of Education. "Pennsylvania Special Education Funding".
- ↑ Browne, Patrick., Senate Education Committee Hearing on Special Education Funding & Accountability testimony, November 1, 2011
- ↑ Kintisch, Baruch., Public Hearing: Special Education Funding & Accountability Testimony, Education Law Center, November 11, 2011
- ↑ Amy Morton, Executive Deputy Secretary, Public Hearing: Special Education Funding & Accountability Testimony, Pennsylvania Department of Education, November 11, 2011
- ↑ US Department of Education (January 25, 2013). "U.S. Department of Education Clarifies Schools' Obligation to Provide Equal Opportunity to Students with Disabilities to Participate in Extracurricular Athletics".
- ↑ Pennsylvania Department of Education (July 2010). "Special Education Funding from Pennsylvania State_2010-2011".
- ↑ Pennsylvania Department of Education (2011). "Special Education Funding 2011-2012 Fiscal Year".
- ↑ Pennsylvania Department of Education (April 2012). "Investing in PA kids,".
- ↑ Pennsylvania Department of Education, Special Education funding report by LEA, July 2014
- ↑ Pennsylvania Department of Education (July 2010). "Gifted Students as Percentage of Total Enrollment by School District/Charter School" (PDF).
- ↑ Pennsylvania Department of Education and Pennsylvania School Board. "CHAPTER 16. Special Education For Gifted Students". Retrieved February 4, 2011.
- ↑ Pennsylvania Department of Education (March 26, 2010). "Special Education for Gifted Students Notice of Parental rights" (PDF).
- ↑ Pennsylvania General Assembly, Taxpayer Relief Act, Act 1 of the Special Session of 2006, June 27, 2006
- ↑ Northern Cambria School Board (2014). "Northern Cambria School District employment contract with the Northern Cambria Teachers union" (PDF).
- ↑ Pennsylvania Department of Education, Investing in Pennsylvania Students2013, 2013
- ↑ Pennsylvania Department of Education, Northern Cambria School District Fast Facts Financial Information 2014, 2014
- ↑ "Northern Cambria School District Payroll report 2013". OpenPA Gov.org. 2014.
- ↑ Times Tribune (June 16, 2013). "PA Teacher Profile Database 2011-12".
- ↑ Pennsylvania School Employees Retirement System (2014). "Your PSERS Benefits & Leaving Employment".
- ↑ American Enterprise Institute, (2011). "Assessing the Compensation of Public School Teachers".
- ↑ Asbury Park Press (2009). "PA. Public School Salaries".
- ↑ Northern Cambria School Board (2007). "Northern Cambria School District Teacher Union Employment Contract 2010".
- ↑ PA Delaware County Times, Teachers need to know enough is enough, April 20, 2010.
- ↑ Fenton, Jacob., Pennsylvania School District Data: Will School Consolidation Save Money?, The Morning Call, February 2009
- ↑ Pennsylvania School Board Association (October 2009). "Public School Salaries 11th Annual".
- ↑ Kelly Cernetich (May 4, 2014). "Northern Cambria School District official's workload concerns board". Altoona Mirror.
- ↑ Pennsylvania Department of Education (2010). "2009-10 Selected Data - 2009-10 Total Expenditures per ADM".
- ↑ Pennsylvania Department of Education (2014). "2012-13 Selected Data - 2012-13 Total Expenditures per ADM".
- ↑ US Census Bureau, States Ranked According to Per Pupil Public Elementary-Secondary School System Finance Amounts: Fiscal Year 2011, May 2013
- ↑ US Census Bureau (2009). "Total and current expenditures per pupil in fall enrollment in public elementary and secondary education, by function and state or jurisdiction: 2006-07".
- ↑ US Census Bureau (March 2003). "Public Education Finances 2000-01 Annual Survey of Local Government Finances" (PDF).
- ↑ US Census Bureau (2009). "Total and current expenditures per pupil in fall enrollment in public elementary and secondary education, by function and state or jurisdiction: 2006-07".
- ↑ United States Census Bureau (2009). "States Ranked According to Per Pupil Elementary-Secondary Public School System Finance Amounts: 2008-09" (PDF).
- ↑ US Census Bureau (May 2013). "States Ranked According to Per Pupil Public Elementary-Secondary School System Finance Amounts: Fiscal Year 2011" (PDF).
- ↑ Pennsylvania Department of Education, (2008). "General Reserved Fund Balance by School District 1996-2008".
- ↑ Murphy, Jan., Pennsylvania's public schools boost reserves, CentreDaily Times, September 22, 2010
- ↑ John Baer (December 9, 2013). "Pa. schools and $$ behind the curtain". Philadelphia Daily News.
- ↑ Melissa Daniels (June 1, 2013). "PA school districts look to cash stash to balance budgets". PA Independent.
- ↑ Jan Murphy (August 18, 2014). "School district reserves rise despite $1 billion cut in aid". Pennlive.com.
- ↑ Commonwealth Foundation (May 17, 2012). "Chart: School District Fund Balances Nearly Tripled in 14 Years".
- ↑ PDE, Finances General Fund Balance 1196-2012-13, 2014
- ↑ Northern Cambria School Board Secretary (September 3, 2002). "School Board Meeting Minutes" (PDF).
- ↑ SANDRA K. REABUCK (July 14, 2009). "Tax-sale properties listed". The Tribune-Democrat.
- ↑ Pennsylvania Auditor General (January 2014). "Northern Cambria School District County, Pennsylvania Performance Audit Report" (PDF).
- ↑ Jack Wagner; PA Auditor General (August 2010). "Northern Cambria School District Performance Audit" (PDF).
- ↑ Pennsylvania Department of Education (May 2013). "Pennsylvania Public School District Tuition Rates".
- ↑ Pennsylvania of Community & Economic Development (2012). "Earned Income Tax".
- ↑ Penn State Cooperative Extension (2010). "What are the Local Taxes in Pennsylvania?, Local Tax Reform Education Project" (PDF).
- ↑ Pennsylvania Department of Revenue (April 2010). "Personal Income Taxation Guidelines".
- ↑ John Finnerty (2013). "PA teachers pensions". CNHI Harrisburg Bureau.
- ↑ Pennsylvania Representative Todd Stephens (January 23, 2014). "LEEF Funding Chart 2014".
- ↑ JANICE BISSETT & ARNOLD HILLMAN (2006). "A Summary of the History and Financing of Education in Pennsylvania 1682- 2013" (PDF). PA Association of Rural and Small Schools.
- ↑ PDE (July 7, 2014). "Enacted Education Budget 2014-2015".
- ↑ Pennsylvania Department of Education, 2014-15 Enacted Education Budget Fast Facts, July 14, 2014
- ↑ Democrat Appropriations Committee, Report on Education funding by LEA, July 2, 2013
- ↑ Sam Wood & Brian X. McCrone (January 29, 2014). "Montgomery County lawmaker proposes using Pa. horse racing funds for education". Philadelphia Inquirer.
- ↑ Pennsylvania Office of the Budget, 2013-14 State Budget Highlights, 2013
- ↑ Senator Jake Corman (June 28, 2012). "Pennsylvania Education funding by Local School District" (PDF).
- ↑ Pennsylvania General Assembly Sen Jake Corman (June 29, 2012). "SB1466 of 2012 General Fund Appropriation".
- ↑ PA Senate Appropriations Committee (June 28, 2011). "School District 2011-12 Funding Report".
- ↑ Pennsylvania Department of Education (July 2011). "Basic Education Funding".
- ↑ Pennsylvania Department of Education (June 30, 2011). "Basic Education Funding".
- ↑ Pennsylvania Department of Education (June 30, 2011). "Basic Education Funding 2011-2012 Fiscal Year".
- ↑ Pennsylvania Department of Education, District Allocations Report 2009, 2009-10
- ↑ Pennsylvania House Appropriations Committee (June 30, 2010). "PA Basic Education Funding-Printout2 2010-2011" (PDF).
- ↑ Office of the Budget (February 2010). "Pennsylvania Budget Proposal 2010".
- ↑ Pennsylvania Department of Education (October 2009). "Funding Allocations by district 2009-10".
- ↑ Pennsylvania Office of Budget (February 2009). "Governor's Budget Proposal 2009 Pennsylvania Department of Education Budget Proposal 2009".
- ↑ Pennsylvania Department of Education, Funding Report by LEA, 2009
- ↑ U.S. Census Bureau., Annual Survey of Local Government Finances., 2000
- ↑ U.S. Census Bureau., 2008 Survey of Local Government Finances – School Systems, 2010
- ↑ Governor's Budget Office (2014). "Past Budgets 2013-14 to 2006-07".
- ↑ State Senator Lloyd Smucker Senate Education Committee Chairperson, PCNTV Interview state education Budget, June 2015
- ↑ Pennsylvania Department of Education, Accountability Block Grant report Grantee list 2010, October 2010
- ↑ Pennsylvania Department of Education (2008). "Accountability Block Grant Mid Year report".
- ↑ Pennsylvania Partnership for Children, Full-Day Kindergarten Enrollment, 2011
- ↑ Pennsylvania Department of Education (2013). "Passport for Learning Block Grant".
- ↑ Pennsylvania Department of Education, Pennsylvania 2013-14 Pre-K Counts Grantees 2013-13, August 2013
- ↑ Pennsylvania Department of Education Early Childhood Advisor, Poverty Level by School District, 2007
- ↑ Office of Child Development and Early Learning (2011). "Pre-K Counts Grantees".
- ↑ Pennsylvania Department of Education - Office of Child Development and Early Learning (2008). "Applicants of PA Pre-K Counts for FY 2008-2009" (PDF).
- ↑ Governor's Press Office (August 10, 2007). "Governor Rendell Announces Grants for 'Pre-K Counts' Early Childhood Initiative".
- ↑ Pennsylvania Department of Education (2010). "Pennsylvania PreK Counts End of Year Report 2009-10" (PDF).
- ↑ Office of Child Development and Early Learning (2009). "Early Childhood Programs - PreK Counts".
- ↑ Office of Child Development and Early Learning (2012). "Pre-K Counts Report on Program Operations For Fiscal Year 2011-12".
- ↑ Claudio Sanchez (April 22, 2014). "What Exactly Is 'High-Quality' Preschool?". NPR.org.
- ↑ Jan Murphy (December 19, 2013). "Corbett: What Pa. will do with $51.7 million early learning grant "nothing short of amazing"". Patriot News.
- ↑ US Department of Education (December 19, 2013). "Six States Awarded Race to the Top-Early Learning Challenge (RTT-ELC) Grants to Build Statewide Systems of High-Quality Early Learning".
- ↑ Northern Cambria School Board Secretary (July 15, 2008). "Northern Cambria School Board Meeting minutes".
- ↑ Pennsylvania Auditor General (December 22, 2008). "Classrooms for the Future grants audit".
- ↑ Pennsylvania Office of the Governor press release (August 30, 2007). "Governor Rendell Announces 'Classrooms for the Future' Schools".
- ↑ Northern Cambria School Board Secretary (August 18, 2008). "Northern Cambria School Board Meeting minutes" (PDF).
- ↑ Cynthia Pulkowski Director; Science: It’s Elementary (2009). "Science Its Elementary 2008-2009" (PDF).
- ↑ Pennsylvania Department of Education, Science: It’s Elementary Grantees Students in 143 Schools Benefit from Intensive Science Curriculum, July 22, 2008
- ↑ Patricia Vathis Pennsylvania Department of Education, Grants and Subsidies Science: It’s Elementary, 2006
- ↑ Pennsylvania Department of Education, 2010-11 Science: It’s Elementary Application Guidelines, July 2010
- ↑ Press Office PDE (August 4, 2009). "Science its Elementary".
- ↑ Pennsylvania Department of Education, Educational Assistance Program Funding 2010-2011 Fiscal Year, 2010
- ↑ Pennsylvania Department of Education Press Office (October 17, 2013). "Acting Secretary of Education Says Hybrid Learning Benefits Students; Highlights Success of First-Year Pilot Program".
- ↑ Pennsylvania Department of Education press release, Governor Corbett Announces $633,000 in Hybrid Learning Grants to 34 School Entities, May 28, 2013
- ↑ Department of Environmental Protection (2014). "Environmental Education Grants".
- ↑ Pennsylvania Department of Environmental Protection (April 22, 2013). "Governor Corbett Awards 92 Grants for Environmental Education and Stewardship".
- ↑ Pennsylvania Department of Education (May 23, 2012). "Pennsylvania Awards $36.1 Million to Strengthen Literacy Programs".
- ↑ Commonwealth of Pennsylvania, Cambria County ARRA FUNDING Report, 2009
- ↑ ProPublica (2009). "Recovery Tracker Eye on the stimulus".
- ↑ "School stimulus money". Pittsburgh Post-Gazette. March 12, 2009.
- ↑ Pennsylvania Department of Education, Race To The Top Webinar powerpoint for districts December 2009, December 9, 2009
- ↑ Governor's Press Office release (January 20, 2010). "Pennsylvania's 'Race to the Top' Fueled by Effective Reforms, Strong Local Support,".
- ↑ Race to the Top Fund, U.S. Department of Education, March 29, 2010.
- ↑ Gerald Zahorchak (December 2008). "Pennsylvania Race to the Top Letter to Superintendents" (PDF).
- ↑ Pennsylvania Department of Education (January 19, 2009). "Pennsylvania Race to the Top -School Districts Title I Allocations 2009-10".
- ↑ Governor Office Press release (March 12, 2008). "PA Education Department Announces 39 Districts to Take Part in 'Common Cents' Cost-Saving".
- ↑ Pennsylvania Department of Education, Common Cents program - Making Every Dollar Count, 2007
- ↑ PA General Assembly Task Force on School Cost Reduction (November 16, 2006). "Final Report Task Force on School Cost Reduction Findings and Recommendations".
- ↑ PDE (October 2014). "Finances RE Tax Rates 2014-15".
- ↑ Pennsylvania Department of Education (2012). "Real Estate Tax Rates by School District 2012-13 Real Estate Mills".
- ↑ Pennsylvania Department of Education (2004). "Act 511 Tax Report".
- ↑ State Tax Equalization Board (2011). "State Tax Equalization Board About US".
- ↑ Pennsylvania Auditor General office - Bureau of Audits (February 2011). "A Special Performance Audit of the Pennsylvania State Tax Equalization Boards" (PDF).
- ↑ Pennsylvania Department of Education (2014). "Real Estate Tax Rates by School District 2013-14 Real Estate Mills".
- ↑ Pennsylvania Department of Education, Finances_Real Estate Tax Rates 2012-13, 2012
- ↑ Pennsylvania Department of Education (2011). "Real Estate Tax Millage by School District,".
- ↑ Pennsylvania Department of Education (2010). "Real Estate Tax Millage by School District,".
- ↑ Pennsylvania Department of Education, Financial Elements Reports, 2010
- ↑ Pennsylvania Department of Education, Financial Elements Reports 2008-09 Real Estate Mills, 2009
- ↑ Pennsylvania Department of Education, Real Estate Tax Millage by School District, 2008
- ↑ Pennsylvania Department of Education, Real Estate Tax Millage by School District, 2006
- ↑ Pennsylvania Department of Education, Real Estate Tax Millage by School District, 2005
- ↑ Tax-rates.org., The 2015 Tax Resource County Property Taxes 2014, 2015
- ↑ Pennsylvania Department of Education, Pennsylvania School Finances - Summaries of Annual Financial Report Data 2010-11, 2011
- ↑ New Census Data on Property Taxes on Homeowners, Tax Foundation, September 22, 2009.
- ↑ Tax Foundation, The facts on Pennsylvania’s Tax Climate, January 2015
- ↑ Pennsylvania Department of Education (2010). "2010-11 Act 1 of 2006 Referendum Exception Guidelines".
- ↑ Kaitlynn Riely (August 4, 2011). "Law could restrict school construction projects". Pittsburgh Post-Gazette.
- ↑ Pennsylvania General Assembly (June 29, 2011). "SB330 of 2011".
- ↑ Eric Boehm (July 1, 2011). "Property tax reform final piece of state budget". PA Independent.
- ↑ Pennsylvania Department of Education (2011). "Special Session Act 1 of 2006 the Taxpayer Relief Act information".
- ↑ Pennsylvania Department of Education (May 2011). "Special Session Act 1 of 2006 School District Adjusted Index for 2006-2007 through 2011-2012".
- ↑ Pennsylvania Department of Education, 2012-2013 School District Adjusted Index, September 2011
- ↑ Pennsylvania Department of Education, 2013-2014 School District Adjusted Index, September 2012
- ↑ Pennsylvania Department of Education, 2014-2015 School District Adjusted Index, September 2013
- ↑ Pennsylvania Department of Education, 2015-2016 School District Adjusted Index, September 2014
- ↑ Pennsylvania School Employees, Retirement System, PSERS Chart showing payment mandates 2007-2020, 2014
- ↑ Pennsylvania Department of Education (April 30, 2014). "Report on Referendum Exceptions For School Year 2014-2015".
- ↑ Pennsylvania Department of Education, Report on Referendum Exceptions For School Year 2013-2014, April 2013
- ↑ Pennsylvania Department of Education, Report on Referendum Exceptions For School Year 2012-2013, March 30, 2012
- ↑ Pennsylvania Department of Education (May 1, 2014). "2014-2015 Estimated State Property Tax Relief per Homestead".
- ↑ Pennsylvania Gaming Control Board (2014). "Gaming Benefits for Pennsylvanians".
- ↑ Pennsylvania Department of Education (May 1, 2009). "2009 Estimated State Property Tax Relief per Homestead".
- ↑ Pennsylvania Department of Education, Tax Relief per Homestead, May 1, 2009.
- ↑ Tax Relief per Homestead 2009, Pennsylvania Department of Education Report, May 1, 2009
- ↑ AP (September 14, 2014). "Casino revenue has not provided level of tax relief promised to Pa. property owners". Pennlive.com.
- ↑ Pennsylvania Office of the Auditor General, Jack Wagner (February 2010). "Property Tax Relief in Pennsylvania Special Report," (PDF).
- ↑ Penn State College of Agricultural Sciences Cooperative Extension (1998). "Understanding the Homestead and Farmstead Exclusions" (PDF).
- ↑ Department of Revenue (2014). "Property Tax/Rent Rebate Program".
- ↑ Pennsylvania Department of Revenue., Property Tax/Rent Rebate Program, June 2012
- ↑ Northern Cambria School Board (May 16, 2006). "Policy Manual Student Wellness Policy 246" (PDF).
- ↑ Probart C, McDonnell E, Weirich JE, Schilling L, Fekete V (September 2008). "Statewide assessment of local wellness policies in Pennsylvania public school districts.". J Am Diet Assoc. 108 (9): 1497–502. doi:10.1016/j.jada.2008.06.429. PMID 18755322.
- ↑ Pennsylvania Department of Education – Division of Food and Nutrition (July 2008). "Nutrition Standards for Competitive Foods in Pennsylvania Schools for the School Nutrition Incentive".
- ↑ USDA, Child Nutrition Programs - Eligibility Manual for School Meals, 2012
- ↑ Pennsylvania Hunger Action Center, The Pennsylvania School Breakfast Report Card, 2009
- ↑ Faith Swanson (2015). "Seamless Summer Meal Program Notice" (PDF).
- ↑ USDA, Child Nutrition Programs, June 27, 2013
- ↑ United States Department of Agriculture (2011). "Food and Nutrition Service Equity in School Lunch Pricing Fact Sheet" (PDF).
- ↑ Denver Nicks (February 25, 2014). "White House Sets New Limits on Junk Food Ads in Schools". Time Magazine.
- ↑ USDA Food and Nutrition Service (2014). "School Meals FAQ".
- ↑ Monica Eng (November 26, 2012). "Lactose intolerance: When drinking school milk makes students feel sick". Chicago Tribune.
- ↑ Pennsylvania State Department of Health (2010). "Pennsylvania Bulletin Doc. No. 10-984 School Immunizations; Communicable and Noncommunicable Diseases".
- ↑ Pennsylvania Department of Health (2014). "School Immunization Requirements".
- ↑ Pennsylvania Department of Health (2014). "Mandated School Health Screenings".
- ↑ Highmark Foundation, 2014 School Challenge Grants, 2014
- ↑ Highmark Foundation, 2011 School Challenge Grants, 2011
- ↑ Pennsylvania Department of Education (2013). "Disclosure of Interscholastic Athletic Opportunities".
- ↑ Pennsylvania Office of the Governor Press Release (November 10, 2005). "Home-Schooled, Charter School Children Can Participate in School District Extracurricular Activities".
- ↑ Eleanor Chute., New Pa. law expands clearance requirements for school volunteers, employees, Pittsburgh Post-Gazette, December 15, 2014
- ↑ Pennsylvania General Assembly (2014). "ACT 126 – Child Abuse Recognition and Reporting Act".
- ↑ Ali Stevens., Child Protective Services Law impacts schools, WKOK.com 1070AM, January 6, 2015
- ↑ Northern Cambria School Board, Northern Cambria School District Teacher Union Contract, 2014
- ↑ Pennsylvania Interscholastic Athletics Association (2015). "PIAA School Directory".
- ↑ Eric Knopsnyder (October 21, 2014). "Northern Cambria suspends wrestling program". The Tribune-Democrat.
- ↑ Northern Cambria School Board Secretary (April 14, 2015). "Special Board Meeting Minutes" (PDF).
- ↑ Tribune-Democrat Article - 2005 Volleyball State Championship. Retrieved on 2007-7-4.
- ↑ PA Hoops Best Players Under 5'10 from www.pahoops.org. Retrieved on 2007-7-4.
- ↑ Tribune-Democrat Article - 2006 Volleyball Season Review. Retrieved on 2007-7-4.
- ↑ Pittsburgh Post-Gazette Recap - 2004 Volleyball State Championships. Retrieved on 2007-7-4.
- ↑ Pittsburgh Post-Gazette Recap - 2003 Softball State Semifinals. Retrieved on 2007-7-4.
Municipalities and communities of Cambria County, Pennsylvania, United States | ||
|---|---|---|
| City |  | |
| Boroughs |
| |
| Townships | ||
| CDPs | ||
| Unincorporated communities | ||
| Footnotes | ‡This populated place also has portions in an adjacent county or counties | |