Northern Ireland general election, 1929
| | |||||||||||||||||||||||||||||||||||||||||||||||||||||||||||
| |||||||||||||||||||||||||||||||||||||||||||||||||||||||||||
| |||||||||||||||||||||||||||||||||||||||||||||||||||||||||||
|
| |||||||||||||||||||||||||||||||||||||||||||||||||||||||||||
| Percentage of seats gained by each of the party. | |||||||||||||||||||||||||||||||||||||||||||||||||||||||||||
| |||||||||||||||||||||||||||||||||||||||||||||||||||||||||||

 |
| This article is part of a series on the politics and government of Northern Ireland 1921–72 |
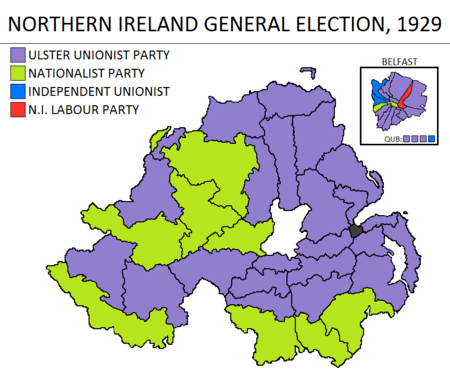
The Northern Ireland general election, 1929 was held on 22 May 1929. Like all previous elections to the Parliament of Northern Ireland, it produced a large majority for the Ulster Unionist Party. It was the first held after the abolition of proportional representation and the redrawing of electoral boundaries to create single-seat constituencies. As with the rest of the United Kingdom, this has made it more difficult for independent and minor party candidates to gain election.
Results
| Northern Ireland General Election 1929 | |||||||||||||||
|---|---|---|---|---|---|---|---|---|---|---|---|---|---|---|---|
| Candidates | Votes | ||||||||||||||
| Party | Standing | Elected | Gained | Unseated | Net | % of total | % | № | Net % | ||||||
| UUP | 43 | 37 | N/A | N/A | + 5 | 71.2 | 50.8 | 148,579 | -4.2 | ||||||
| Independent Unionist | 10 | 3 | N/A | N/A | - 1 | 5.8 | 14.3 | 41,778 | +5.3 | ||||||
| Nationalist | 11 | 11 | N/A | N/A | + 1 | 21.2 | 11.7 | 34,069 | -9.5 | ||||||
| NI Labour | 5 | 1 | N/A | N/A | - 2 | 1.9 | 8.0 | 23,334 | -2.8 | ||||||
| Liberal | 5 | 0 | N/A | N/A | 0 | N/A | 6.2 | 18,208 | N/A | ||||||
| Local Option | 3 | 0 | N/A | N/A | N/A | 3.3 | 9,776 | N/A | |||||||
| Town Tenants' Association | 2 | 0 | N/A | N/A | 0 | N/A | 2.4 | 6,901 | +1.5 | ||||||
| Independent Nationalist | 1 | 0 | N/A | N/A | 0 | N/A | 1.3 | 3,694 | N/A | ||||||
| Independent | 1 | 0 | N/A | N/A | 0 | N/A | 1.2 | 3,437 | N/A | ||||||
| Independent Labour | 2 | 0 | N/A | N/A | 0 | N/A | 0.8 | 2,442 | N/A | ||||||
Electorate: 775,307 (432,439 in contested seats); Turnout: 67.6% (292,218).
Votes summary
Seats summary
References
This article is issued from Wikipedia - version of the 11/6/2016. The text is available under the Creative Commons Attribution/Share Alike but additional terms may apply for the media files.