Northern Ireland general election, 1958
| | |||||||||||||||||||||||||||||||||||||||||||||||||||||||||||
| |||||||||||||||||||||||||||||||||||||||||||||||||||||||||||
| |||||||||||||||||||||||||||||||||||||||||||||||||||||||||||
|
| |||||||||||||||||||||||||||||||||||||||||||||||||||||||||||
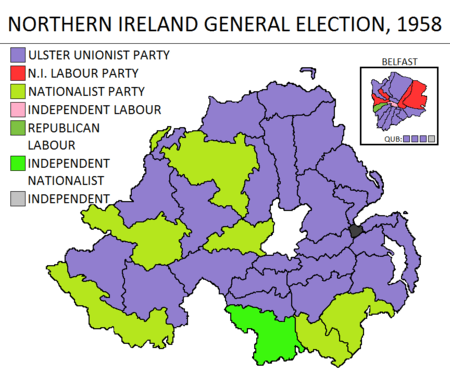
| Election results by constituency. | |||||||||||||||||||||||||||||||||||||||||||||||||||||||||||
| |||||||||||||||||||||||||||||||||||||||||||||||||||||||||||
 |
| This article is part of a series on the politics and government of Northern Ireland 1921–72 |
The Northern Ireland general election, 1958 was held on 20 March 1958. Like all previous elections to the Parliament of Northern Ireland, it produced a large majority for the Ulster Unionist Party.
Results
| Northern Ireland General Election 1958 | |||||||||||||||
|---|---|---|---|---|---|---|---|---|---|---|---|---|---|---|---|
| Candidates | Votes | ||||||||||||||
| Party | Standing | Elected | Gained | Unseated | Net | % of total | % | № | Net % | ||||||
| UUP | 46 | 37 | 3 | 4 | - 1 | 71.2 | 44.0 | 106,177 | -4.6 | ||||||
| NI Labour | 8 | 4 | 4 | 0 | + 4 | 7.7 | 15.8 | 38,093 | +3.0 | ||||||
| Nationalist | 8 | 7 | 0 | 0 | 0 | 13.5 | 14.9 | 36,013 | +4.1 | ||||||
| Independent Unionist | 5 | 0 | 0 | 1 | 0 | 6.8 | 16,537 | N/A | |||||||
| Independent Labour | 2 | 0 | 0 | 1 | - 1 | 0.0 | 3.1 | 7,544 | +0.6 | ||||||
| Republican Labour | 1 | 1 | 0 | 0 | 0 | 1.9 | 3.1 | 7,510 | +0.8 | ||||||
| Irish Labour | 3 | 0 | 0 | 1 | - 1 | 3.0 | 7,321 | -2.1 | |||||||
| Independent Nationalist | 2 | 1 | 1 | 0 | + 1 | 1.9 | 2.1 | 5,168 | N/A | ||||||
| Independent Protestant Unionist | 1 | 0 | 0 | 0 | 0 | 2.0 | 4,704 | N/A | |||||||
| Ind. Labour Group | 1 | 1 | 1 | 0 | + 1 | 1.9 | 2.0 | 4,683 | N/A | ||||||
| Independent | 2 | 1 | 0 | 0 | 0 | 1.9 | 1.8 | 4,231 | +1.1 | ||||||
| Independent Irish Labour | 1 | 0 | 0 | 0 | 0 | 1.1 | 2,761 | -2.5 | |||||||
| Liberal | 1 | 0 | 0 | 0 | 0 | 0.3 | 759 | N/A | |||||||
Electorate: 891,064 (359,816 in contested seats); Turnout: 67.1% (241,501).
Votes summary
Seats summary
References
See also
This article is issued from Wikipedia - version of the 5/29/2015. The text is available under the Creative Commons Attribution/Share Alike but additional terms may apply for the media files.